k-means聚类 python实现
有用请点赞,没用请差评。
欢迎分享本文,转载请保留出处。
kmeans算法又名k均值算法。其算法思想大致为:先从样本集中随机选取 kk 个样本作为簇中心,并计算所有样本与这 kk个“簇中心”的距离,对于每一个样本,将其划分到与其距离最近的“簇中心”所在的簇中,对于新的簇计算各个簇的新的“簇中心”。
根据以上描述,我们大致可以猜测到实现kmeans算法的主要三点:
(1)簇个数 kk 的选择
(2)各个样本点到“簇中心”的距离
(3)根据新划分的簇,更新“簇中心”
算法步骤:
代码:
# -*- coding:utf-8 -*-
# kmeans : k-means cluster

import numpy as np
import matplotlib.pyplot as plt

def readfile(filename):
    """
    读取数据集
    W:特征向量数组,只取前两个特征
    label:标签(类别)列表
    :param filename:
    :return:特征向量数组和标签集合列表
    """
    save_path="D:\\python3_anaconda3\\学习\机器学习\\机器学习数据集\\"
    with open(save_path+filename,'r') as f:

        length=len(f.readlines())
        print(filename,"length: %d"%length)
        W = np.zeros((length,2))
        label=[]
        i=0

        f.seek(0,0)
        for line in f.readlines():
            linestr=line.strip()
            linestrlist=line.split(',')
            # print(linestrlist)
            # 鸢尾属植物数据集的特征共有四个,我们这里只取前两个特征作为特征向量,当然这样分类肯定是不准确的。
            number_data=[float(j) for j in linestrlist[0:2]]
            W[i,:]=np.array(number_data)
            label.append(linestrlist[4].strip('\n'))
            i+=1
    return W,label

def createDataset(filename):
    """
    创建待分类数据集
    """
    data_vector,label_str=readfile(filename)
    # print(data_vector,"\n",label)

    # 将原始数据集中非字符串标签改为用数字代表,用户后续画图
    label_num=[]
    for i in label_str:
        if i=="Iris-setosa":
            label_num.append(0)
        elif i=="Iris-versicolor":
            label_num.append(1)
        else:
            label_num.append(2)
    return  data_vector,label_num

# 计算欧式距离
def euclDistance(vector1,vector2):
    return np.sqrt(sum(pow(vector2-vector1,2)))  # pow()是自带函数

# 使用随机样例初始化质心
def initCentroids(dataSet,k):

    numSamples,dim = dataSet.shape
    # numSample - 行,此处代表数据集数量  dim - 列,此处代表维度,例如只有xy轴的,dim=2
    centroids = np.zeros((k, dim))  # 产生k行,dim列零矩阵
    for i in range(k):
        index = int(np.random.uniform(0, numSamples))  # 给出一个服从均匀分布的在0~numSamples之间的整数
        centroids[i, :] = dataSet[index, :]  # 第index行作为簇心
    # print(centroids)
    return centroids

# k均值聚类
def kmeans(dataSet, k):
    numSamples = dataSet.shape[0]
    print(numSamples)
    # frist column stores which cluster this sample belongs to,
    # second column stores the error between this sample and its centroid

    clusterAssment = np.zeros((numSamples, 2))
    clusterChanged = True

    ## step 1: init centroids
    centroids = initCentroids(dataSet, k)

    while clusterChanged:
            clusterChanged = False
            ## for each sample
            for i in range(numSamples):
                minDist = 1000000.0  # 最小距离
                minIndex = 0  # 最小距离对应的点群
                ## for each centroid
                ## step2: find the centroid who is closest
                for j in range(k):
                    distance = euclDistance(centroids[j, :], dataSet[i, :])  # 计算每个数据到每个簇中心的欧式距离
                    if distance < minDist:  # 如果距离小于当前最小距离
                        minDist = distance  # 则最小距离更新
                        minIndex = j  # 对应的点群也会更新

                ## step 3: update its cluster
                if clusterAssment[i, 0] != minIndex:  # 如当前数据不属于该点群
                    # 此处与书本上算法步骤稍微有点不同:当有一个数据的分类错误时就clusterChanged = True ,便会重新计算簇心。而书本上的终止条件是是新簇心等于上一次迭代后的簇心
                    clusterChanged = True  # 聚类操作需要继续
                    clusterAssment[i, :] = minIndex, minDist**2

     ## step 4: update centroids
            for j in range(k):
                # 提取同一类别的向量
                pointsInCluster = dataSet[np.nonzero(clusterAssment[:, 0] == j)]
                # print("s",pointsInCluster.shape)
                # nonzeros返回的是矩阵中非零的元素的[行号]和[列号]
                # 将所有等于当前点群j的,赋给pointsInCluster,之后计算该点群新的中心
                centroids[j, :] = np.mean(pointsInCluster, axis=0)  #  对每列求均值

    # print("center",centroids)
    return centroids, clusterAssment


# show your cluster only available with 2-D data
def showCluster(dataSet, k, centroids, clusterAssment,old_label):
    numSamples, dim = dataSet.shape  # numSample - 样例数量  dim - 数据的维度
    if dim != 2:
        print (" not two-dimensional data")
        return 1

    mark = ['or', 'ob', 'og', 'ok', '^r', '+r', 'sr', 'dr', ' len(mark):
        print ("the k is too large! the max k is 10")
        return 1

    # draw all samples
    for i in range(numSamples):
        markIndex = int(clusterAssment[i, 0])
        plt.plot(dataSet[i, 0], dataSet[i, 1], mark[markIndex])
    plt.title(" The classification results of k-means cluster")

    mark = ['Dr', 'Db', 'Dg', 'Dk', '^b', '+b', 'sb', 'db', '
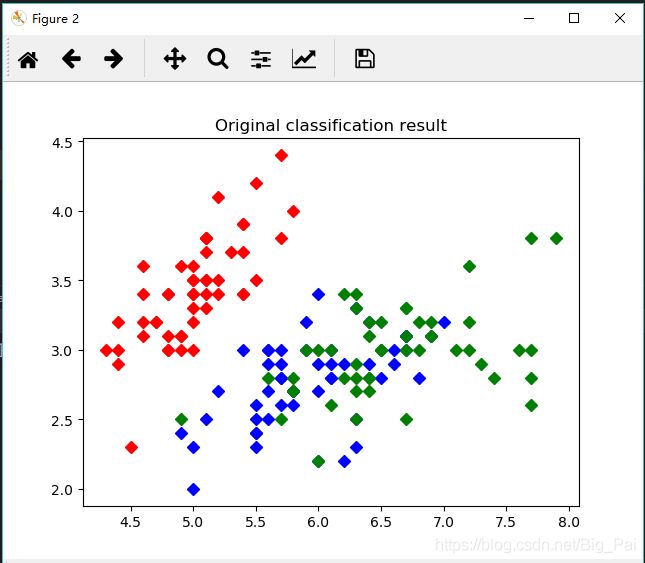
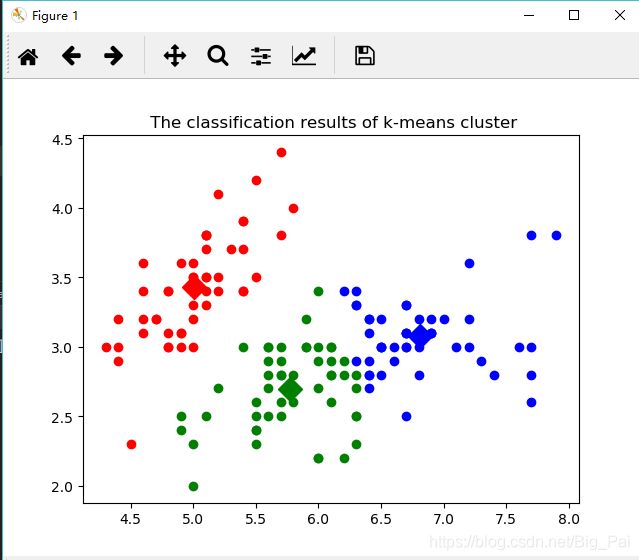
从散点图中可以看出,k-means聚类后和原始类别相比还是不错的,只是有少部分数据的分类是错误的,这也是可以原谅的,因为本次我们只选取了四个特征中的前两个来进行聚类,结果当然不会非常准确。


