PySpark —— 逻辑回归
一、逻辑回归
1.什么是逻辑回归
- 逻辑回归又称对数几率回归,是一种广义的线性回归分析模型
- 逻辑回归的工作原理:
- 利用回归思想解决分类问题,通常用于二分类问题
- 通过逻辑函数(Logistic或Sigmoid)将线性回归的结果(-∞,∞)映射为概率值(0,1)
# 线性回归算法解决回归问题: y值(目标值/标签值)为连续值, 如预测用户信用额度
# 逻辑回归算法解决分类问题: y值(目标值/标签值)为离散值(分类值), 如预测用户是否逾期
# 没有y值(目标值/标签值), 聚类问题
import numpy as np
import pandas as pd
import seaborn as sns
import matplotlib.pyplot as plt

%matplotlib inline
plt.rcParams['font.sans-serif'] = 'SimHei'
plt.rcParams['axes.unicode_minus'] = False
%config Inlinebackend.figure_format = 'svg'
2.线性回归函数
- 线性回归函数的数学表达式:
- 其中是自变量,是因变量,的值域为(-∞,∞),0是常数项,(=1,2,...,)是回归系数,不同的权重反映了自变量对因变量不同的影响程度
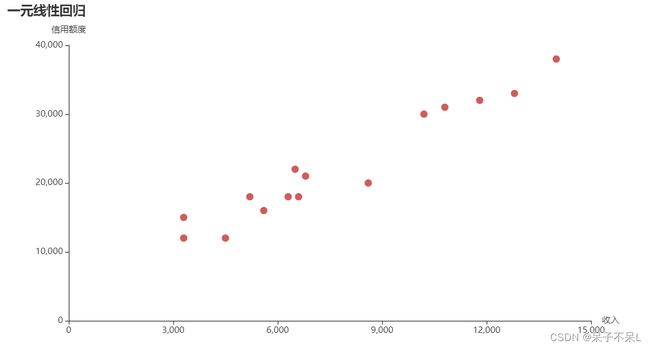
- 一元一次方程:=+,1个自变量称为一元线性回归
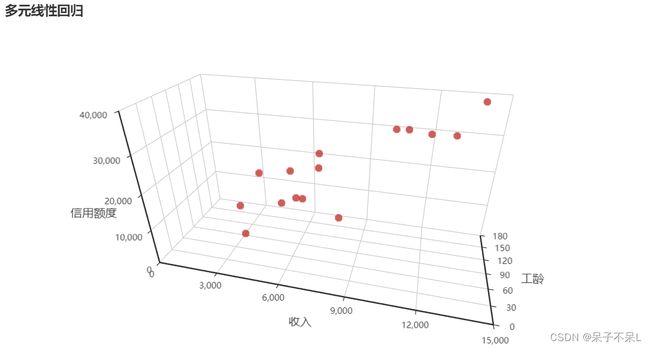
- 二元一次方程:=+11+22,2个自变量称为二元线性回归
- 多元一次方程:=+11+22+···+,2个及以上的自变量称为多元线性回归
# 0为截距, 0-n为斜率, T为转置
3.逻辑函数
- Logistic函数,也称Sigmoid函数
逻辑回归函数 = 线性回归函数 + 逻辑函数
- 逻辑函数的数学表达式:
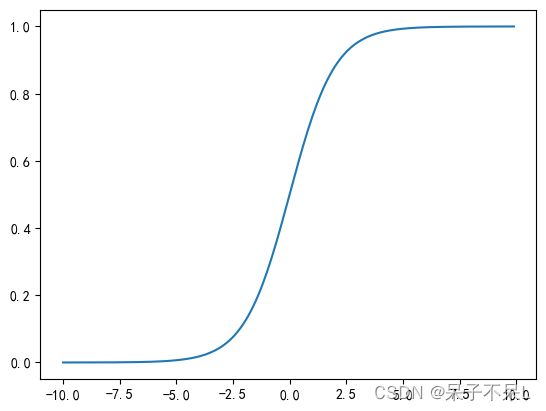
- 逻辑函数生成的图像:
# 自然常数
np.e
# 2.718281828459045

def func(x):
    return 1/(1+np.e**-x)

# 当 x 无限增大时,e**-x 趋近于 0,y 趋近于 1
# 当 x 无限减小时,e**-x 无穷大,y 趋近于 0
x = np.arange(-10, 10, 0.1)
y = func(x)

plt.figure(dpi=100)
sns.lineplot(x=x,y=y)
plt.show()     # 无限接近 0 和 1
4.逻辑函数的导函数
- 导数也叫导函数值,又名微商,微积分中的重要基础概念
- 当函数y=f(x)的自变量x在一点x0上产生一个增量Δx时,函数输出值的增量Δy与自变量增量Δx的比值在Δx趋于0时的极限a如果存在,a即为在x0处的导数,记作f'(x0)或df(x0)/dx
# 极限,广义上的极限就是指无限靠近而永远不能到达
# 导数:瞬间变化率

# 速度(V) = 距离(S)/时间(T)
# 平均速度 和 瞬间速度

# 匀速前进,直线,平均速度等于瞬间速度
# 加速前进,曲线,求平均速度,割线的斜率
# 加速前进,曲线,求瞬间速度,切线的斜率

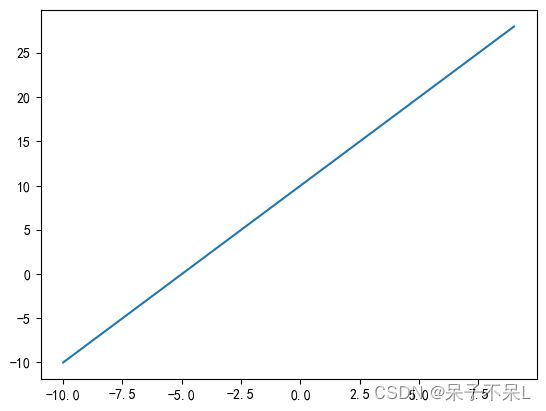
def func(x):
    return 2*x + 10

x = np.arange(-10,10,1)
y = func(x)

plt.figure(dpi=100)
sns.lineplot(x=x,y=y)
plt.show()


# y = 2*x + 1
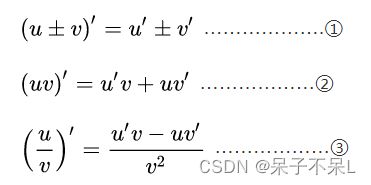
# y' = (2x + 1)'    (u±v)’ = u'±v'
# y' = (2x)' +1'     常数的导数为零
# y' = (2x)'      (uv)' = u'v + uv'
# y' = 2'x + 2x'   (x^n)' = nx^(n-1)
# y' = 0 + 2
# y' = 2- 逻辑函数的数学表达式:
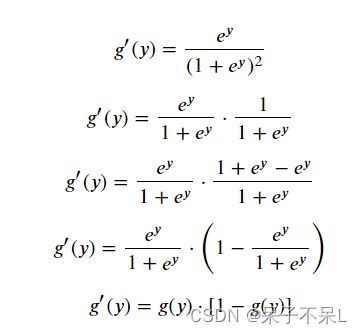
- 逻辑函数其导函数的数学表达式:
- 逻辑函数其导函数的数学表达式转换:
# 逻辑函数的导函数可以转换为本身的一个数学表达式,梯度下降法求解参数会使用到
# 逻辑函数是一个任意阶可导的函数
5.逻辑回归函数
- 逻辑回归的原理:通过逻辑函数(Logistic或Sigmoid)将线性回归的预测结果(-∞,∞)映射为概率值(0,1)
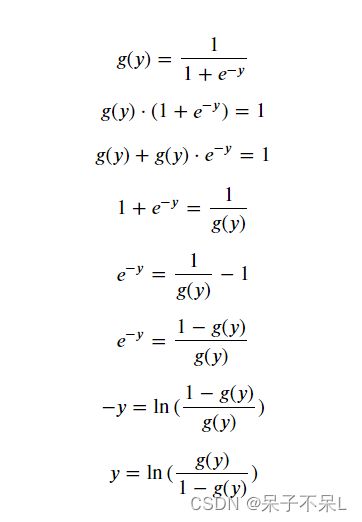
- 逻辑回归函数的数学公式:
- 数学求导:
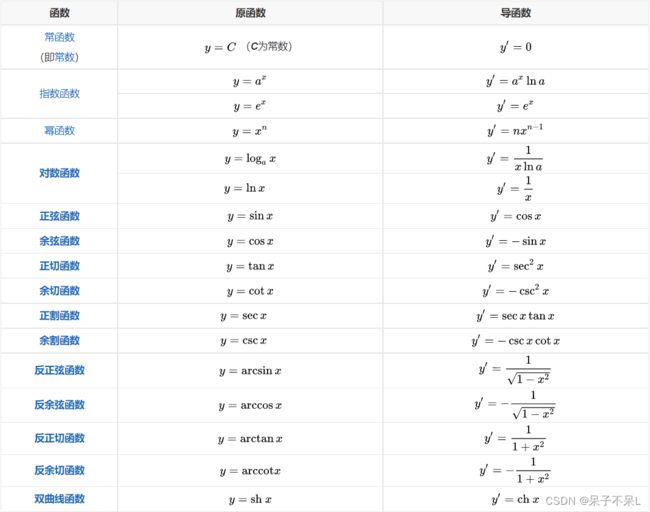
导数_百度百科
1、导数的四则运算:
2、原函数与反函数导数关系(由三角函数导数推反三角函数的):
y=f(x)的反函数是x=g(y),则有y'=1/x'。
3、复合函数的导数:
复合函数对自变量的导数,等于已知函数对中间变量的导数,乘以中间变量对自变量的导数(称为链式法则)。
4、变限积分的求导法则:
(a(x),b(x)为子函数)
- 逻辑回归函数的数学公式转换:
- 将逻辑回归的结果()作为某事件发生的概率,那么该事件不发生的概率为1−,两者的比值称为几率,即线性回归的结果等于对数几率,故逻辑回归又称对数几率回归
- 逻辑回归的应用:如果将流失用户的标签定义为1,正常用户的标签定义为0,那么逻辑函数(Logistic或Sigmoid)的结果可以定义为用户流失的后验概率
二、MLlib-逻辑回归
1.客户流失分析和预测
1.1.业务背景
- 目的是为了更好地了解客户流失的根本原因,以减少客户流失和提高产品销售额
- 通过机器学习算法建立模型,利用模型对存量客户进行流失预测,以及时采取措施进行挽留
1.2.数据描述
数据保存为sales_old.csv,以下是字段及其定义:
- names:客户名称
- age:客户年龄
- total_purchase:购买金额
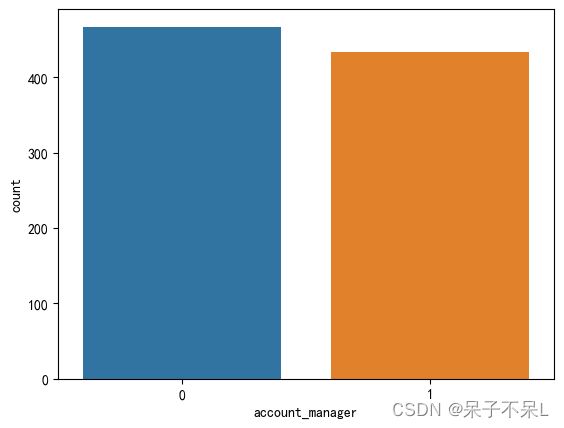
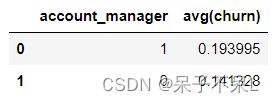
- account_manager:客户经理,0无客户经理,1有客户经理
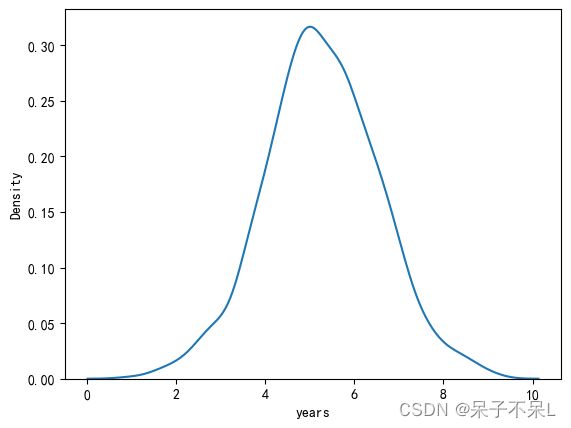
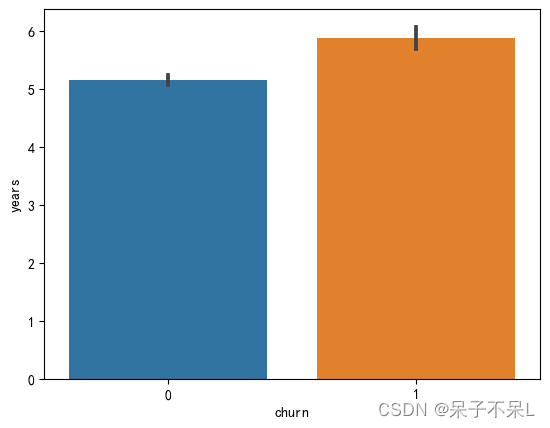
- years:客户的总年数
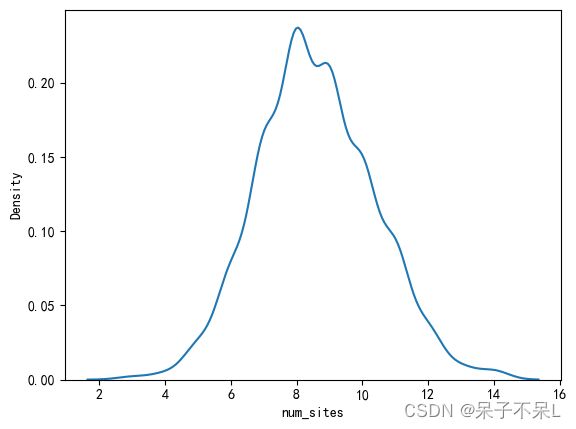
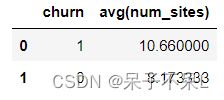
- num_sites:使用服务网站的数量
- onboard_date:登记日期
- location:客户地址
- company:客户公司
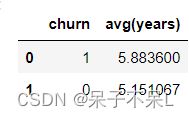
- churn:用户流失,0未流失,1已流失,用于监督机器学习的标签
1.3.加载数据
from pyspark.sql import SparkSession
import pyspark
from pyspark import SparkContext
import findspark
findspark.init()
sc = SparkContext.getOrCreate()

spark = SparkSession.builder.appName('ml_churn').getOrCreate()
spark
'''
SparkSession - in-memory

SparkContext

Spark UI

Version
v3.1.2
Master
local[*]
AppName
pyspark-shell
'''

# 读取本地csv文件
df = spark.read.csv("./data/sales_old.csv", header=True, inferSchema=True)
1.3.1.数据预览
# 查看字段列表
df.columns
'''
['names',
 'age',
 'total_purchase',
 'account_manager',
 'years',
 'num_sites',
 'onboard_date',
 'location',
 'company',
 'churn']
'''

# 查看字段的数据类型
df.dtypes
'''
[('names', 'string'),
 ('age', 'int'),
 ('total_purchase', 'double'),
 ('account_manager', 'int'),
 ('years', 'double'),
 ('num_sites', 'int'),
 ('onboard_date', 'string'),
 ('location', 'string'),
 ('company', 'string'),
 ('churn', 'int')]
'''

# 查看字段名称、数据类型、是否可空等架构信息
df.printSchema()
'''
root
 |-- names: string (nullable = true)
 |-- age: integer (nullable = true)
 |-- total_purchase: double (nullable = true)
 |-- account_manager: integer (nullable = true)
 |-- years: double (nullable = true)
 |-- num_sites: integer (nullable = true)
 |-- onboard_date: string (nullable = true)
 |-- location: string (nullable = true)
 |-- company: string (nullable = true)
 |-- churn: integer (nullable = true)
'''

# 查看前2行数据
df.toPandas().head(2)
# 查看指定字段的描述统计信息
cols = ['age', 'total_purchase', 'account_manager', 'years', 'num_sites', 'churn']
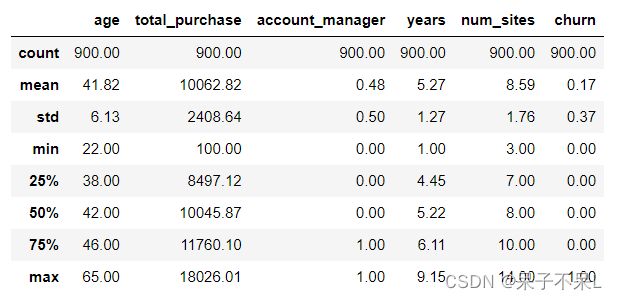
df.describe(cols).show()
'''
+-------+-----------------+-----------------+------------------+-----------------+------------------+-------------------+
|summary| age| total_purchase| account_manager| years| num_sites| churn|
+-------+-----------------+-----------------+------------------+-----------------+------------------+-------------------+
| count| 900| 900| 900| 900| 900| 900|
| mean|41.81666666666667|10062.82403333334|0.4811111111111111| 5.27315555555555| 8.587777777777777|0.16666666666666666|
| stddev|6.127560416916251|2408.644531858096|0.4999208935073339|1.274449013194616|1.7648355920350969| 0.3728852122772358|
| min| 22| 100.0| 0| 1.0| 3| 0|
| max| 65| 18026.01| 1| 9.15| 14| 1|
+-------+-----------------+-----------------+------------------+-----------------+------------------+-------------------+
# 选择数值类型的字段进行描述统计
cols = [i[0] for i in df.dtypes if i[1] in ["int", "double"]]
df.select(cols).toPandas().describe().round(2)
1.3.2.处理空值
import numpy as np
import matplotlib.pyplot as plt
import seaborn as sns
plt.rcParams['font.sans-serif'] = 'SimHei'
plt.rcParams['axes.unicode_minus'] = False
%matplotlib inline

# 转换为pandas的df,可视化使用
pdf = df.toPandas()

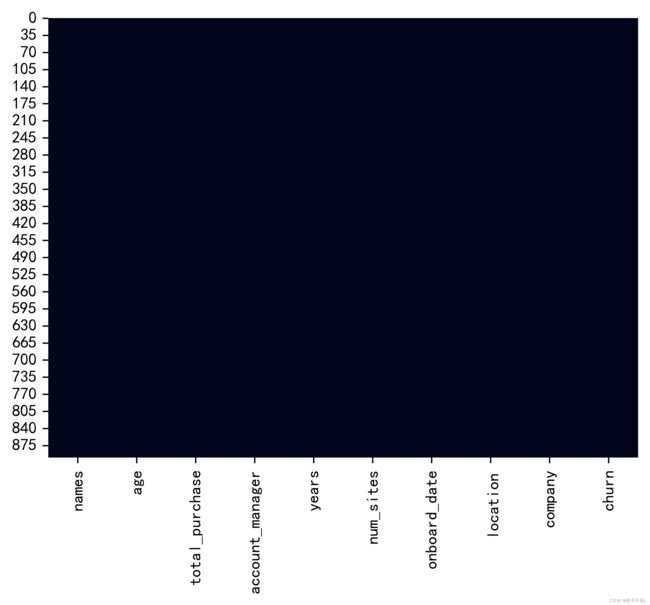
# 通过可视化,查看数据缺失情况,如果缺失会出现空白条
plt.figure(dpi=500)
sns.heatmap(pdf.isnull(), cbar=False)
plt.show()
# 查看指定列的空值数量
df.select('names').filter("churn is null").count()
# 0
# 删除空值
df.dropna()
# 删除指定列的空值
df.dropna(subset="churn")
'''
DataFrame[names: string, age: int, total_purchase: double, account_manager: int, years: double, num_sites: int, onboard_date: string, location: string, company: string, churn: int]
'''1.4.EDA探索性分析
1.4.1.age
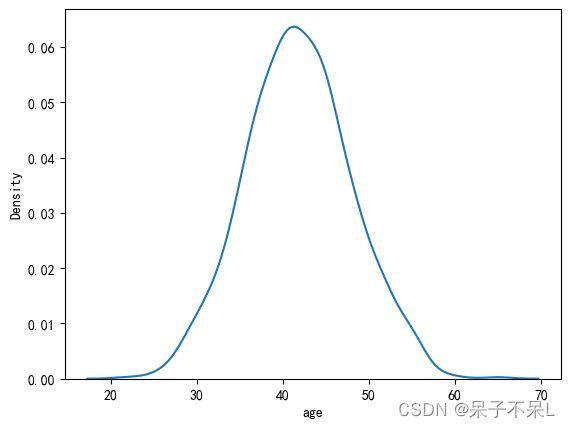
plt.figure(dpi=100)
sns.kdeplot(data=pdf, x='age')
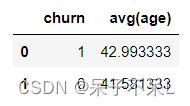
plt.show()df.groupBy('churn').avg('age').toPandas()plt.figure(dpi=100)
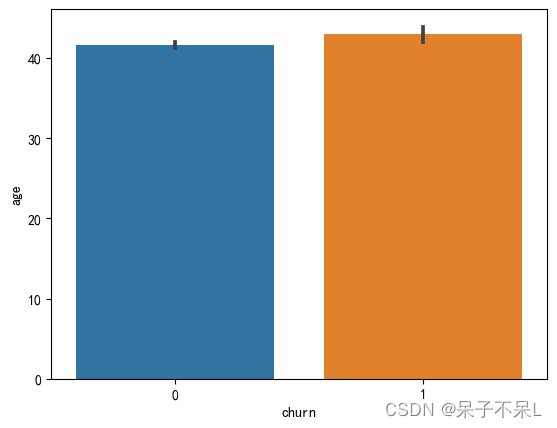
sns.barplot(data=pdf, x='churn', y='age', estimator=np.mean)
plt.show()1.4.2.total_purchase
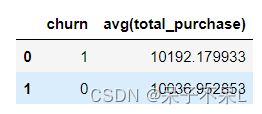
df.groupBy('churn').avg('total_purchase').toPandas()plt.figure(dpi=100)
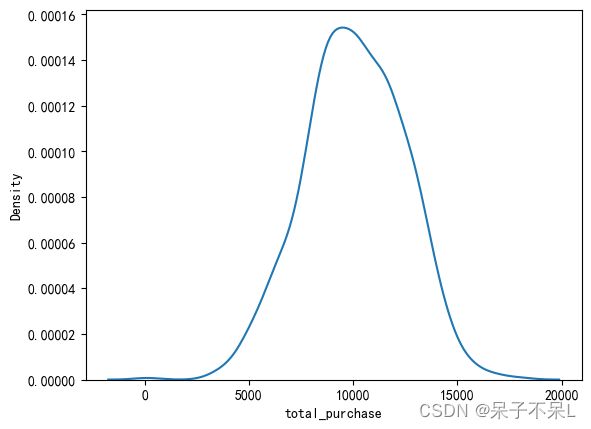
sns.kdeplot(data=pdf, x='total_purchase')
plt.show()print('峰度系数',pdf['total_purchase'].kurt())
print('偏度系数',pdf['total_purchase'].skew())
'''
峰度系数 0.004888083117478903
偏度系数 -0.10444105431655137
'''1.4.3.account_manager
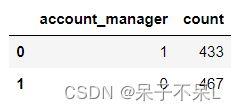
tmp = df.groupBy('account_manager').count().toPandas()
tmp
plt.figure(dpi=100)
sns.barplot(data=tmp, x='account_manager', y='count', estimator=np.mean)
plt.show()# 客户流失率
df.groupBy('account_manager').avg('churn').toPandas()1.4.4.years
plt.figure(dpi=100)
sns.kdeplot(data=pdf, x='years')
plt.show()df.groupBy('churn').avg('years').toPandas()plt.figure(dpi=100)
sns.barplot(data=pdf, x='churn', y='years', estimator=np.mean)
plt.show()1.4.5.num_sites
plt.figure(dpi=100)
sns.kdeplot(data=pdf, x='num_sites')
plt.show()
print('峰度系数',pdf['num_sites'].kurt())
print('偏度系数',pdf['num_sites'].skew())
'''
峰度系数 0.1273560402362479
偏度系数 0.18593618902651404
'''
df.groupBy('churn').avg('num_sites').toPandas()plt.figure(dpi=100)
sns.barplot(data=pdf, x='churn', y='num_sites')
plt.show()1.4.6.company
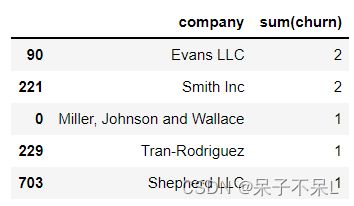
temp = df.groupBy('company').sum('churn').toPandas()
temp.sort_values(by='sum(churn)', ascending=False).head()
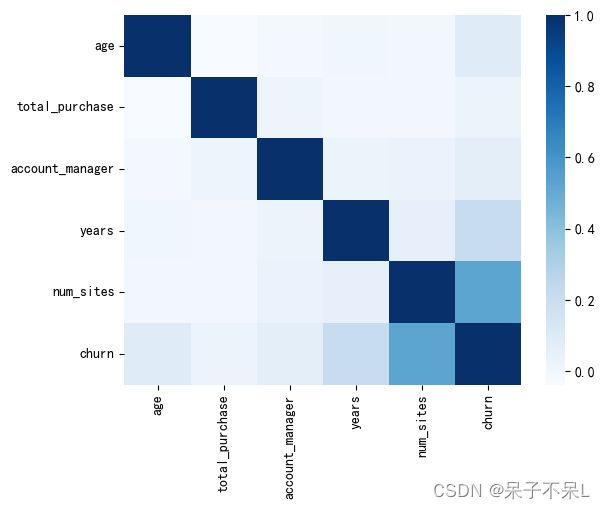
1.4.7.相关性分析
热力图
# 相关系数矩阵
data = pdf.corr()
data
# 如果两个特征变量出现相关系数极高的情况(多重共线性)
# 过滤掉方差/标准差(量纲不一致则计算离散系数/变异系数)较低的特征,避免模型过拟合
plt.figure(dpi=100)
sns.heatmap(data=data, cmap='Blues')
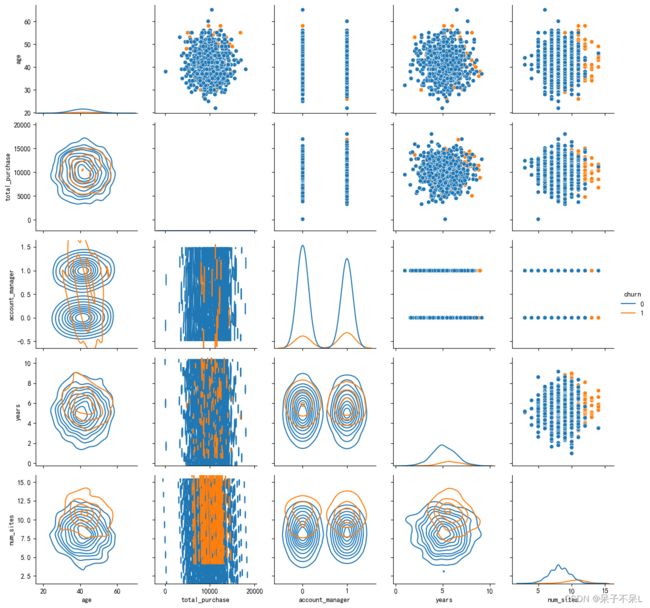
plt.show()散点图
g = sns.PairGrid(data=pdf, hue='churn')
g.map_upper(sns.scatterplot)    # 上三角
g.map_lower(sns.kdeplot)    # 下三角
g.map_diag(sns.kdeplot)    # 对角线
g.add_legend()    # 添加图例
plt.show()
2.模型训练
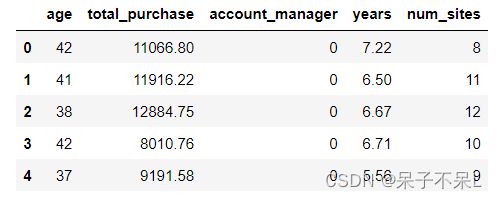
# 导入模型和特征
inputCols = ['age','total_purchase','account_manager','years','num_sites']

df.select(inputCols).toPandas().head()
# 通过 VectorAssembler 向量汇编器将特征合并为一列
from pyspark.ml.feature import VectorAssembler
assembler = VectorAssembler(inputCols=inputCols,outputCol='features')
trans_df = assembler.transform(df)
final_df = trans_df.select('features','churn')
final_df.show(5)
'''
+--------------------+-----+
| features|churn|
+--------------------+-----+
|[42.0,11066.8,0.0...| 1|
|[41.0,11916.22,0....| 1|
|[38.0,12884.75,0....| 1|
|[42.0,8010.76,0.0...| 1|
|[37.0,9191.58,0.0...| 1|
+--------------------+-----+
only showing top 5 rows
'''
from pyspark.ml.classification import LogisticRegression
# 实例化逻辑回归算法, labelCol 预测目标值(标签值)
lr = LogisticRegression(featuresCol='features', labelCol='churn')
# 将数据拆分成训练集和测试集, 70%用于训练模型,30%用于测试模型
trian, test = final_df.randomSplit([0.7,0.3],seed=777)
# 使用训练集进行模型训练
model = lr.fit(trian)
# 查看模型训练结果
model.summary.predictions.show(5) # 结果中 churn 为实际值,prediction 为预测值
'''
+--------------------+-----+--------------------+--------------------+----------+
| features|churn| rawPrediction| probability|prediction|
+--------------------+-----+--------------------+--------------------+----------+
|[22.0,11254.38,1....| 0.0|[4.16863167439137...|[0.98476236005753...| 0.0|
|[25.0,9672.03,0.0...| 0.0|[4.14229707613147...|[0.98436211099035...| 0.0|
|[26.0,8939.61,0.0...| 0.0|[5.71881634652530...|[0.99672715146791...| 0.0|
|[27.0,8628.8,1.0,...| 0.0|[4.88130031669496...|[0.99246998933636...| 0.0|
|[28.0,9090.43,1.0...| 0.0|[1.41497432447519...|[0.80454933983657...| 0.0|
+--------------------+-----+--------------------+--------------------+----------+
only showing top 5 rows
'''
# 查看模型训练结果的描述统计信息
model.summary.predictions.describe().show(5)
'''
+-------+-------------------+-------------------+
|summary| churn| prediction|
+-------+-------------------+-------------------+
| count| 596| 596|
| mean|0.15771812080536912|0.11073825503355705|
| stddev| 0.3647826488674893|0.31407132725118314|
| min| 0.0| 0.0|
| max| 1.0| 1.0|
+-------+-------------------+-------------------+
'''3.模型评估
from pyspark.ml.evaluation import BinaryClassificationEvaluator
evaluator = BinaryClassificationEvaluator(rawPredictionCol='prediction', labelCol='churn')
result = model.evaluate(test)
auc = evaluator.evaluate(result.predictions)
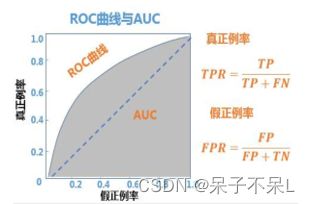
# ROC曲线:接受者操作特征曲线
# AUC:ROC曲线下方的面积大小
# 混淆矩阵
auc
# 0.7805299539170507| 混淆矩阵 | 预测结果 | ||
| Positive(1, 正例) | Negative(0, 负例) | ||
| 实际结果 | TRUE | TP(真正) | TN(真负) |
| FALSE | FP(假正) | FN(假负) | |
1. 准确率(Accuracy): 预测正确的样本比例, (TP+TN)/(TP+TN+FP+FN)
2. 错误率(Error): 预测错误的样本比例, (FP+FN)/(TP+TN+FP+FN)
3. 精确率/查准率(presision): 预测为正的样本中预测正确的比例, TP/(TP+FP)
4.召回率/查全率/命中率/灵敏度(Recall): 实际为正的样本中预测正确的比例, TP/(TP+FN)
5. 特异度, 实际为负的样本中预测正确的比例, TN/(FP+TN)
6. 假报警率, 实际为负的样本中预测错误的比例, FP/(FP+TN)
ROC曲线(接受者操作特征曲线)
横轴(x轴)为假报警率(FPR假正率)
纵轴(y轴)为召回率(TPR真正率)
4.保存模型
from pyspark.ml import Pipeline
pipeline = Pipeline(stages=[assembler,lr])
train,test = df.randomSplit([0.7,0.3],seed=777)
model = pipeline.fit(train)

model.write().overwrite().save('data/lr_churn')
5.预测新客户
new = spark.read.csv('data/sales_new.csv', inferSchema=True, header=True)
new.toPandas().head()
from pyspark.ml import PipelineModel
model_local = PipelineModel.load('data/lr_churn')
result = model_local.transform(new)
result.select('names','prediction').show()
'''
+--------------+----------+
| names|prediction|
+--------------+----------+
| Andrew Mccall| 0.0|
|Michele Wright| 1.0|
| Jeremy Chang| 1.0|
|Megan Ferguson| 1.0|
| Taylor Young| 0.0|
| Jessica Drake| 1.0|
+--------------+----------+
'''
