Bobo老师机器学习笔记第九课-PR曲线和ROC曲线
在上篇文章中,我们已经概述了PR曲线。现在做个简单的回归
1、什么是PR曲线?
PR曲线是精准率(Precision)和召回率(Recall)的缩写,
精准率表示在预测的关注事件中,其中预测正确的有多少。 Precision = TP / (TP + FP)
召回率表示在实际的关注事件中,正确预测出来了有多少。 Recall = TP / (FN + TP)
然后以recall为X轴, Precision为Y轴。
在曲线下降最厉害的点就是模型最好的点。 像上面图形在0.9左右。
1、什么是ROC曲线?
ROC曲线是Receiver Operating Characteristic的简称,主要用来描述模型的识别能力随着阈值变化的曲线。
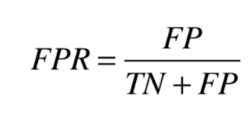
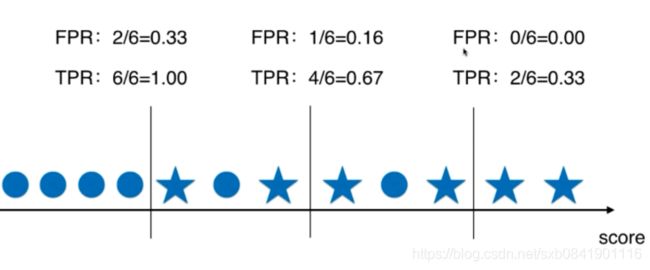
说到ROC要涉及两个概念: 误拒率TPR(True positive rate) 和误纳率FPR(false positive rate)
FPR表示正类样本中被判定为正类的比例
TPR表示负类样本中被判定为正类的比例
这两个存在正相关的关系。
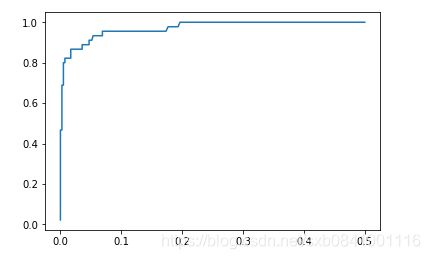
绘制曲线(横轴FPR,纵坐标是TPR ):
一般在ROC曲线中,我们关注是曲线下面的面积, 这个成为AUC(Area Under Curve)。这个AUC是横轴范围(0,1 ),纵轴是(0,1)所以总面积是小于1的。
ROC和AUC的主要应用:比较两个模型哪个好? 主要通过AUC能够直观看出来。
下面是在sklearn中如何绘制ROC
import numpy as np
import matplotlib.pyplot as plt
from sklearn.linear_model import LogisticRegression
from sklearn.model_selection import train_test_split

from sklearn.datasets import load_digits
from sklearn.metrics import confusion_matrix, precision_score, recall_score, f1_score, roc_curve, roc_auc_score, precision_recall_curve


X, target = load_digits(return_X_y=True)
y = target.copy()
y[target == 9] = 1
y[target != 9] = 0

X_train, X_test, y_train, y_test = train_test_split(X, y, random_state=666)

log_reg = LogisticRegression()
log_reg.fit(X_train, y_train)
y_predict = log_reg.predict(X_test)
confusion = confusion_matrix(y_test, y_predict)
score = log_reg.score(X_test, y_test)
precision = precision_score(y_test, y_predict)
recall = recall_score(y_test, y_predict)
f1_scores = f1_score(y_test, y_predict)
print 'confusion matrix:\n', confusion
print 'accuracy score:', score
print 'precision:', precision
print 'recall:', recall
print 'f1_scores:', f1_scores
decision_scores = log_reg.decision_function(X_test)
y_predict_2 = np.array(decision_scores >= 5, dtype='int')
confusion = confusion_matrix(y_test, y_predict_2)
print 'confusion matrix (decision_scores >= 5):\n', confusion


precisions = []
recalls = []

precisions, recalls, thresholds = precision_recall_curve(y_test, decision_scores)
#PR-Threshold
# plt.plot(thresholds, precisions, label='Precision')
# plt.plot(thresholds, recalls,  label='Recall')
# plt.legend()
# plt.show()

# PR
# plt.plot(precisions, recalls)
# plt.show()

fpr, tpr, thresholds = roc_curve(y_test, decision_scores)
# ROC
# plt.plot(fpr, tpr)
# plt.show()

roc_auc_score = roc_auc_score(y_test, decision_scores)
print 'roc_auc_score:\n', roc_auc_score
参考文章:
ROC和AUC介绍以及如何计算AUC


