2.1.SVM线性分类器
文章目录
-
- 1.笔记总结
-
- 1.1.Small Questions
-
- 1.1.1.图像xi的定义,行列的问题
- 1.1.2.np.hstack函数
- 1.1.3.np.random.randn()正态分布随机数函数
- 1.2.最优化损失函数
-
- 1.2.1.寻找更好的W的方法
- 1.2.2梯度下降
-
- 1.2.2.1.数值梯度
- 1.2.2.2.实际应用中的梯度下降
- 2.SVM的损失函数和解析梯度的计算
-
- 2.1.SVM损失函数定义
- 2.2.SVM损失函数的梯度推导(重点)
-
- 2.2.1.在某个数据点上的梯度推导(编程循环实现)
- 2.2.2.在所有数据点上的梯度推导(编程向量化实现)
- 3.作业编程记录
-
- 3.1.数据预处理
- 3.2.梯度下降中的小批量数据梯度下降
- 3.3.可视化结果(程序没看懂)
- 3.4.显示训练得到的权重的模板
- 3.5.**Inline questions**
参考笔记
CS231n课程笔记翻译:线性分类笔记(上)
CS231n课程笔记翻译:线性分类笔记(中)
注意:这里(下)的笔记是Softmax。
CS231n课程笔记翻译:最优化笔记(上)
CS231n课程笔记翻译:最优化笔记(下)
1.笔记总结
1.1.Small Questions
1.1.1.图像xi的定义,行列的问题
这里课程中前后并不统一,在数据集中将每张图片展开成了行向量,并且程序中也是将图片作为行向量使用,但是在课程的讲解中大部分又是将每张图片作为列向量,但是有的地方的讲解又把图片当成了行向量,所以这里比较模糊。
另外下面的公式存疑,按照下面的说法,图片应该是行向量,那么结果算出来就不是一个数字了,就成为一个矩阵了。所以下面的xi图片应该是一个列向量,Wj.T是一个行向量。
1.1.2.np.hstack函数
np.hstack()将参数元组的元素数组按水平方向进行叠加。这里在笔记中是在W权重中增加一个元素位置bias,从而编程全部向量化的形式。
import numpy as np

arr1 = np.array([[1,3], [2,4] ])
arr2 = np.array([[1,4], [2,6] ])
res = np.hstack((arr1, arr2))

print (res)

#
[[1 3 1 4]
 [2 4 2 6]]
1.1.3.np.random.randn()正态分布随机数函数
numpy.random.randn(d0,d1,…,dn)
- randn函数返回一个或一组样本,具有标准正态分布。
- dn表格每个维度
- 返回值为指定维度的array
1.2.最优化损失函数
1.2.1.寻找更好的W的方法
在引入梯度下降之前,有两个比较简单的方法,分别是随机搜索和随机本地搜索。
随机搜索:随便选N个权重W,在训练集上计算准确率,选择准确率最高的那个最为W。这个相当于我要一步找到最终的W,没有逐步减小损失函数,进行迭代更新W的思想。显然这就是在瞎搞碰运气。
随机本地搜索:这里就用到了迭代的思想。就是最初选择一个W之后,后面每一次都随机选择几个方向,设为δW,只有W+δW的损失函数值减小的时候才更新W,这样逐步迭代。这里就有了迭代的思想,实际上是可行的,只不过每一步的方向都是随机选的,需要算很多方向找到一个损失函数下降的方向,并且这个方向未必是下降最快的。所以这个方式比较耗时。
最后引入比较好的梯度下降的方法。梯度下降的方法在实际应用的时候还又分为几种。
1.2.2梯度下降
1.2.2.1.数值梯度
数值梯度的计算就是在当前的权重W所在位置,每次在一个维度上变化一点,然后由函数变化值求这个方向上的导数。遍历所有的方向,就得到了梯度。但是实际中由于神经网络非常大,用数值梯度在每个维度上都要求一次值非常耗费计算资源,所以一般不用他来进行训练,而是使用解析梯度,但是解析梯度需要推导容易出错,所以一般用数值梯度作为辅助,判断解析梯度计算是否正确。
如下为数值梯度求取的函数实现,其中np.nditer()函数可以参照 numpy迭代数组nditer。
def eval_numerical_gradient(f, x):
  """
  一个f在x处的数值梯度法的简单实现
  - f是只有一个参数的函数
  - x是计算梯度的点
  """

  fx = f(x) # 在原点计算函数值
  grad = np.zeros(x.shape)
  h = 0.00001

  # 对x中所有的索引进行迭代
  '''
  # np.nditer就是对数组进行迭代访问
  # 参数flags=['multi_index']意思是可以使用multi_index得到数组的索引,这个索引以元组的形式给出,表示当前访问的元素的位置。
  # 参数op_flags=['readwrite']代表可以对原数组进行写操作,因为默认这种迭代访问的方式是只能读不能写的,后面如果要改变数组的值,这里必须声明数组可以写。
  '''
  it = np.nditer(x, flags=['multi_index'], op_flags=['readwrite'])
  while not it.finished:

    # 计算x+h处的函数值
    ix = it.multi_index
    old_value = x[ix]
    x[ix] = old_value + h # 增加h
    fxh = f(x) # 计算f(x + h)
    x[ix] = old_value # 存到前一个值中 (非常重要)

    # 计算偏导数
    grad[ix] = (fxh - fx) / h # 坡度
    it.iternext() # 到下个维度

  return grad
1.2.2.2.实际应用中的梯度下降
由于损失函数是基于训练集的,也就是求的是所有训练集数据的损失函数的平均值。如果训练集很大,那么这样求梯度就比较浪费时间。此时有一种做法叫做小批量数据梯度下降(Mini-batch gradient descent):就是从训练集中选择少部分数据计算这些数据的梯度,从而作为整个训练集的梯度。每次数据批量的大小一般是2的指数,因为方便计算机运算。
小批量数据策略有个极端情况,那就是每个批量中只有1个数据样本,这种策略被称为随机梯度下降(Stochastic Gradient Descent 简称SGD),有时候也被称为在线梯度下降。这种策略在实际情况中相对少见,因为向量化操作的代码一次计算100个数据 比100次计算1个数据要高效很多。即使SGD在技术上是指每次使用1个数据来计算梯度,你还是会听到**人们使用SGD来指代小批量数据梯度下降(**或者用MGD来指代小批量数据梯度下降,而BGD来指代则相对少见)。
也就是说人们常说的随机梯度下降本质上是小批量数据梯度下降。
2.SVM的损失函数和解析梯度的计算
2.1.SVM损失函数定义
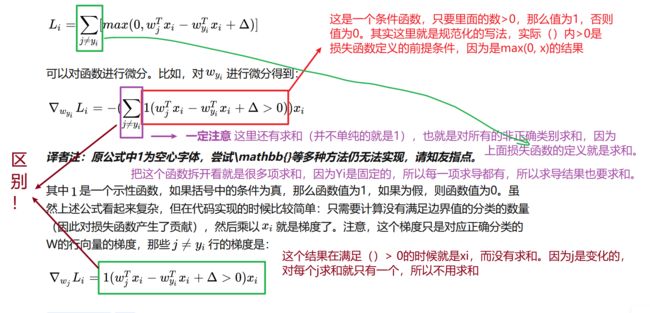
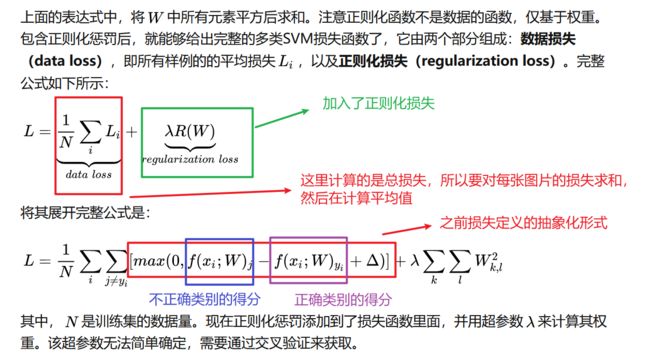
注意下面的损失函数和梯度的计算都是针对单张图片来说的,也就是都带有下标i。实际的损失函数和损失函数的梯度是针对N张图片计算平均值的,所以要/N。
2.2.SVM损失函数的梯度推导(重点)
2.2.1.在某个数据点上的梯度推导(编程循环实现)
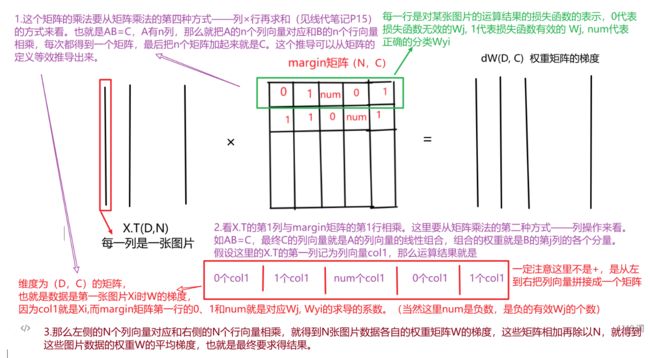
假设图像数据X维度是(N,D),也就是由N张图片,每张图片是D维的,一共分为C个类别,权重W维度是(D,C),那么最终的得分计算就是score = X(N, D) * W(D, C) = (N, C),如下图所示。根据上面的推导,计算权重矩阵的时候,就是考虑W的每一列。
def svm_loss_naive(W, X, y, reg):
    """
    Structured SVM loss function, naive implementation (with loops).

    Inputs have dimension D, there are C classes, and we operate on minibatches
    of N examples.

    Inputs:
    - W: A numpy array of shape (D, C) containing weights.
    - X: A numpy array of shape (N, D) containing a minibatch of data.
    - y: A numpy array of shape (N,) containing training labels; y[i] = c means
      that X[i] has label c, where 0 <= c < C.
    - reg: (float) regularization strength  正则化强度

    Returns a tuple of:
    - loss as single float
    - gradient with respect to weights W; an array of same shape as W
    """
    dW = np.zeros(W.shape)  # initialize the gradient as zero

    # compute the loss and the gradient
    num_classes = W.shape[1]
    num_train = X.shape[0]
    loss = 0.0
    for i in range(num_train):
        scores = X[i].dot(W)
        correct_class_score = scores[y[i]]
        for j in range(num_classes):
            if j == y[i]:
                continue
            margin = scores[j] - correct_class_score + 1  # note delta = 1
            if margin > 0:   # 这里是公式中的条件判断,只有损失>0的时候才是有效的损失,也就是
                # 此时的损失才计入损失函数,所以才能对参数求导
                loss += margin
                dW[:,j] += X[i,:].T     # 权重的正确类别之外的其他列,+Xi
                dW[:,y[i]] += -X[i,:].T  # 权重的正确类所所在的列,-Xi,注意这里实际是执行了
                # 所有有效Wj的次数(比如num),也就是公式中求和那里,所以最终是-num*Xi
    # Right now the loss is a sum over all training examples, but we want it
    # to be an average instead so we divide by num_train.
    loss /= num_train  # 损失函数的定义,最后要÷N,也就是÷图片的张数
    dW /= num_train   # 这里也是求平均梯度,上面for循环的内循环是根据每张图片求梯度,但是最终
                 # 损失函数是所有图片求和再平均,所以梯度也是求了和,最后也要平均
    # Add regularization to the loss. 正则化损失
    loss += reg * np.sum(W * W)  # 正则化损失,W^2
    dW += 2*reg * W          # 正则化损失求导,2*W
    #############################################################################
    # TODO:                                                                     #
    # Compute the gradient of the loss function and store it dW.                #
    # Rather that first computing the loss and then computing the derivative,   #
    # it may be simpler to compute the derivative at the same time that the     #
    # loss is being computed. As a result you may need to modify some of the    #
    # code above to compute the gradient.                                       #
    #############################################################################
    # *****START OF YOUR CODE (DO NOT DELETE/MODIFY THIS LINE)*****

    pass   # 这里梯度和损失的计算在上面的for循环中已经计算完成了

    # *****END OF YOUR CODE (DO NOT DELETE/MODIFY THIS LINE)*****

    return loss, dW
2.2.2.在所有数据点上的梯度推导(编程向量化实现)
from builtins import range
import numpy as np
from random import shuffle
from past.builtins import xrange


def svm_loss_naive(W, X, y, reg):
    """
    Structured SVM loss function, naive implementation (with loops).

    Inputs have dimension D, there are C classes, and we operate on minibatches
    of N examples.

    Inputs:
    - W: A numpy array of shape (D, C) containing weights.
    - X: A numpy array of shape (N, D) containing a minibatch of data.
    - y: A numpy array of shape (N,) containing training labels; y[i] = c means
      that X[i] has label c, where 0 <= c < C.
    - reg: (float) regularization strength  正则化强度

    Returns a tuple of:
    - loss as single float
    - gradient with respect to weights W; an array of same shape as W
    """
    dW = np.zeros(W.shape)  # initialize the gradient as zero

    # compute the loss and the gradient
    num_classes = W.shape[1]
    num_train = X.shape[0]
    loss = 0.0
    for i in range(num_train):
        scores = X[i].dot(W)
        correct_class_score = scores[y[i]]
        for j in range(num_classes):
            if j == y[i]:
                continue
            margin = scores[j] - correct_class_score + 1  # note delta = 1
            if margin > 0:   # 这里是公式中的条件判断,只有损失>0的时候才是有效的损失,也就是
                # 此时的损失才计入损失函数,所以才能对参数求导
                loss += margin
                dW[:,j] += X[i,:].T     # 权重的正确类别之外的其他列,+Xi
                dW[:,y[i]] += -X[i,:].T  # 权重的正确类所所在的列,-Xi
    # Right now the loss is a sum over all training examples, but we want it
    # to be an average instead so we divide by num_train.
    loss /= num_train  # 损失函数的定义,最后要÷N,也就是÷图片的张数
    dW /= num_train   # 这里也是求平均梯度,上面for循环的内循环是根据每张图片求梯度,但是最终
                 # 损失函数是所有图片求和再平均,所以梯度也是求了和,最后也要平均
    # Add regularization to the loss. 正则化损失
    loss += reg * np.sum(W * W)  # 正则化损失,W^2
    dW += 2*reg * W          # 正则化损失求导,2*W
    #############################################################################
    # TODO:                                                                     #
    # Compute the gradient of the loss function and store it dW.                #
    # Rather that first computing the loss and then computing the derivative,   #
    # it may be simpler to compute the derivative at the same time that the     #
    # loss is being computed. As a result you may need to modify some of the    #
    # code above to compute the gradient.                                       #
    #############################################################################
    # *****START OF YOUR CODE (DO NOT DELETE/MODIFY THIS LINE)*****

    pass   # 这里梯度和损失的计算在上面的for循环中已经计算完成了

    # *****END OF YOUR CODE (DO NOT DELETE/MODIFY THIS LINE)*****

    return loss, dW


def svm_loss_vectorized(W, X, y, reg):
    """
    Structured SVM loss function, vectorized implementation.

    Inputs and outputs are the same as svm_loss_naive.
    """
    loss = 0.0
    dW = np.zeros(W.shape)  # initialize the gradient as zero

    #############################################################################
    # TODO:                                                                     #
    # Implement a vectorized version of the structured SVM loss, storing the    #
    # result in loss.                                                           #
    #############################################################################
    # *****START OF YOUR CODE (DO NOT DELETE/MODIFY THIS LINE)*****
    num_classes = W.shape[1]
    num_train = X.shape[0]

    scores = X.dot(W)
    correct_class_score = scores[np.arange(num_train), y] # 用两个列表配合访问数组的方法,
            # np.arange(num_train)是行索引,y是一个列表,存放的是每张图片的类别,作为列索引
            # 这样索引得到的结果是一个降维的数组,也就是变成了一个向量
    # print(correct_class_score.shape)   (500,)
    correct_class_score = np.reshape(correct_class_score, (num_train, -1))  # 强制变成二维数组,
                 # 为了后面进行广播
    # print(correct_class_score.shape)    (500,1)
    margin = scores - correct_class_score + 1  # 先不管正确得分的那一列,先把所有列都按照wy-wx+1算
    margin[np.arange(num_train), y] = 0   # 正确索引的这一列不算损失,置为0,这是定义确定的
    margin[margin < 0] = 0           # 小于0的损失也不算,因为是公式max(0,wy-wx+1)来确定的
    loss += np.sum(margin) / num_train
    loss += reg * np.sum(W*W)

    # *****END OF YOUR CODE (DO NOT DELETE/MODIFY THIS LINE)*****

    #############################################################################
    # TODO:                                                                     #
    # Implement a vectorized version of the gradient for the structured SVM     #
    # loss, storing the result in dW.                                           #
    #                                                                           #
    # Hint: Instead of computing the gradient from scratch, it may be easier    #
    # to reuse some of the intermediate values that you used to compute the     #
    # loss.                                                                     #
    #############################################################################
    # *****START OF YOUR CODE (DO NOT DELETE/MODIFY THIS LINE)*****

    margin[margin>0] = 1
    row_sum = np.sum(margin, axis=1)
    margin[np.arange(num_train), y] = -row_sum
    dW += 1/num_train*X.T.dot(margin) + 2*reg*W

    # *****END OF YOUR CODE (DO NOT DELETE/MODIFY THIS LINE)*****

    return loss, dW
3.作业编程记录
3.1.数据预处理
1.将每个像素点都减去所有训练集的像素均值。为什么这样处理?
2.np.hstack()传参的问题:np.hstack的参数不应该是元组的形式吗,也就是将stack的两个数组放在元组里,写成
(arr1, arr2)的形式,然后作为参数传给np.hstack()。为什么这里是数组的形式进行传参?
# Preprocessing: subtract the mean image
# first: compute the image mean based on the training data
# 对每一个像素点求所有训练集图片的均值
mean_image = np.mean(X_train, axis=0)
print(mean_image[:10]) # print a few of the elements 这里只打印一部分,否则太多了
plt.figure(figsize=(4,4))
plt.imshow(mean_image.reshape((32,32,3)).astype('uint8')) # visualize the mean image
plt.show()

# second: subtract the mean image from train and test data
X_train -= mean_image
X_val -= mean_image
X_test -= mean_image
X_dev -= mean_image

# third: append the bias dimension of ones (i.e. bias trick) so that our SVM
# only has to worry about optimizing a single weight matrix W.
# 扩充W,在最后一个维度上+1,这样后面就把偏置b加到权重W中了
# 问题: np.hstack的参数不应该是元组的形式吗,也就是将stack的两个数组放在元组里,写成
# (arr1, arr2)的形式,然后作为参数传给np.hstack()。为什么这里是数组的形式进行传参?
X_train = np.hstack([X_train, np.ones((X_train.shape[0], 1))])
X_val = np.hstack([X_val, np.ones((X_val.shape[0], 1))])
X_test = np.hstack([X_test, np.ones((X_test.shape[0], 1))])
X_dev = np.hstack([X_dev, np.ones((X_dev.shape[0], 1))])

print(X_train.shape, X_val.shape, X_test.shape, X_dev.shape)
3.2.梯度下降中的小批量数据梯度下降
如下程序,在训练集中选出了batch_size大小的小批量数据计算梯度。由于权重的维度和数据量N无关,所以这里没有影响。
num_train = X.shape[0]
mask = np.random.choice(num_train, batch_size, replace=False)
X_batch = X[mask]
y_batch = y[mask]

# evaluate loss and gradient
loss, grad = self.loss(X_batch, y_batch, reg)  # loss是父类的虚函数,子类将会重写这个虚函数
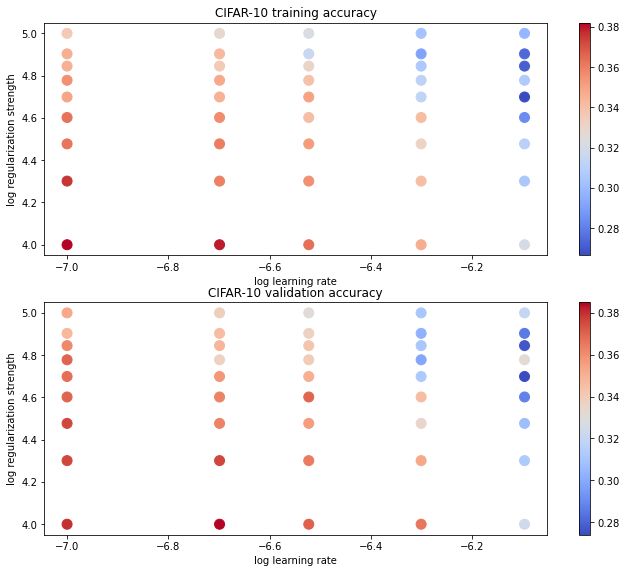
3.3.可视化结果(程序没看懂)
# Visualize the cross-validation results
# 以下部分都没看懂。。。。。。
import math
import pdb

# pdb.set_trace()

x_scatter = [math.log10(x[0]) for x in results]
y_scatter = [math.log10(x[1]) for x in results]

# plot training accuracy
marker_size = 100
colors = [results[x][0] for x in results]
plt.subplot(2, 1, 1)
plt.tight_layout(pad=3)
plt.scatter(x_scatter, y_scatter, marker_size, c=colors, cmap=plt.cm.coolwarm)
plt.colorbar()
plt.xlabel('log learning rate')
plt.ylabel('log regularization strength')
plt.title('CIFAR-10 training accuracy')

# plot validation accuracy
colors = [results[x][1] for x in results] # default size of markers is 20
plt.subplot(2, 1, 2)
plt.scatter(x_scatter, y_scatter, marker_size, c=colors, cmap=plt.cm.coolwarm)
plt.colorbar()
plt.xlabel('log learning rate')
plt.ylabel('log regularization strength')
plt.title('CIFAR-10 validation accuracy')
plt.show()
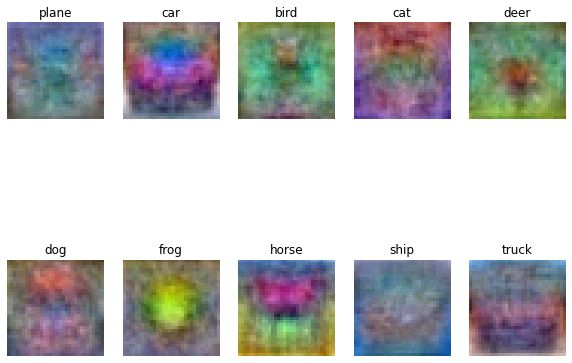
3.4.显示训练得到的权重的模板
# Visualize the learned weights for each class.
# Depending on your choice of learning rate and regularization strength, these may
# or may not be nice to look at.
w = best_svm.W[:-1,:] # strip out the bias  去掉偏置bias
w = w.reshape(32, 32, 3, 10)
w_min, w_max = np.min(w), np.max(w)  # w矩阵中的元素最小值和最大值
classes = ['plane', 'car', 'bird', 'cat', 'deer', 'dog', 'frog', 'horse', 'ship', 'truck']
for i in range(10):
    plt.subplot(2, 5, i + 1)

    # Rescale the weights to be between 0 and 255  把权重调整到0-255范围内,也就是图像的范围
    wimg = 255.0 * (w[:, :, :, i].squeeze() - w_min) / (w_max - w_min)
    # np.squeeze()是移除数组中维度为1的那个维度,也就是这里选中了某个类的模板,但是多了
    # 最后一维,所以这里要移除最后一维把模板变为和图片一样三维的,进一步用于显示。
    plt.imshow(wimg.astype('uint8'))
    plt.axis('off')
    plt.title(classes[i])
3.5.Inline questions
Inline Question 1
It is possible that once in a while a dimension in the gradcheck will not match exactly. What could such a discrepancy be caused by? Is it a reason for concern? What is a simple example in one dimension where a gradient check could fail? How would change the margin affect of the frequency of this happening? Hint: the SVM loss function is not strictly speaking differentiable
有时 gradcheck 中的维度可能会不完全匹配。 造成这种差异的原因是什么? 这是一个令人担忧的理由吗? 一维中梯度检查可能失败的简单示例是什么? 将如何改变这种发生频率的裕度影响? 提示:SVM 损失函数严格来说是不可微的。
Y:YourAnswer:
因为损失函数是max折页函数,在0的地方(也就是计算的wy-wx+detea等于0的时候)是连续的,但是并不可微,所以此时解析梯度和数值梯度不相等。 在实际应用中,应该尽量避免这些点。?怎么避免?
Inline question 2
Describe what your visualized SVM weights look like, and offer a brief explanation for why they look they way that they do.
Y:YourAnswer: 可视化的结果可以看成是所分类类别的模板,并且这个模板和颜色(背景)关系很大

