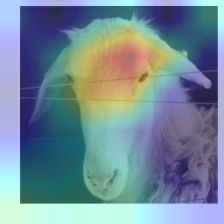
Grad-CAM热力图
参考博客
step1 将预测图片输入模型进行处理
img = image.load_img(img_path, target_size=(224,224))

x = image.img_to_array(img) #  img对象转化为array对象 shape=(224,224,3)

x = np.expand_dims(x,axis=0) # 升维,添加一个batch维

x = preprocess_input(x) # 对图片使用均值和标准差进行归一化
step2 求模型输出关于最后一层卷积层激活输出的梯度
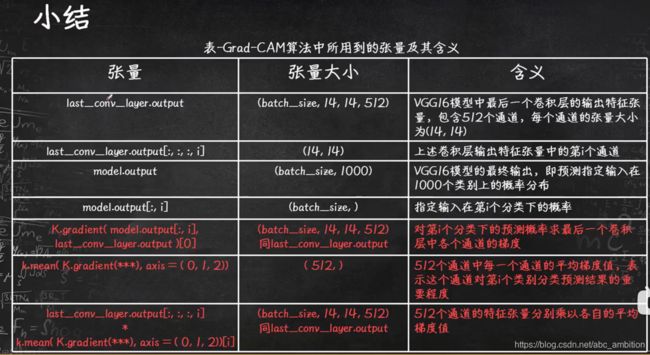
predict_output = model.output[:,386] # shape=(batch_size, 1000)

last_conv_layer=model.get_layer(‘block5_conv3’) # .output.shape=(batch_size, 14, 14, 512) 512为通道数

grads = K.gradients(predict_output, last_conv_layer.output)[0] # shape=(batch_size, 14, 14, 512) 第i个分类下的预测概率求最后一个卷积层中各通道的梯度

pooled_grads = K.mean(grads, axis=(0,1,2)) # shape=(512,) 512个通道中每一个通道的平均梯度

iterate = K.function([model.input],[pooled_grads, last_conv_layer.output[0]])

pooled_grads_value, conv_layer_output_value = iterate([x]) # 建立三者的函数关系
step3 最后卷积层激活输出各点位对模型决策分类的重要程度,并进行预处理
# 类激活图,用于表示每一个点位对于模型最后的分类决策的重要程度

for i in range(512):

conv_layer_output_value[:, :, i] *= pooled_grads_value[i]

heatmap = np.mean(conv_layer_output_value, axis=-1) # 沿着通道方向计算平均值

heatmap = np.maximum(heatmap,0) # 去除负数

heatmap /=max (heatmap) # 归一化处理

plt.matshow(heatmap)
step4 生成热力图
heatmap_test = cv2.resize(heatmap, (test.shape[1], test_shape[0]))

plt.imshow(heatmap_test)

heatmap_test = np.uint8(255*heatmap_test) # 将heatmap数组转换为(0,255)之间的无符号的uint8数值

heatmap_test = cv2.applyColorMap(heatmap_test, cv2.COLORMAP_JET) # 转换热力图为喷射效果

superimposed_img_test = heatmap_test * 0.5 + test # 热力图与原始图像叠加,0.5是渲染强度
Reference:
Example: