基于KITTI数据集的无人驾驶感知与传感器融合实现—(2)—图像的梯度空间特征提取
基于KITTI数据集的无人驾驶感知与传感器融合实现—(2)—图像的梯度空间特征提取
- 学习前言
- 一、Sobel边缘滤波器
- 二、主要API介绍
-
- 1、Numpy模块
-
- 1)```y = numpy.absolute(x)```
- 2)```y = numpy.sqrt(x)```
- 2、OpenCV模块
-
- 1)```dst =cv2.Sobel(src, ddepth, dx, dy, dst=None, ksize=None, scale=None, delta=None, borderType=None)```
- 2)```dst = cv2.convertScaleAbs (src [,dst [,alpha [,beta]]])```
- 三、代码实现&效果图
- 四、结论
- 五、原图
学习前言
五一假期结束了,又要开始秃头学习了。好好学习天天向上!这次是图像的梯度空间特征提取,简单的说就是用OpenCV实现Sobel边缘检测滤波器。老样子,我还是把原作者的项目连接放上面啦~ 连接.

一、Sobel边缘滤波器
额…关于Sobel滤波器我想有一点计算机视觉基础的同学都明白吧~我就简单的提一下吧,当做是复习,我后面也会专门写一下关于Sobel的博客,哈哈哈。
Sobel滤波器在 x , y x,y x,y方向上的核分别是:
S x = [ − 1 0 1 − 2 0 2 − 1 0 1 ] S y = [ − 1 − 2 − 1 0 0 0 1 2 1 ] S_x =\begin {bmatrix} -1 & 0 & 1 \\ -2 & 0 & 2 \\ -1 & 0 & 1 \end{bmatrix}\quad\quad\quad S_y =\begin {bmatrix} -1 & -2 & -1 \\ 0 & 0 & 0 \\ 1 & 2 & 1 \end{bmatrix} Sx=⎣⎡−1−2−1000121⎦⎤Sy=⎣⎡−101−202−101⎦⎤
至于为什么要进行梯度空间特征提取,是因为利用宏观物体在边缘处会成比较一致的梯度变化原理,将图像转换为灰度图像去除颜色干扰,通过抓取梯度变化较大的像素区域作为边缘或角点特征。
对于Sobel滤波器来说,将单个像素点与其周围邻近的像素点结合起来计算梯度,可以通过增加Sobel矩阵的大小,来改变包含邻近像素点的数量,从而增加感知区域,减小局部噪点影响。
二、主要API介绍
1、Numpy模块
1)y = numpy.absolute(x)
API功能:按元素计算绝对值。 numpy.abs是该功能的简写。
参数:
x: 输入数组。
返回:
y: 包含绝对值的ndarray。
2)y = numpy.sqrt(x)
API功能:以元素为单位返回数组的非负平方根。
参数:
x: 输入数组。需要平方根的值。
返回:
y: 与`x’形状相同的数组,包含正数 x中每个元素的平方根。 如果x中的任何元素是复数,返回一个复数数组(以及的平方根计算负实数)。
2、OpenCV模块
1)dst =cv2.Sobel(src, ddepth, dx, dy, dst=None, ksize=None, scale=None, delta=None, borderType=None)
API功能:使用扩展的Sobel运算符计算一阶,二阶,三阶或混合图像导数。
参数:
src: 输入图像。
ddepth: 输出图像深度,CV2.CV_64F(推荐)或-1(CV2.CV_8U)
dx: x方向的阶数。
dy: y方向的阶数。
dst: 输出与src相同大小和相同通道数的图像。(就是返回值)
ksize: Sobel内核的大小;它必须是1、3、5或7。为-1时为3✖3的Scharr算子,效果比3✖3的Sobel好(一般用Sobel就可以了)。
scale: (一般不用)计算得出的导数值的可选比例因子;默认情况下,不应用任何缩放。
delta: (一般不用)在将结果存储到dst之前将其添加到结果中的可选增量值。
borderType: (一般不用)像素外推方法。
返回:
dst: 经过Sobel滤波器后的图片。输出与src相同大小和相同通道数的图像。
2)dst = cv2.convertScaleAbs (src [,dst [,alpha [,beta]]])
API功能:缩放,计算绝对值,然后将结果转换为8位。 在输入数组的每个元素上,函数convertScaleAbs依次执行三个操作:缩放,获取绝对值,转换为无符号的8位类型:
d s t ( I ) = s a t u r a t e _ c a s t < u c h a r > ( ∣ s r c ( I ) ∗ a l p h a + b e t a ∣ ) dst(I)=saturate\_cast
如果是多通道阵列,该函数将独立处理每个通道。
参数:
src: 输入数组。
dst : 输出数组。(就是输出)
alpha :可选比例因子。
beta:可选增量添加到缩放值。
返回:
dst : 输出数组。
三、代码实现&效果图
import numpy as np
import cv2
import matplotlib.pyplot as plt
import matplotlib.image as mpimg
import pickle

# 读入图片
image = mpimg.imread('test_image/0000000086.png')


# 定义Sobel函数,因为做边缘检测时只考虑梯度的大小,所以对返回结果做绝对值处理
def sobel(img, orient='x', sobel_kernel=3, sobel_thresh=(30, 100)):
    # 转换为单通道灰度图,像素值做归一化
    gray = cv2.cvtColor(img, cv2.COLOR_RGBA2GRAY)
    # 按方向进行梯度计算
    if orient == 'x':
        sobel = cv2.Sobel(gray, cv2.CV_64F, 1, 0, ksize=sobel_kernel)
    if orient == 'y':
        sobel = cv2.Sobel(gray, cv2.CV_64F, 0, 1, ksize=sobel_kernel)
    abs_sobel = np.absolute(sobel)  # 对数组中的每一个元素求其绝对值。
    a = cv2.convertScaleAbs(sobel)
    # 转换到 8-bit (0 - 255) 并转换为type = np.uint8
    scaled_sobel = (abs_sobel / (np.max(abs_sobel) / 255)).astype(np.uint8)

    # 根据梯度阈值,创建一个二进制掩膜
    binary_output = np.zeros_like(scaled_sobel)

    # 将原图中高于阈值的像素点在掩膜中的对应位置置为1
    binary_output[(scaled_sobel >= sobel_thresh[0]) & (scaled_sobel <= sobel_thresh[1])] = 1

    return binary_output


# 定义像素点梯度总和函数
def mag_thresh(img, sobel_kernel=3, mag_thresh=(30, 100)):
    # 转换为单通道灰度图
    gray = cv2.cvtColor(img, cv2.COLOR_RGBA2GRAY)

    # 分别计算x,y方向梯度
    sobelx = cv2.Sobel(gray, cv2.CV_64F, 1, 0, ksize=sobel_kernel)
    sobely = cv2.Sobel(gray, cv2.CV_64F, 0, 1, ksize=sobel_kernel)

    # 计算梯度和
    gradmag = np.sqrt(np.absolute(sobelx) ** 2 + np.absolute(sobely) ** 2)

    # 计算梯度角
    theta = np.arctan2(np.absolute(sobely), np.absolute((sobelx)))

    # 转换到 8-bit (0 - 255) 并转换为type = np.uint8
    scaled_gradmag = (gradmag / (np.max(gradmag) / 255)).astype(np.uint8)

    # 根据梯度阈值,创建一个二进制掩膜
    binary_output = np.zeros_like(scaled_gradmag)

    # 将原图中高于阈值的像素点在掩膜中的对应位置置为1
    binary_output[(scaled_gradmag >= mag_thresh[0]) & (scaled_gradmag <= mag_thresh[1])] = 1

    return binary_output


# 对比输出
Sx_binary = sobel(img=image, orient='x', sobel_kernel=3, sobel_thresh=(30, 100))
Sx_binary_wider_thresh = sobel(img=image, orient='x', sobel_kernel=3, sobel_thresh=(30, 100))
Sx_binary_Larger_kernel = sobel(img=image, orient='x', sobel_kernel=9, sobel_thresh=(30, 100))

Sy_binary = sobel(img=image, orient='y', sobel_kernel=3, sobel_thresh=(150, 200))
Sy_binary_wider_thresh = sobel(img=image, orient='y', sobel_kernel=3, sobel_thresh=(15, 200))

mag_binary = mag_thresh(img=image, sobel_kernel=3, mag_thresh=(30, 100))
mag_binary_larger_kernel = mag_thresh(img=image, sobel_kernel=9, mag_thresh=(30, 100))
mag_binary_wider_thresh = mag_thresh(img=image, sobel_kernel=3, mag_thresh=(15, 200))
# 可视化结果
f, (ax1, ax2, ax3) = plt.subplots(3, 3, figsize=(20, 10))
f.tight_layout()

ax1[0].imshow(image)
ax1[0].set_title('Original Image', fontsize=30)
ax2[0].imshow(mag_binary, cmap='gray')
ax2[0].set_title('Thresholded Magnitude', fontsize=30)

ax1[1].imshow(Sx_binary, cmap='gray')
ax1[1].set_title('Sobelx', fontsize=30)
ax3[0].imshow(Sx_binary_wider_thresh, cmap='gray')
ax3[0].set_title('Sx_wider_thresh', fontsize=30)
ax3[2].imshow(Sx_binary_Larger_kernel, cmap='gray')
ax3[2].set_title('Sx_Larger_kernel', fontsize=30)

ax1[2].imshow(Sy_binary, cmap='gray')
ax1[2].set_title('Sobely', fontsize=30)
ax3[1].imshow(Sy_binary_wider_thresh, cmap='gray')
ax3[1].set_title('Sy_wider_thresh', fontsize=30)

ax2[1].imshow(mag_binary_larger_kernel, cmap='gray')
ax2[1].set_title('mag_Larger_kernel', fontsize=30)
ax2[2].imshow(mag_binary_wider_thresh, cmap='gray')
ax2[2].set_title('mag_wider_thresh', fontsize=30)
plt.subplots_adjust(left=0., right=1., top=0.9, bottom=0., wspace=0.2, hspace=0.1)
plt.show()
四、结论
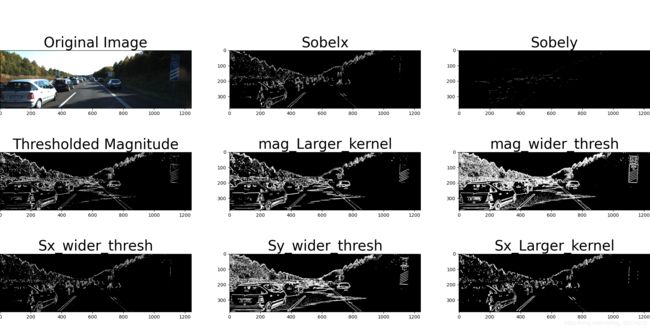
由以上图像处理结果发现,Sx的边缘检测效果比Sy要更明显,y方向需要更宽的threshold范围才能显示的比较明显;
x,y方向的梯度和可以更清晰的检测出图像中的所有轮廓,所以可以根据实际应用的不同来决定使用x,y或者梯度和的方式进行边缘检测; 调节参数kernel_size和梯度threshold,可发现更宽的threshold会检测出更多的目标点,同时也包含了较多噪点,而kernel_size加大会使图片保留更大尺度的边缘,降低对小尺度边缘的敏感性,一定程度抑制了噪点。
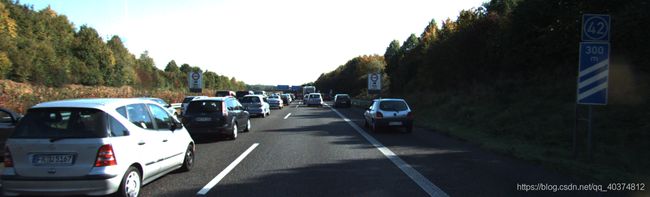
五、原图