Pandas快速入门--机器学习基础(python)
提示:文章写完后,目录可以自动生成,如何生成可参考右边的帮助文档
文章目录
- 内容预览
-
- Pandas的介绍
- 为什么使用pandas
- DataFrame
-
- DataFrame结构
- DataFrame的常用属性
- DataFrame索引的设置
-
-
- 修改行列索引值
- 重设索引
- 设置新索引
-
- MultiIndex与Panel
-
- MultiIndex
- Panel
- Series
-
- 创建Series
- Series获取索引和值
- 小结
内容预览
Pandas的介绍
pandas 是基于NumPy 的一种工具,该工具是为解决数据分析任务而创建的。Pandas 纳入了大量库和一些标准的数据模型,提供了高效地操作大型数据集所需的工具。pandas提供了大量能使我们快速便捷地处理数据的函数和方法。你很快就会发现,它是使Python成为强大而高效的数据分析环境的重要因素之一。
- 2008年WesMcKinney开发出的库
- 专门用于数据挖掘的开源python库
- 以Numpy为基础,借力Numpy模块在计算方面性能高的优势
- 基于matplotlib,能够简便的画图
- 独特的数据结构
为什么使用pandas
在numpy中我们创建一个数组,用来保存一组数据。例如:
代码如下(示例):
# 创建一个符合正太分布的10个股票5天的涨跌幅数据
import numpy as np

# 使用numpy随机产生正太分布数据
stock_change = np.random.normal(0,1,(10,5))
print(stock_change)

############ 以下为输出数据  ############
array([[-1.08485041, -0.34842665,  0.16937105, -0.96048585, -0.45758495],
       [ 1.33409037, -0.30710339,  0.11212532, -0.56545351, -1.42127284],
       [-0.76864313,  0.02356733,  2.10594683,  1.80596811,  0.0508716 ],
       [-0.20303839, -0.92013137,  1.62800386, -0.03827291,  0.23362688],
       [ 1.45840323,  0.35079363,  0.99600372, -0.4822938 ,  1.92777498],
       [-0.13702223, -0.14364656,  0.66929197,  0.45216653,  0.31359812],
       [ 0.01220798,  2.06825195,  0.23310581,  0.45631133,  0.68501933],
       [ 0.0843565 , -0.33691243,  0.98546642, -1.06529882, -0.78084191],
       [ 0.29767486, -0.31075858, -0.84199656, -0.17789619, -1.26268656],
       [ 0.39583152,  0.96114019, -1.22481965,  0.65542316, -0.03043587]])
这也就是为什么使用pandas而不用numpy的其中一个原因!!!
问题:如何让数据更有意义显示?
代码如下(示例):
# 使用pandas中的数据结构
import pandas as pd

stock_change = pd.DataFrame(stock_change)
stock_change.head(10)
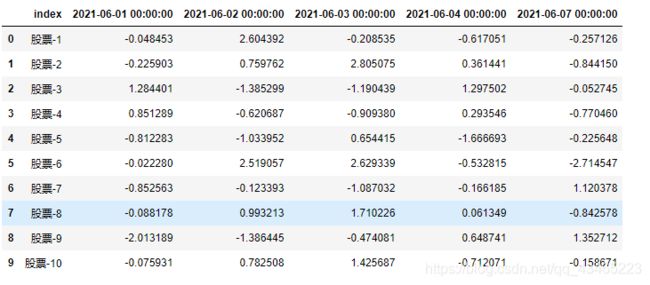
输出为:
# 使用pandas中的数据结构
# 生成行索引
stock_name = ["股票{}".format(i) for i in range(1,11)]
# 生成列索引
date = pd.date_range(start="20210601", periods=5, freq="B")
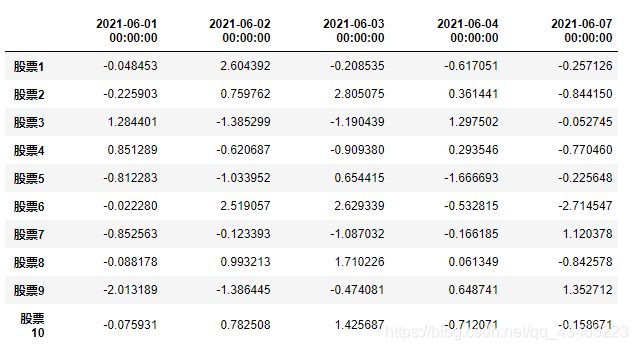
# 将数据加载到DataFrame中,并设置行列索引
pd.DataFrame(stock_change, index = stock_name, columns=date)
DataFrame
DataFrame是一个表格型的数据结构,它含有一组有序的列,每列可以是不同的值类型(数值、字符串、布尔值等)。DataFrame既有行索引也有列索引,它可以被看做由series组成的字典(共用同一个索引)
特点:DataFrame中面向行和面向列的操作基本是平衡的。
DataFrame中的数据是以一个或多个两维块存放的(而不是列表、字典或别的一维数据结构)。
DataFrame结构
DataFrame unifies two or more Series into a single data structure.Each Series then represents a named column of the DataFrame, and instead of each column having its own index, the DataFrame provides a single index and the data in all columns is aligned to the master index of the DataFrame.
翻译过来就是:DataFrame将两个或多个Series统一为一个数据结构。然后,每个Series表示DataFrame的一个命名列,而不是每个列都有自己的索引,DataFrame提供一个索引,并且所有列中的数据都与DataFrame的主索引对齐
DataFrame既有行索引,又有列索引
DataFrame的常用属性
data = pd.DataFrame(stock_change, index = stock_name, columns=date)  # (10,5)

# 形状
data.shape
# 输出为 : (10, 5)

# 行索引
data.index
# 输出为 :Index(['股票1', '股票2', '股票3', '股票4', '股票5', '股票6', '股票7', '股票8', '股票9', '股票10'], dtype='object')

# 列索引
data.columns
# 输出为:DatetimeIndex(['2021-06-01', '2021-06-02', '2021-06-03', '2021-06-04',
#                '2021-06-07'],
#               dtype='datetime64[ns]', freq='B')

# 值
data.values
# 输出为:
# array([[-0.04845281,  2.60439152, -0.20853452, -0.61705096, -0.25712631],
#       [-0.22590265,  0.75976229,  2.80507481,  0.36144067, -0.84414989],
#       [ 1.28440055, -1.38529944, -1.19043898,  1.29750247, -0.05274461],
#       [ 0.85128947, -0.62068679, -0.90938019,  0.29354633, -0.77046006],
#       [-0.81228261, -1.03395191,  0.65441486, -1.66669313, -0.22564844],
#       [-0.02227979,  2.51905747,  2.62933915, -0.53281486, -2.71454691],
#       [-0.85256332, -0.12339325, -1.08703236, -0.16618495,  1.12037824],
#       [-0.08817787,  0.99321341,  1.71022592,  0.06134898, -0.84257784],
#       [-2.01318878, -1.38644463, -0.47408145,  0.6487407 ,  1.3527118 ],
#       [-0.07593078,  0.78250811,  1.42568654, -0.71207098, -0.15867053]])

# 转置
data.T

常用方法:head()、tail(),这两种方法常用于想看我们的数据有哪些字段,或者构成
 data.head(3)  # 显示前三行
 data.tail(2)  # 显示后两行
data.head(3)输出为

data.tail(2)输出为

DataFrame索引的设置
修改行列索引值
注意:下面修改方式是错误的
data.index[2] = "股票-3"
## 返回以下错误
#         TypeError: Index does not support mutable operations
正确修改方式
# 创建新的索引列表
new_index = ["股票-{}".format(i) for i in range(1,11)]
# 修改索引
data.index = new_index
重设索引
# 使用默认情况
data = data.reset_index()
# 此时data的形状为(10,6)
print(data.shape)
# 重设索引时删除元索引
data.reset_index(drop=True)
默认会将原索引变为其中一列 data = data.reset_index():
data.reset_index(drop=True)返回:

设置新索引
·以某列值设置为新的索引
set_index(keys, drop=True)
keys :列索引名成或者列索引名称的列表
drop : boolean, default True.当做新的索引,删除原来的列
# 直接传入字典,字典的键为列索引
df = pd.DataFrame({"month":[1,4,7,10],
                  "year":[2012,2014,2013,2014],
                  "sale":[55,40,84,31]})
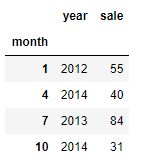
# 以月为索引
df.set_index("month", drop=True)
# 设置多个索引,以年和月份
new_df = df.set_index(["year","month"])

print(new_df.index)

########输出结果######
# MultiIndex(levels=[[2012, 2013, 2014], [1, 4, 7, 10]],
#           codes=[[0, 2, 1, 2], [0, 1, 2, 3]],
#           names=['year', 'month'])
通过刚才的设置,这样DataFrame就变成了一个具有MultiIndex的DataFrame
接下来介绍multiIndex与Panel
MultiIndex与Panel
MultiIndex
class pandas.Panel(data=None, items=None, major_axis=None, minor_axis=None,copy=False,dtpye=None)
存三维数组的Panel结构
MultiIndex值的获取:
# 设置多个索引,以年和月份
new_df = df.set_index(["year","month"])

new_df.index
### output ####
# MultiIndex(levels=[[2012, 2013, 2014], [1, 4, 7, 10]],
#           codes=[[0, 2, 1, 2], [0, 1, 2, 3]],
#           names=['year', 'month'])

new_df.index.levels
### output ####
##   FrozenList([[2012, 2013, 2014], [1, 4, 7, 10]])

new_df.index.codes
### output ####
##   FrozenList([[0, 2, 1, 2], [0, 1, 2, 3]])

new_df.index.names
### output ###
##   FrozenList(['year', 'month'])
Panel
多级或分层索引对象。
index属性
names: levels的名称
levels:每个level的元组值
p = pd.Panel(np.arange(24).reshape(4,3,2),
items=list("ABCD"),
major_axis=pd.date_range("20130101", periods=3),
minor_axis=['first', 'second'])
############## output ################
# - items - axis 0 ,每个项目对应于内部包含的数据帧(DataFrame)。
- major_axis - axis 1,它是每个数据帧(DataFrame)的索引(行)。
- minor_axis - axis 2,它是每个数据帧(DataFrame)的列。
### Panel在未来的版本中会被弃用 ###
Panel is deprecated and will be removed in a future version.
The recommended way to represent these types of 3-dimensional data are with a MultiIndex on a DataFrame, via the Panel.to_frame() method
Alternatively, you can use the xarray package http://xarray.pydata.org/en/stable/.
Pandas provides a `.to_xarray()` method to help automate this conversion.
  exec(code_obj, self.user_global_ns, self.user_ns)

注: Pandas从版本0.20.0开始弃用:推荐的用于表示3D数据的方法是DataFrame上的Multilndex方法
Series
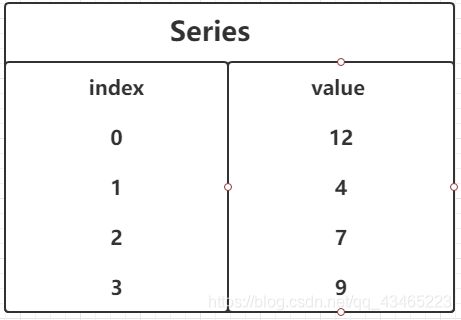
什么是Series结构呢,我们直接看下面的图:

Series只有行索引
我们仍然使用上述的股票数据
# 上述代码中的data为股票数据
print(data.iloc[1,:])
########  output #######
# 2021-06-01   -0.225903
# 2021-06-02    0.759762
# 2021-06-03    2.805075
# 2021-06-04    0.361441
# 2021-06-07   -0.844150
# Freq: B, Name: 股票-2, dtype: float64

print(type(data.iloc[1,:]))
##########output###########
#     pandas.core.series.Series
表名iloc返回的为Series类型
创建Series
通过已有数据创建
- 指定内容,默认索引
pd.Series(np.arange(3,9,2))
- 指定索引
pd.Series([6.7,5.6,3,10,2],index=[1,2,3,4,5])
- 通过字典数据创建
pd.Series({"red":100, "blue":200, "green":500, "yellow":1000})
Series获取索引和值
index
values
小结
本文主要讲了pandas的入门,以及在某些方面Pandas相对于Numpy的优点,pandas的特点;其次介绍了DataFrame的用法,和DataFrame相关的对象。Panel、Series、MultiIndex.
DataSeries的容器:行和列是两个不同Series
Panel是DataFrame的容器:从每个维度上看是三个不同DataFrame


