【十一】图像分割
1 图像分割基础知识
图像分割是将图像中具有特殊意义的区域划分开。
常用的方法有、和聚合等。
图像分割算法一般基于图像灰度值的不连续性(边缘检测、边界跟踪、Hough变换)或其相似性(区域生长、区域分裂与合并、阈值分割)。
2 边缘检测
边缘检测的基本步骤如下:
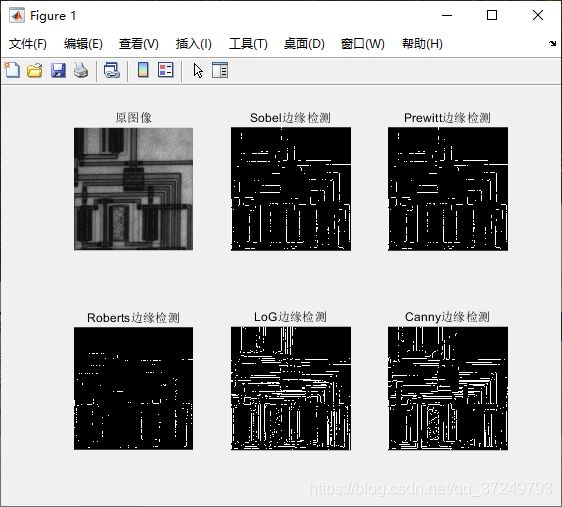
常用的边缘检测算子有梯度算子、高斯-拉普拉斯算子(Log)、Cany边缘检测算子等。
Matlb实现
intensity = imread('circuit.tif');

bw1 = edge(intensity, 'sobel');%边缘检测函数
bw2 = edge(intensity, 'prewitt');
bw3 = edge(intensity, 'roberts');
bw4 = edge(intensity, 'log');
bw5 = edge(intensity, 'canny');

subplot(2,3,1); imshow(intensity); title('原图像');
subplot(2,3,2); imshow(bw1); title('Sobel边缘检测');
subplot(2,3,3); imshow(bw2); title('Prewitt边缘检测');
subplot(2,3,4); imshow(bw3); title('Roberts边缘检测');
subplot(2,3,5); imshow(bw4); title('LoG边缘检测');
subplot(2,3,6); imshow(bw5); title('Canny边缘检测');
3 霍夫变换
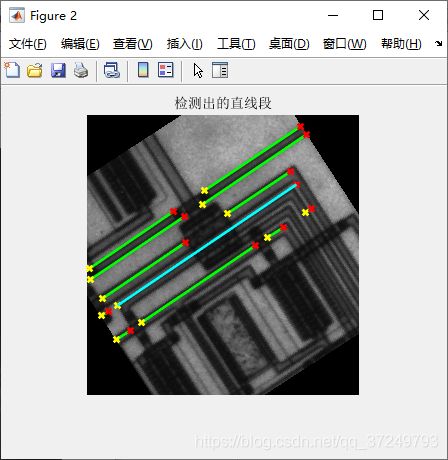
霍夫变换通过将图像坐标控件变换到参数控件,来实现直线和曲线的拟合。
Matlab实现
I  = imread('circuit.tif');

% 旋转图像并寻找边缘
rotI = imrotate(I,33,'crop');
BW = edge(rotI,'canny');

% 执行Hough变换并显示Hough矩阵
[H,T,R] = hough(BW);
imshow(H,[],'XData',T,'YData',R,'InitialMagnification','fit'),title('Hough矩阵和峰值点');
xlabel('\theta'), ylabel('\rho');
axis on, axis normal, hold on;

% 在Hough矩阵中寻找前5个大于Hough矩阵中最大值0.3倍的峰值
P  = houghpeaks(H,5,'threshold',ceil(0.3*max(H(:))));
x = T(P(:,2)); y = R(P(:,1)); % 由行、列索引转换成实际坐标
plot(x,y,'s','color','white'); % 在Hough矩阵图像中标出峰值位置

% 找到并绘制直线
lines = houghlines(BW,T,R,P,'FillGap',5,'MinLength',7); % 合并距离小于5的线段,丢弃所有长度小于7的直线段
figure, imshow(rotI), title('检测出的直线段'),hold on
max_len = 0;
for k = 1:length(lines) % 依次标出各条直线段
   xy = [lines(k).point1; lines(k).point2];
   plot(xy(:,1),xy(:,2),'LineWidth',2,'Color','green');

   % 绘制线段端点
   plot(xy(1,1),xy(1,2),'x','LineWidth',2,'Color','yellow');
   plot(xy(2,1),xy(2,2),'x','LineWidth',2,'Color','red');

   % 确定最长的线段
   len = norm(lines(k).point1 - lines(k).point2);
   if ( len > max_len)
      max_len = len;
      xy_long = xy;
   end
end

% 高亮显示最长线段
plot(xy_long(:,1),xy_long(:,2),'LineWidth',2,'Color','cyan');
4 阈值分割
利用灰度阈值变换分割图像就称为阈值分割。
阈值分割的步骤为确定阈值、然后将阈值和像素比较、最后把像素归类。
4.1 阈值分割方法
实验法
分局直方图谷底确定阈值
最小均方误差法
最大类间方差
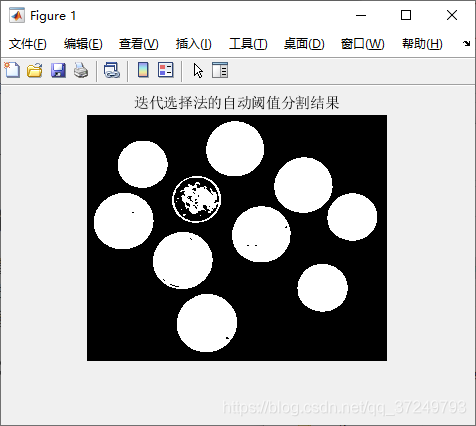
迭代选择阈值法
Matlab实现
I = imread('coins.png');
thres = 0.5 * (double(min(I(:))) + double(max(I(:)))); %初始阈值
done = false; %结束标志
while ~done
	g = I >= thres;
	Tnext = 0.5 * (mean(I(g)) + mean(I(~g)));
	done = abs(thres - Tnext) < 0.5;
	thres = Tnext;
end

Ibw = im2bw(I, thres/255);
figure,imshow(Ibw),title('迭代选择法的自动阈值分割结果');
disp(thres);
5 区域分割
5.1 区域生长
区域生长是根据规则将像素或区域聚合成更大区域的过程。
Matlab实现
运行后点击图像任意点,然后回车即可。
I = imread('coins.png');
if isinteger(I)
    I=im2double(I);
end
figure,imshow(I),title('原始图像');
[M,N]=size(I);
[y,x]=getpts;             %获得区域生长起始点
x1=round(x);            %横坐标取整
y1=round(y);            %纵坐标取整
seed=I(x1,y1);           %将生长起始点灰度值存入seed中
J=zeros(M,N);          %作一个全零与原图像等大的图像矩阵J,作为输出图像矩阵
J(x1,y1)=1;             %将J中与所取点相对应位置的点设置为白
sum=seed;              %储存符合区域生长条件的点的灰度值的和
suit=1;                 %储存符合区域生长条件的点的个数
count=1;               %记录每次判断一点周围八点符合条件的新点的数目
threshold=0.15;         %阈值,注意需要和double类型存储的图像相符合
while count>0
    s=0;                   %记录判断一点周围八点时,符合条件的新点的灰度值之和
     count=0;
     for i=1:M
       for j=1:N
         if J(i,j)==1
          if (i-1)>0 & (i+1)<(M+1) & (j-1)>0 & (j+1)<(N+1)  %判断此点是否为图像边界上的点
           for u= -1:1                               %判断点周围八点是否符合阈值条件
            for v= -1:1
              if  J(i+u,j+v)==0 & abs(I(i+u,j+v)-seed)<=threshold& 1/(1+1/15*abs(I(i+u,j+v)-seed))>0.8
                           J(i+u,j+v)=1;
                    %判断是否尚未标记,并且为符合阈值条件的点
                    %符合以上两条件即将其在J中与之位置对应的点设置为白
                 count=count+1;
                 s=s+I(i+u,j+v);                      %此点的灰度之加入s中
              end
            end
           end
          end
         end
       end
     end
    suit=suit+count;                                   %将n加入符合点数计数器中
    sum=sum+s;                                     %将s加入符合点的灰度值总合中
    seed=sum/suit;                                    %计算新的灰度平均值
end


figure,imshow(J),title('区域生长结果');
5.2 区域分割与合并
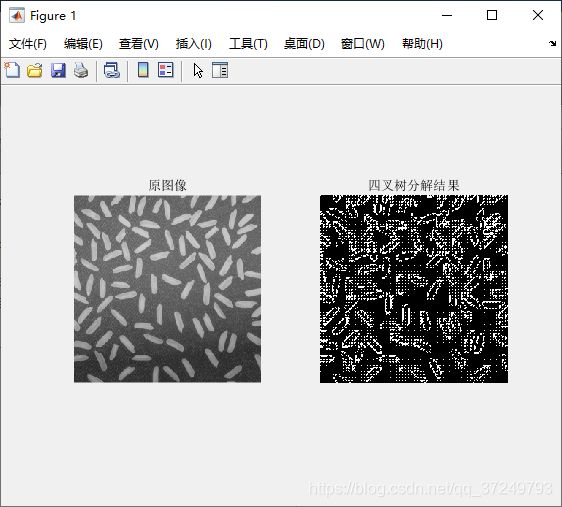
就是先把他们分成不想交的区域,然后再根据规则分割或合并。
Matlab实现
I1 = imread('rice.png');
%选取阈值为0.2,对原始图像进行四叉树分解
S = qtdecomp(I1,0.2);
%原始的稀疏矩阵转换为普通矩阵,使用full函数
S2 = full(S);
ct = zeros(6, 1); %记录子块数目的列向量
% 分别获得不同大小块的信息,子块内容保存在三维数组vals1~val6中,子块数目保存在ct向量中
for ii = 1:6
	 [vals{ii},r,c] = qtgetblk(I1,S2,2^(ii-1));
	ct(ii) = size(vals{ii},3);
end

subplot(1,2,1),imshow(I1),title('原图像');
subplot(1,2,2),imshow(S2),title('四叉树分解结果');
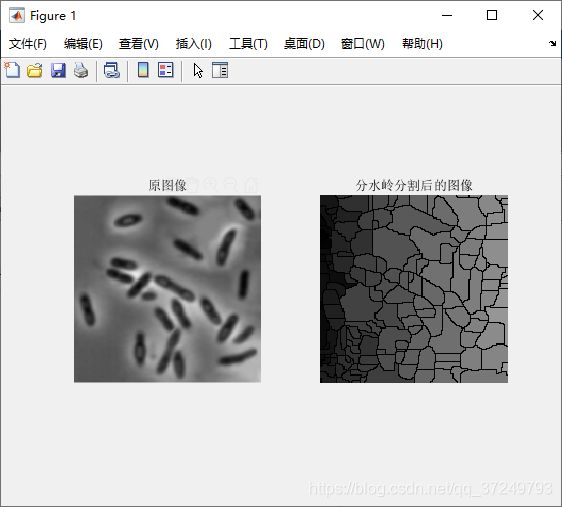
6 基于形态学分水岭算法的图像分割
这是一种模拟山地的方法,灰度值代表海拔,通过模拟浸水的方法,就会形成分水岭。
Matlab实现
I = imread('bacteria.bmp');
Iout = watershed(I);
subplot(1,2,1),imshow(I),title('原图像');
subplot(1,2,2),imshow(Iout),title('分水岭分割后的图像');
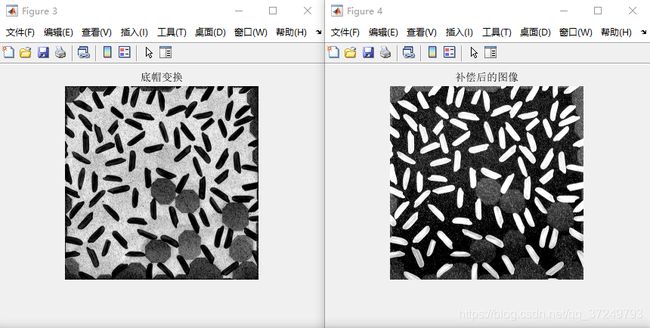
7 综合应用
Matlab实现
afm=imread('rice.png');

figure,imshow(afm),title('原始图像');

se = strel ('disk', 15) ;
Itop = imtophat (afm , se) ;
figure , imshow( Itop , [ ]) , title ( '顶帽变换');

Ibot = imbothat (afm , se) ;
figure , imshow( Ibot , [ ]) , title ('底帽变换');

Ienhance = imsubtract (imadd ( Itop , afm) , Ibot) ;
figure , imshow( Ienhance) , title ('补偿后的图像');

Iec = imcomplement ( Ienhance) ;
figure , imshow( Iec) , title ('完整增强后的图像');

Iemin = imextendedmin( Iec , 22) ;
figure , imshow( Iemin) , title ('最小化标记约束的图像');

Iimpose = imimposemin ( Iec , Iemin) ;
figure,imshow( Iimpose) , title ( '最小化标记约束的反相图像');

BW = watershed(Iimpose);
figure,imshow(BW),title('经过分水岭的最终图像');
