数据科学分布——泊松分布
泊松分布
- 概念
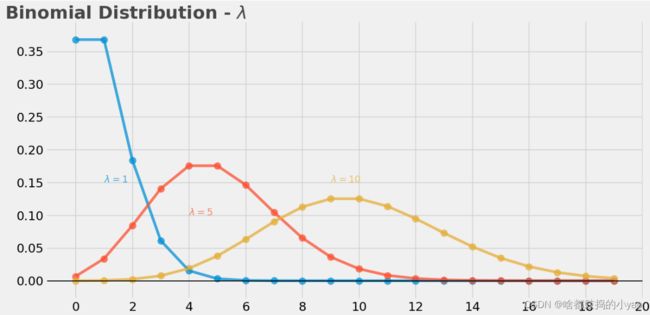
- λ的影响
- 产生随机值
- 概率质量函数
- 累积概率密度函数
- 绘制λ
概念
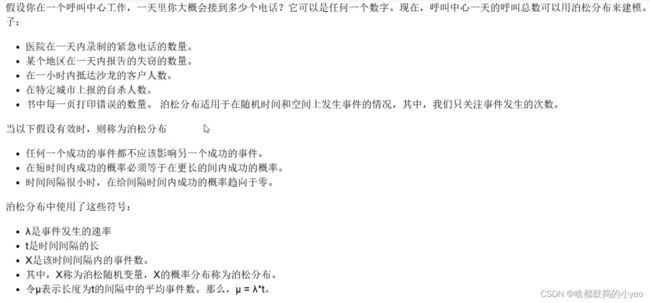
Poisson分布,是一种统计与概率学里常见到的离散概率分布。
现实生活多数服从泊松分布。
泊松分布的概率函数为:

泊松分布的参数λ是单位时间(或单位面积)内随机事件的平均发生次数。 泊松分布适合于描述单位时间内随机事件发生的次数。
泊松分布的期望和方差均为λ
特征函数为


# 加载功能包
import numpy as np
import scipy.stats as stats
import matplotlib.pyplot as plt
import matplotlib.style as style
from IPython.core.display import HTML

# 指定大小
%matplotlib inline
style.use('fivethirtyeight')
plt.rcParams['figure.figsize']=(14,7)
plt.figure(dpi=100)

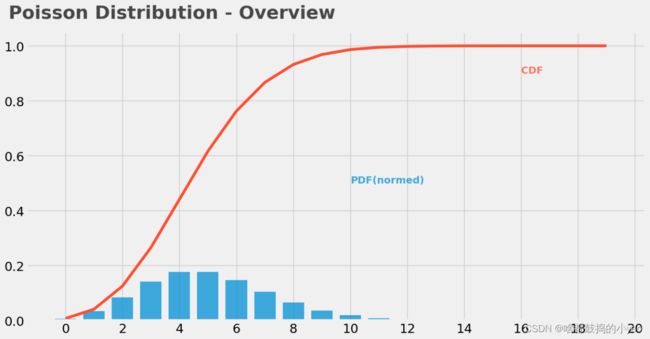
# PDF 概率密度函数
plt.bar(x=np.arange(20),height=(stats.poisson.pmf(np.arange(20),mu=5)),width=0.75,alpha=0.75)
# mu=λ*t

# CDF累计概率密度函数
plt.plot(np.arange(20),stats.poisson.cdf(np.arange(20),mu=5),color="#fc4f30")

# 补充图设置:LEGEND、TICKS与TITLE
plt.text(x=10, y=0.5, s="PDF(normed)", alpha = .75, weight="bold", color="#008fd5")
plt.text(x=16, y=0.9, s="CDF", alpha = .75, weight="bold", color="#fc4f30")
plt.xticks(range(21)[::2])
plt.tick_params(axis = 'both', which ='major', labelsize = 18)
plt.axhline(y = 0, color ='black', linewidth = 1.3, alpha = 7)
plt.text(x = -2, y = 1.1, s = "Poisson Distribution - Overview", fontsize = 26, weight = 'bold', alpha = 75)
λ的影响
plt.figure(dpi=100)

# PDF λ=1
plt.scatter(np.arange(20),(stats.poisson.pmf(np.arange(20),mu=1)),alpha=0.75,s=100)
plt.plot(np.arange(20),stats.poisson.pmf(np.arange(20),mu=1),alpha=0.75)

# PDF λ=5
plt.scatter(np.arange(20),(stats.poisson.pmf(np.arange(20),mu=5)),alpha=0.75,s=100)
plt.plot(np.arange(20),stats.poisson.pmf(np.arange(20),mu=5),alpha=0.75)

# PDF λ=10
plt.scatter(np.arange(20),(stats.poisson.pmf(np.arange(20),mu=10)),alpha=0.75,s=100)
plt.plot(np.arange(20),stats.poisson.pmf(np.arange(20),mu=10),alpha=0.75)

# LEGEND、TICKS与TITLE
plt.text(x=1, y=0.15, s="$\lambda = 1$", alpha = 75, weight="bold", color="#008fd5")
plt.text(x=4, y=0.1, s="$\lambda = 5$", alpha = 75, weight="bold", color="#fc4f30")
plt.text(x=9, y=0.15, s="$\lambda = 10$", alpha = 75, weight="bold", color="#e5ae38")
plt.xticks(range(21)[::2])
plt.tick_params(axis = 'both', which ='major', labelsize = 18)
plt.axhline(y = 0, color ='black', linewidth = 1.3, alpha = 7)
plt.text(x = -2.5, y =0.4, s = "Binomial Distribution - $\lambda$", fontsize = 26, weight = 'bold', alpha = 75)
产生随机值
import numpy as np
from scipy.stats import poisson

# draw a single sample
np.random.seed(42)
print(poisson.rvs(mu=10),end="\n\n")

# draw 10 samples
print(poisson.rvs(mu=10,size=10), end="\n\n")
12
[ 6 11 14 7 8 9 11 8 10 7]
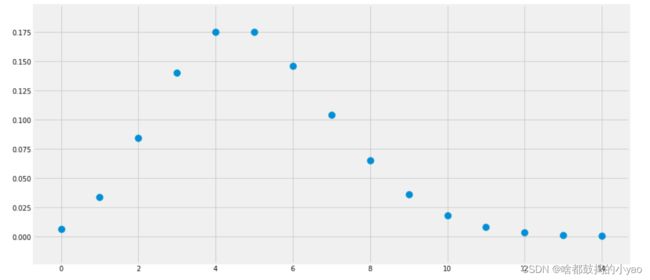
概率质量函数
from scipy.stats import poisson

# additional imoprts for plotting purpose
import numpy as np
import matplotlib.pyplot as plt
%matplotlib inline
plt.rcParams["figure.figsize"] = (14,7)

# continuous pdf for the plot
x_s = np.arange(15)
y_s = poisson.pmf(k=x_s, mu=5)
plt.scatter(x_s, y_s,s=100);
累积概率密度函数
from scipy.stats import poisson

# probabolity of x less or equal 3
print("P(X<3)={}".format(poisson.cdf(k=3,mu=5)))

# probability of x in [2 ,8]
print("P(2.format(poisson.cdf(k=8,mu=5)-poisson.cdf(k=2,mu=5)))
P(X<3)=0.2650259152973616
P(2绘制λ
from collections import Counter

plt.figure(dpi=100)

# declaring the "true" parameters underlying the sample
lambda_real = 7 #实际λ

# draw a sample of n=1000
np.random.seed(42)
sample = poisson.rvs(mu=lambda_real,size=1000) #柏松分布并找了1000个点

# estimate mu and sigma
lambda_est = np.mean(sample) #计算出的λ
print("Estimated LAMBDA: {}".format(lambda_est))

# sample distribution
cnt = Counter(sample)
_, values = zip(*sorted(cnt.items()))
plt.bar(range(len(values)),values/np.sum(values), alpha=.25) #基于算的结果画出柱形图

# true curve
plt.plot(range(18),poisson.pmf(k=range(18),mu=lambda_real),color="#fc4f30") #真实的正态分布曲线

# estimated curve
plt.plot(range(18),poisson.pmf(k=range(18),mu=lambda_est),color="#e5ae38") #建立出来的正太分布曲线

# legend
plt.text(x=6, y=0.06, s="sample", alpha = .75, weight="bold", color="#008fd5")
plt.text(x=3.5, y=0.12, s="true distrubtion", rotation=65, alpha = .75, weight="bold", color="#fc4f30")
plt.text(x=2, y=0.05, s="estimated distribution", rotation=65, alpha = .75, weight="bold", color="#e5ae38")

# ticks
plt.xticks(range(17)[::2])
plt.tick_params(axis='both',which='major',labelsize=18)
plt.axhline(y=0,color='black',linewidth=1.3,alpha=7)

# title
plt.text(x=0,y=0.17,s="Poisson Distribution - Parameter Estimation",fontsize=26,weight='bold',alpha=75)


