一 开发环境
集成开发工具:jupyter notebook 6.2.5
集成开发环境:python 3.10.6
第三方库:numpy、matplotlib.pyplot
二 题目
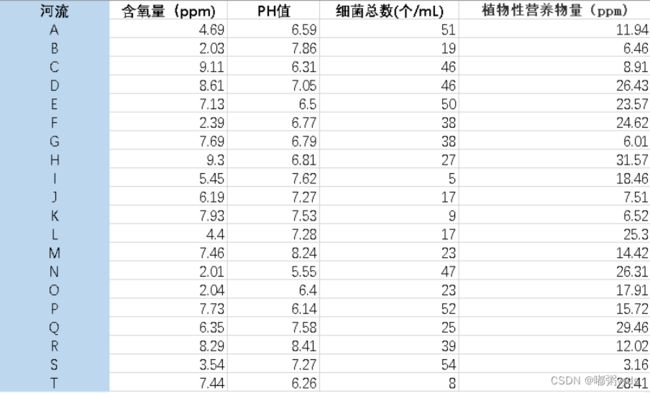
题目:评价下表中20条河流的水质情况。
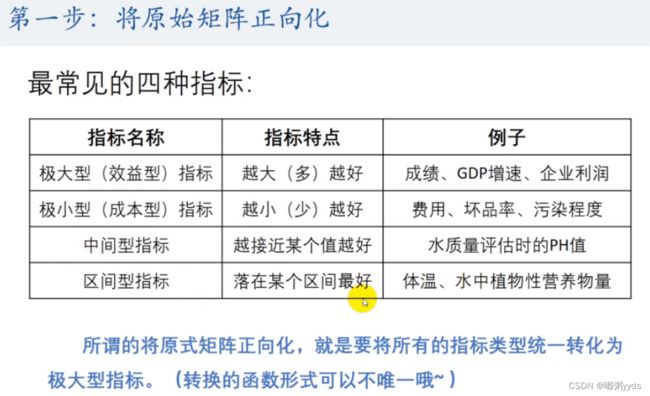
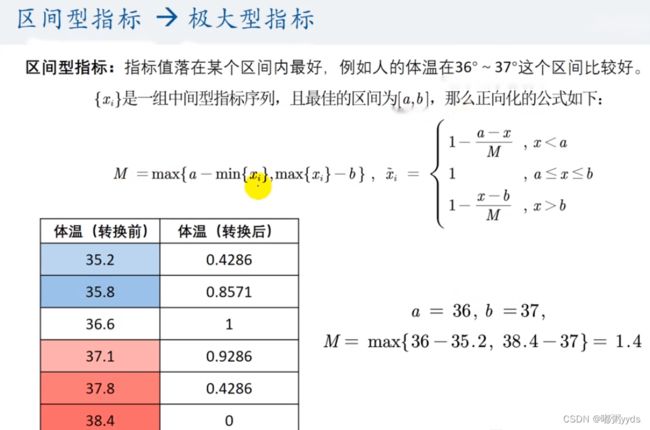
注:含氧量越高越好(极大型指标),PH值越接近7越好(中间型指标),细菌总数越少越好(极小型指标),植物性营养物量介于10~20之间最佳,超过20或低于10均不好(范围型指标)。
三 具体实现
3.1 获取数据
因为数据量不大,所以本文选择直接创建20x4的数据矩阵
# 含氧量  PH值  细菌总数  植物性营养物量
def get_matrix() -> np.array:
    return np.array([
        [4.69, 6.59, 51, 11.94],
        [2.03, 7.86, 19, 6.46],
        [9.11, 6.31, 46, 8.91],
        [8.61, 7.05, 46, 26.43],
        [7.13, 6.5, 50, 23.57],
        [2.39, 6.77, 38, 24.62],
        [7.69, 6.79, 38, 6.01],
        [9.3, 6.81, 27, 31.57],
        [5.45, 7.62, 5, 18.46],
        [6.19, 7.27, 17, 7.51],
        [7.93, 7.53, 9, 6.52],
        [4.4, 7.28, 17, 25.3],
        [7.46, 8.24, 23, 14.42],
        [2.01, 5.55, 47, 26.31],
        [2.04, 6.4, 23, 17.91],
        [7.73, 6.14, 52, 15.72],
        [6.35, 7.58, 25, 29.46],
        [8.29, 8.41, 39, 12.02],
        [3.54, 7.27, 54, 3.16],
        [7.44, 6.26, 8, 28.41]
    ])
3.2 数据展示
matrix = get_matrix()
print(f"数据矩阵为:\n{matrix}")

array([[ 4.69,  6.59, 51.  , 11.94],
       [ 2.03,  7.86, 19.  ,  6.46],
       [ 9.11,  6.31, 46.  ,  8.91],
       [ 8.61,  7.05, 46.  , 26.43],
       [ 7.13,  6.5 , 50.  , 23.57],
       [ 2.39,  6.77, 38.  , 24.62],
       [ 7.69,  6.79, 38.  ,  6.01],
       [ 9.3 ,  6.81, 27.  , 31.57],
       [ 5.45,  7.62,  5.  , 18.46],
       [ 6.19,  7.27, 17.  ,  7.51],
       [ 7.93,  7.53,  9.  ,  6.52],
       [ 4.4 ,  7.28, 17.  , 25.3 ],
       [ 7.46,  8.24, 23.  , 14.42],
       [ 2.01,  5.55, 47.  , 26.31],
       [ 2.04,  6.4 , 23.  , 17.91],
       [ 7.73,  6.14, 52.  , 15.72],
       [ 6.35,  7.58, 25.  , 29.46],
       [ 8.29,  8.41, 39.  , 12.02],
       [ 3.54,  7.27, 54.  ,  3.16],
       [ 7.44,  6.26,  8.  , 28.41]])
3.3 对矩阵进行正向化
# 定义position接收需要进行正向化处理的列
position = np.array([1, 2, 3])
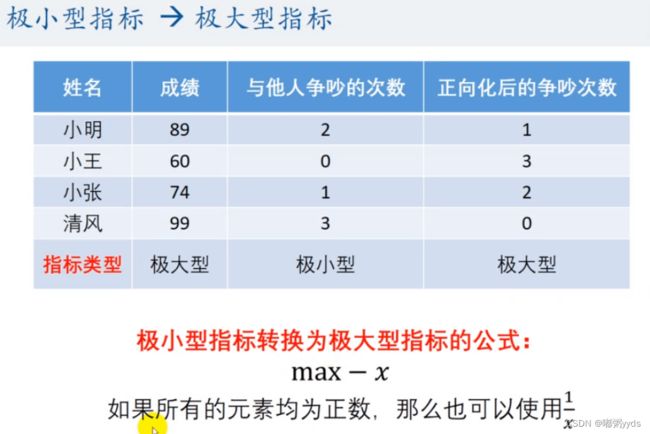
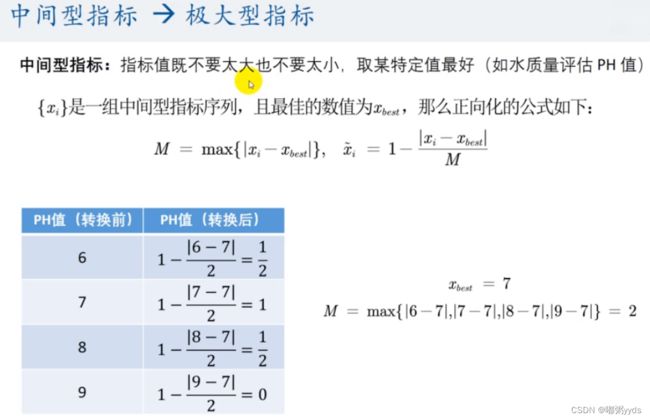
# 定义处理类型:1 - > 极小型  2 - > 中间型  3 - > 区间型
Type = np.array([2, 1, 3])
# 定义正向化函数
def positivization(x: np.array, pos: int, type: int) -> np.array:
    if type == 1:
        print(f"第{pos}列是极小型,正在正向化")
        x = x.max() - x
    elif type == 2:
        print(f"第{pos}列是中间型,正在正向化")
        best = 7  # 最佳值
        abs_max = np.max(np.abs(x - best))
        x = 1 - np.abs(x - best) / abs_max
    else:
        print(f"第{pos}列是区间型,正在正向化")
        left, right = 10, 20  # 区间的上界和下界
        max_tem = max(left - x.min(), x.max() - right)
        x = np.where(x < left, 1 - (left - x) / max_tem, x)
        x = np.where(x > right, 1 - (x - right) / max_tem, x)
        x = np.where(x > 1, 1, x)
    print(f"处理后的数据为:\n{x}")
    return x
for i in range(len(position)):
    print(f"当前处理的列为:\n{matrix[:, position[i]]}")
    matrix[:, position[i]] = positivization(matrix[:, position[i]], position[i], Type[i])
print(f"正向化后的矩阵为:\n{matrix}")

array([[ 4.69      ,  0.71724138,  3.        ,  1.        ],
       [ 2.03      ,  0.40689655, 35.        ,  0.6940363 ],
       [ 9.11      ,  0.52413793,  8.        ,  0.90579084],
       [ 8.61      ,  0.96551724,  8.        ,  0.44425238],
       [ 7.13      ,  0.65517241,  4.        ,  0.69144339],
       [ 2.39      ,  0.84137931, 16.        ,  0.60069144],
       [ 7.69      ,  0.85517241, 16.        ,  0.65514261],
       [ 9.3       ,  0.86896552, 27.        ,  0.        ],
       [ 5.45      ,  0.57241379, 49.        ,  1.        ],
       [ 6.19      ,  0.8137931 , 37.        ,  0.78478825],
       [ 7.93      ,  0.63448276, 45.        ,  0.69922213],
       [ 4.4       ,  0.80689655, 37.        ,  0.54191876],
       [ 7.46      ,  0.14482759, 31.        ,  1.        ],
       [ 2.01      ,  0.        ,  7.        ,  0.45462403],
       [ 2.04      ,  0.5862069 , 31.        ,  1.        ],
       [ 7.73      ,  0.40689655,  2.        ,  1.        ],
       [ 6.35      ,  0.6       , 29.        ,  0.18236819],
       [ 8.29      ,  0.02758621, 15.        ,  1.        ],
       [ 3.54      ,  0.8137931 ,  0.        ,  0.4088159 ],
       [ 7.44      ,  0.48965517, 46.        ,  0.27312014]])
3.4 对正向化后的数据进行标准化
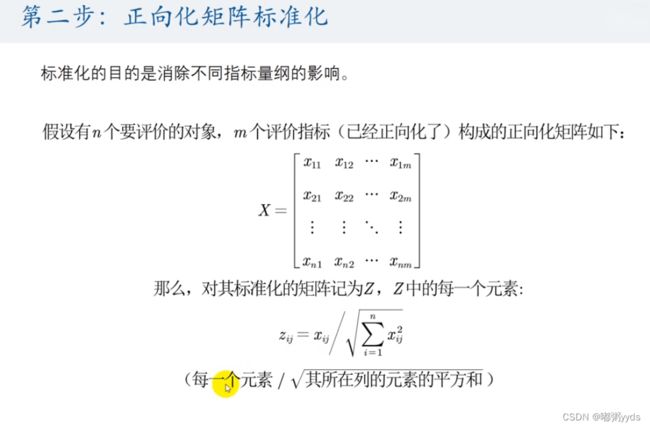
Z = matrix / np.sum(matrix * matrix, axis=0) ** 0.5
print(f"标准化后的矩阵为:\n{Z}")

array([[0.16218592, 0.24825528, 0.02454403, 0.30645756],
       [0.07019987, 0.14083713, 0.28634707, 0.21269267],
       [0.3150349 , 0.18141732, 0.06545076, 0.27758645],
       [0.29774429, 0.3341898 , 0.06545076, 0.1361445 ],
       [0.24656409, 0.22677165, 0.03272538, 0.21189806],
       [0.08264911, 0.29122254, 0.13090152, 0.18408644],
       [0.26592957, 0.29599668, 0.13090152, 0.20077341],
       [0.32160534, 0.30077082, 0.22089631, 0.        ],
       [0.18846764, 0.19812681, 0.4008859 , 0.30645756],
       [0.21405774, 0.28167426, 0.30270976, 0.24050429],
       [0.27422907, 0.21961044, 0.36816052, 0.21428191],
       [0.15215736, 0.27928719, 0.30270976, 0.1660751 ],
       [0.25797589, 0.05012847, 0.25362169, 0.30645756],
       [0.06950825, 0.        , 0.05726941, 0.13932297],
       [0.07054569, 0.20290095, 0.25362169, 0.30645756],
       [0.26731282, 0.14083713, 0.01636269, 0.30645756],
       [0.21959074, 0.20767509, 0.237259  , 0.05588811],
       [0.2866783 , 0.00954828, 0.12272017, 0.30645756],
       [0.12241751, 0.28167426, 0.        , 0.12528473],
       [0.25728427, 0.16948197, 0.37634187, 0.08369973]])
3.5 计算与最大值的距离和最小值的距离,并算出得分
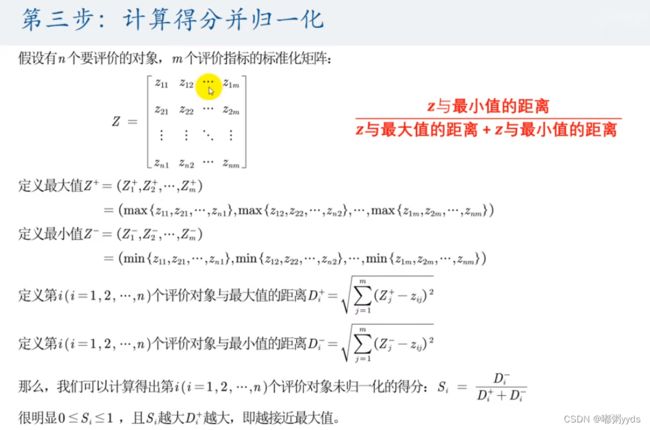
max_score = np.max(Z, axis=0)
min_score = np.min(Z, axis=0)
max_dist = np.sum((max_score - Z) * (max_score - Z), axis=1) ** 0.5
min_dist = np.sum((min_score - Z) * (min_score - Z), axis=1) ** 0.5

final_score = (min_dist / (max_dist + min_dist))
final_score /= np.sum(final_score)
final_score = np.around(final_score, decimals=3)  # 保留精度为3
四 将最后结果可视化
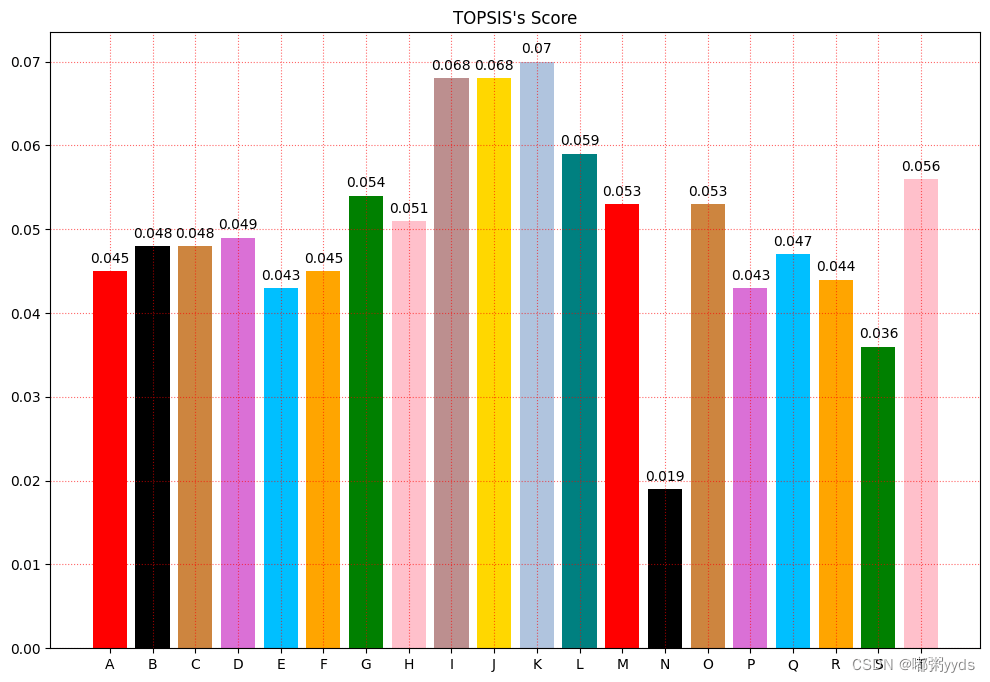
x = np.arange(20)  # 确定柱状图数量,可以认为是x方向刻度
color=['red','black','peru','orchid','deepskyblue', 'orange', 'green', 'pink', 'rosybrown', 'gold', 'lightsteelblue', 'teal']
x_label = [chr(i) for i in range(65,85)]
plt.figure(figsize=(12, 8))
plt.xticks(x, x_label)  # 绘制x刻度标签
plt.bar(x, final_score,color=color)  # 绘制y刻度标签
#设置网格刻度
plt.grid(True,linestyle=':',color='r',alpha=0.6)
plt.title("TOPSIS's Score")
for xx, yy in zip(x, final_score):
    plt.text(xx, yy + 0.001, str(yy), ha='center')
plt.show()
以上就是Python实现TOPSIS分析法的示例代码的详细内容,更多关于Python TOPSIS分析法的资料请关注脚本之家其它相关文章!
