数据分析之Matplotlib
文章目录
-
- 1. 认识数据可视化和Matplotlib安装
- 2. 类型目录
- 3. 图标名称title
- 4. 处理图形中的中文问题
- 5. 设置坐标轴名称,字体大小,线条粗细
- 6. 绘制多个线条和zorder叠加顺序
- 7. 设置x轴刻度xticks和y轴刻度yticks
- 8. 显示图表show
- 9. 设置图例legend
- 10. 显示线条数据值text
- 11.绘制网格 grid
- 12. 坐标轴的操作gca,移动,坐标区间
- 13. 对数坐标
- 14. 注解annotate和text
- 15. 坐标轴刻度显示位置和坐标轴刻度属性设置
- 16. 线条样式设置
- 17. 创建图形对象
- 18. 多子图
-
- 18.1 add_axes添加区域
- 18.2 subplot()函数
- 18.3 图形设置和标题重叠
- 18.4 subplots()函数
- 18.5 特殊例子
- 19. Bar柱状图
-
- 19.1 基本柱状图
- 19.2 同位置多柱状图
- 19.3 堆叠柱状图
- 19.4 水平柱状图
- 20. Hist直方图
-
- 20.1 基本直方图
- 20.2 折线直方图
- 20.3 不等距分组
- 20.4 多类型直方图
- 20.5 堆叠直方图
- 21. Pie饼状图
-
- 21.1 基本饼状图
- 21.2 饼状图分离
- 21.3 饼图阴影
- 21.4 设置饼图百分比和文本距离中心位置
- 22. Scatter散点图
- 23. Contours等高线图
- 24. 3D数据
- 25. 保存图片
- 26. 词云图
- 27. 箱线图
- 28. 次坐标轴
- 29. Animation动画
![]()
1. 认识数据可视化和Matplotlib安装
数据可视化就是将数据转换成图或表等,以一种更直观的方式展现和呈现数据。通过“可视化”的方式,我们看不懂的数据通过图形化的手段进行有效地表达,准确高效、简洁全面地传递某种信息,甚至帮助我们发现某种甚至帮助我们发现某种规律和特征,挖掘数据背后的价值。
Matplotlib 是 Python 的绘图库,它能让使用者很轻松地将数据图形化,并且提供多样化的输出格式。
Matplotlib 可以用来绘制各种静态,动态,交互式的图表。
Matplotlib 是一个非常强大的 Python 画图工具,我们可以使用该工具将很多数据通过图表的形式更直观的呈现出来。
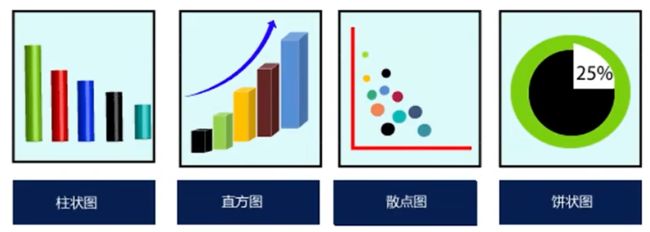
Matplotlib 可以绘制线图、散点图、等高线图、条形图、柱状图、3D 图形、甚至是图形动画等等。
2. 类型目录
- 绘图类型
| 函数名称 | 描述 |
|---|---|
| Bar | 绘制条形图 |
| Barh | 绘制水平条形图 |
| Boxplot | 绘制箱型图 |
| Hist | 绘制直方图 |
| his2d | 绘制2D直方图 |
| Pie | 绘制饼状图 |
| Plot | 在坐标轴上画线或者标记 |
| Polar | 绘制极坐标图 |
| Scatter | 绘制x与y的散点图 |
| Stackplot | 绘制堆叠图 |
| Stem | 用来绘制二维离散数据绘制(又称为“火柴图”) |
| Step | 绘制阶梯图 |
| Quiver | 绘制一个二维按箭头 |
- Image函数
| 函数名称 | 描述 |
|---|---|
| Imread | 从文件中读取图像的数据并形成数组 |
| Imsave | 将数组另存为图像文件 |
| Imshow | 在数轴区域内显示图像 |
- Axis函数
| 函数名称 | 描述 |
|---|---|
| Axes | 在画布(Figure)中添加轴 |
| Text | 向轴添加文本 |
| Title | 设置当前轴的标题 |
| Xlabel | 设置x轴标签 |
| Xlim | 获取或者设置x轴区间大小 |
| Xscale | 设置x轴缩放比例 |
| Xticks | 获取或设置x轴刻标和相应标签 |
| Ylabel | 设置y轴的标签 |
| Ylim | 获取或设置y轴的区间大小 |
| Yscale | 设置y轴的缩放比例 |
| Yticks | 获取或设置y轴的刻标和相应标签 |
- figure函数
| 函数名称 | 描述 |
|---|---|
| Figtext | 在画布上添加文本 |
| Figure | 创建一个新画布 |
| Show | 显示数字 |
| Savefig | 保存当前画布 |
| Close | 关闭画布窗口 |
3. 图标名称title
首先要导入matplotlib包中的pyplot模块,并以as别名的形式简化引入包的名称
from matplotlib import pyplot as plt
使用numpy提供的arange()创建一组数据,来绘制图像
import numpy as np
x = np.arange(-50,50)
x

'''
array([-50, -49, -48, -47, -46, -45, -44, -43, -42, -41, -40, -39, -38,
       -37, -36, -35, -34, -33, -32, -31, -30, -29, -28, -27, -26, -25,
       -24, -23, -22, -21, -20, -19, -18, -17, -16, -15, -14, -13, -12,
       -11, -10,  -9,  -8,  -7,  -6,  -5,  -4,  -3,  -2,  -1,   0,   1,
         2,   3,   4,   5,   6,   7,   8,   9,  10,  11,  12,  13,  14,
        15,  16,  17,  18,  19,  20,  21,  22,  23,  24,  25,  26,  27,
        28,  29,  30,  31,  32,  33,  34,  35,  36,  37,  38,  39,  40,
        41,  42,  43,  44,  45,  46,  47,  48,  49])
'''
上诉所得x的值作用到x轴上,而该值对应的平方值,也就是y值,使用以下方式获取
y = x**2
y
'''
array([2500, 2401, 2304, 2209, 2116, 2025, 1936, 1849, 1764, 1681, 1600,
       1521, 1444, 1369, 1296, 1225, 1156, 1089, 1024,  961,  900,  841,
        784,  729,  676,  625,  576,  529,  484,  441,  400,  361,  324,
        289,  256,  225,  196,  169,  144,  121,  100,   81,   64,   49,
         36,   25,   16,    9,    4,    1,    0,    1,    4,    9,   16,
         25,   36,   49,   64,   81,  100,  121,  144,  169,  196,  225,
        256,  289,  324,  361,  400,  441,  484,  529,  576,  625,  676,
        729,  784,  841,  900,  961, 1024, 1089, 1156, 1225, 1296, 1369,
       1444, 1521, 1600, 1681, 1764, 1849, 1936, 2025, 2116, 2209, 2304,
       2401])
'''
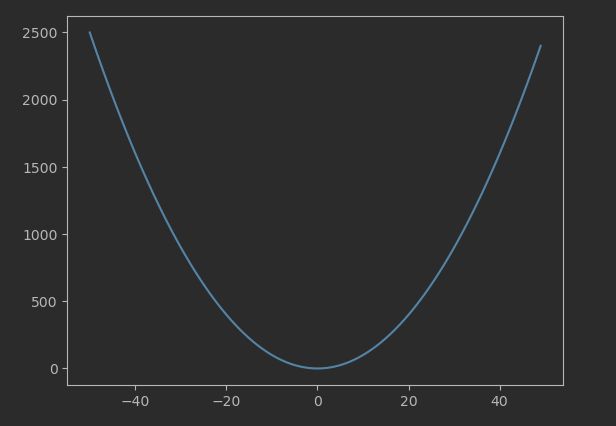
使用plt的plot()函数对x,y进行绘制
# plot()绘制线性图表
plt.plot(x,y)
设置图像的标题title
使用plt.title()进行设置
plt.title("y=x^2")
plt.plot(x,y)
![]()
标题与标签的定位
title() 方法提供了 loc 参数来设置标题显示的位置,可以设置为: ‘left’, ‘right’, 和 ‘center’, 默认值为 ‘center’。
xlabel() 方法提供了 loc 参数来设置 x 轴显示的位置,可以设置为: ‘left’, ‘right’, 和 ‘center’, 默认值为 ‘center’。
ylabel() 方法提供了 loc 参数来设置 y 轴显示的位置,可以设置为: ‘bottom’, ‘top’, 和 ‘center’, 默认值为 ‘center’。
plt.title("y=x^2",loc="left")
plt.plot(x,y)

4. 处理图形中的中文问题
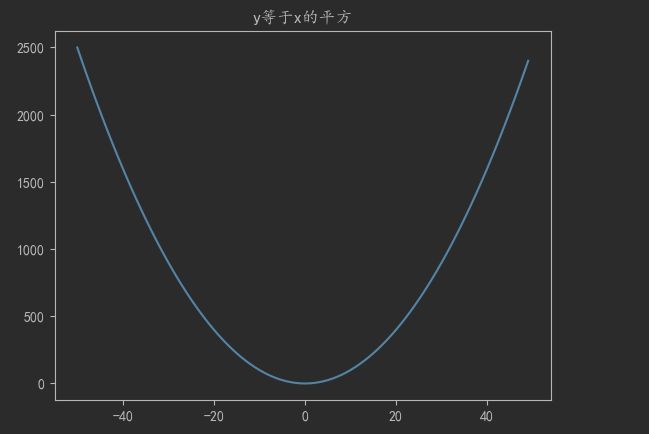
假如,我们想将图像的标题设置为y等于x的平方,如
plt.title("y等于x的平方")
plt.plot(x,y)

如上图所示,则会出现问题,中文无法正常显示。
解决办法:
修改字体配置
字体说明:
| 中文字体 | 说明 |
|---|---|
| SimHei | 中文黑体 |
| Kaiti | 中文楷体 |
| LiSu | 中文隶书 |
| FangSong | 中文仿宋 |
| YouYuan | 中文幼圆 |
| STSong | 华文宋体 |
| Microsoft YaHei | 微软雅黑 |
临时设置:
plt.rcParams['font.sans-serif'] = 'Kaiti'
plt.title("y等于x的平方")
plt.plot(x,y)

此时,中文问题解决了,但是负号出现了问题,负号无法正常显示。
由于更改了字体导致显示不出负号,将配署文件中axes.unicode minus : True修改为False 就可以了,当然这而可以在代码中完成。
plt.rcParams['font.sans-serif'] = 'Kaiti'  # 用来设置字体样式以正常显示中文字体
plt.rcParams['axes.unicode_minus'] = False # 解决保存图像是负号’-'显示为方块的问题
plt.title("y等于x的平方")
plt.plot(x,y)
所以,综上所述,解决中文问题,需要设置:
plt.rcParams['font.sans-serif'] = 'Kaiti'  # 用来设置字体样式以正常显示中文字体
plt.rcParams['axes.unicode_minus'] = False # 解决保存图像是负号’-'显示为方块的问题
Mac解决中文乱码问题
import matplotlib

# 解决中文乱码
matplotlib.rcParams['font.sans-serif'] =  ['Heiti TC']
matplotlib.rcParams['font.serif'] =  ['Heiti TC']
matplotlib.rcParams['axes.unicode_minus'] = False
5. 设置坐标轴名称,字体大小,线条粗细
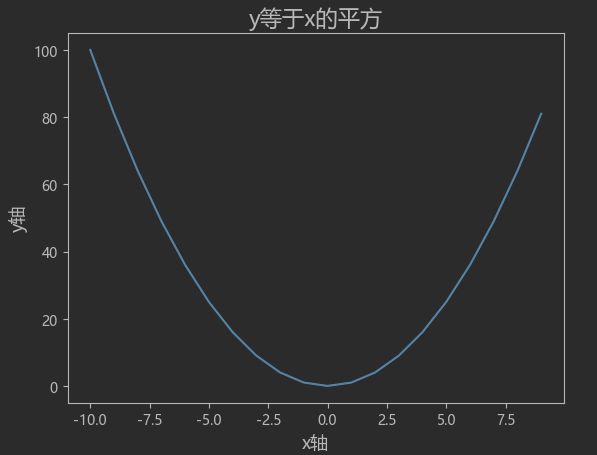
设置坐标轴的名称
通过xlabel()和ylabel()来设置x轴坐标轴名称和y坐标轴名称
x = np.arange(-10,10)
y = x ** 2
plt.rcParams['font.sans-serif'] = 'Microsoft YaHei'
plt.rcParams['axes.unicode_minus'] = False
plt.title("y等于x的平方")
plt.xlabel("x轴") # 设置坐标轴名称
plt.ylabel("y轴")  # 设置坐标轴名称
plt.plot(x,y)
设置坐标轴,标题字体大小
通过fontsize属性进行设置
x = np.arange(-10,10)
y = x ** 2
plt.rcParams['font.sans-serif'] = 'Microsoft YaHei'
plt.rcParams['axes.unicode_minus'] = False
plt.title("y等于x的平方",fontsize=16)  # 设置字体大小
plt.xlabel("x轴",fontsize=13)  # 设置字体大小
plt.ylabel("y轴",fontsize=13)  # 设置字体大小
plt.plot(x,y)
通过linewidth属性,进行设置图像线条的粗细,通过color属性,设置图像线条的颜色
x = np.arange(-10,10)
y = x ** 2
plt.rcParams['font.sans-serif'] = 'Microsoft YaHei'
plt.rcParams['axes.unicode_minus'] = False
plt.title("y等于x的平方",fontsize=16)
plt.xlabel("x轴",fontsize=13)
plt.ylabel("y轴",fontsize=13)
# 设置线条样式,粗细,颜色和标记字符
plt.plot(x,y,linestyle=':',linewidth=2,color='red',marker='v')
6. 绘制多个线条和zorder叠加顺序
x = np.arange(-10,10)
y = x ** 2
y2 = x ** 3
plt.rcParams['font.sans-serif'] = 'Microsoft YaHei'
plt.rcParams['axes.unicode_minus'] = False
plt.title("多个线条",fontsize=16)
plt.xlabel("x轴",fontsize=13)
plt.ylabel("y轴",fontsize=13)
# 绘制线条1
plt.plot(x,y,linestyle='-',linewidth=1,color='g',marker='o')
# 绘制线条2
plt.plot(x,y2,linestyle='-',linewidth=1,color='b',marker='o')
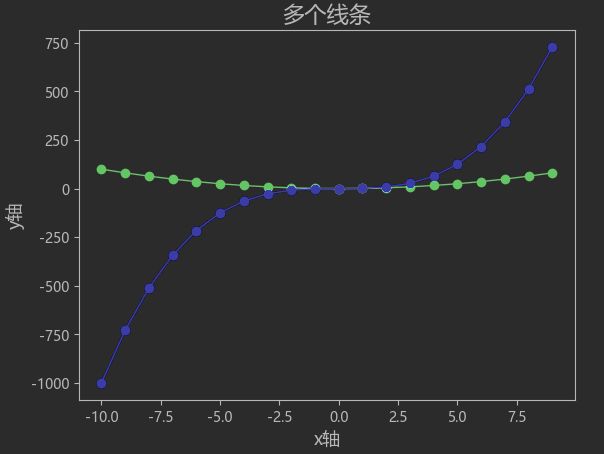
通过设置zorder属性来控制谁在上层
x = np.arange(-10,10)
y = x ** 2
y2 = x ** 3
plt.rcParams['font.sans-serif'] = 'Microsoft YaHei'
plt.rcParams['axes.unicode_minus'] = False
plt.title("多个线条",fontsize=16)
plt.xlabel("x轴",fontsize=13)
plt.ylabel("y轴",fontsize=13)
# 设置zorder属性
plt.plot(x,y,linestyle='-',linewidth=1,color='g',marker='o',zorder=2)
plt.plot(x,y2,linestyle='-',linewidth=1,color='b',marker='o',zorder=1)
7. 设置x轴刻度xticks和y轴刻度yticks
设置xticks
times = ['2015/6/26', '2015/8/1','2015/9/6','2015/10/12','2015/11/17','2015/12/23','2016/1/28','2016/3/4','2016/5/15','2016/6/20', '2016/7/26' , '2016/8/31', '2016/10/6' , '2016/11/11', '2016/12/17']

sales = np.random.randint(500,2000,size=len(times))
plt.plot(times,sales)
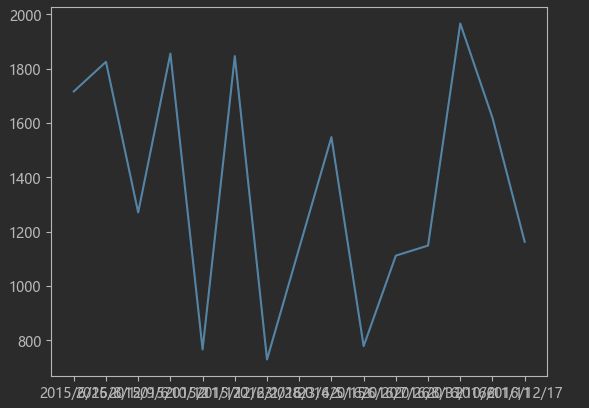
如图,上述数据进行折线图显示后,x轴数据会出现重叠问题
解决:
设置x轴和y轴的刻度
matplotlib.pyplot.xticks(ticks=None,labels=None,**kwargs)
- ticks:此参数是xtick位置的列表,是一个可选参数,如果将一个空列表作为参数传递,则它将删除所有xticks
- label:此参数包含放置在给定刻度线位置的标签。是一个可选参数,就是用给定的值替换掉原来的x轴标签。
- **kwargs:此参数是文本属性,用于控制标签的外观,
- rotation:旋转角度,如:rotation=45
- color:颜色,如:color=‘red’
times = ['2015/6/26', '2015/8/1','2015/9/6','2015/10/12','2015/11/17','2015/12/23','2016/1/28','2016/3/4','2016/5/15','2016/6/20', '2016/7/26' , '2016/8/31', '2016/10/6' , '2016/11/11', '2016/12/17']

sales = np.random.randint(500,2000,size=len(times))
# 设置x轴标签,每3个取一个,如取下标为0,3,6...   设置x轴的颜色,及旋转角度
plt.xticks(range(0,len(times),3),color='g',rotation=45)
plt.plot(times,sales)
可以通过设置label属性,来实现替换
times = ['2015/6/26', '2015/8/1','2015/9/6','2015/10/12','2015/11/17','2015/12/23','2016/1/28','2016/3/4','2016/5/15','2016/6/20', '2016/7/26' , '2016/8/31', '2016/10/6' , '2016/11/11', '2016/12/17']

sales = np.random.randint(500,2000,size=len(times))
# 通过设置labels属性,进行x轴标签的替换
labels = [1,2,3,4,5]
plt.xticks(range(0,len(times),3),color='g',rotation=45,labels=labels)
plt.plot(times,sales)
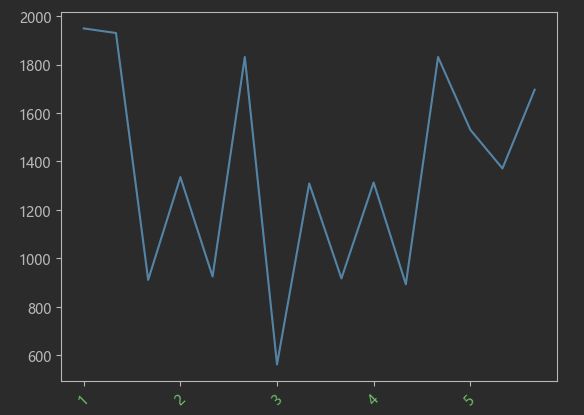
设置yticks
- yticks(ticks) 设置 y 轴刻度值,这些值是 y 轴上显示刻度线的位置。指定 ticks 为递增值向量;例如 [0 2 4 6]。此命令作用于当前坐标区。
- yt = yticks 以向量形式返回当前y轴刻度值。
- yticks(‘auto’) 设置自动模式,使坐标区确定y轴刻度值。如果更改了刻度值,然后又想将它们设置回默认值,则可以使用此选项。
- yticks(‘manual’) 设置手动模式,将y轴刻度值冻结在当前值。如果希望在调整坐标区大小或者向坐标区添加新数据时保留当前刻度值,则可以使用此选项。
- m = yticks(‘mode’) 返回当前 y 轴刻度值模式:‘auto’ 或 ‘manual’。默认情况下,模式为自动,除非您指定刻度值或将模式更改为手动。
plot(y) x值可以省略,默认[0,…,N-1]递增,N为y轴元素的个数
plt.plot(np.arange(10,50,4))

8. 显示图表show
显示所有打开的图形。
jupyter notebooks会自动显示图形,在pycharm中就不会自动显示,需要调用show()函数
如,在python的交互模式下,只有调用了show()函数,图像才会显示出来
[外链图片转存失败,源站可能有防盗链机制,建议将图片保存下来直接上传(img-qZt3s9o1-1689743080856)(https://raw.githubusercontent.com/mango1698/picgo/master/blog/202307191257984.png)]
# 如果在jupyter中也想出现图形操作菜单,可以使用matplotlib的魔术方法,在此时必须调用show()才能显示
%matplotlib notebook

times = ['2015/6/26', '2015/8/1','2015/9/6','2015/10/12','2015/11/17','2015/12/23','2016/1/28','2016/3/4','2016/5/15','2016/6/20', '2016/7/26' , '2016/8/31', '2016/10/6' , '2016/11/11', '2016/12/17']

sales = np.random.randint(500,2000,size=len(times))
# 通过设置labels进行替换
labels = [1,2,3,4,5]
plt.xticks(range(0,len(times),3),color='g',rotation=45,labels=labels)
plt.plot(times,sales)
plt.show()
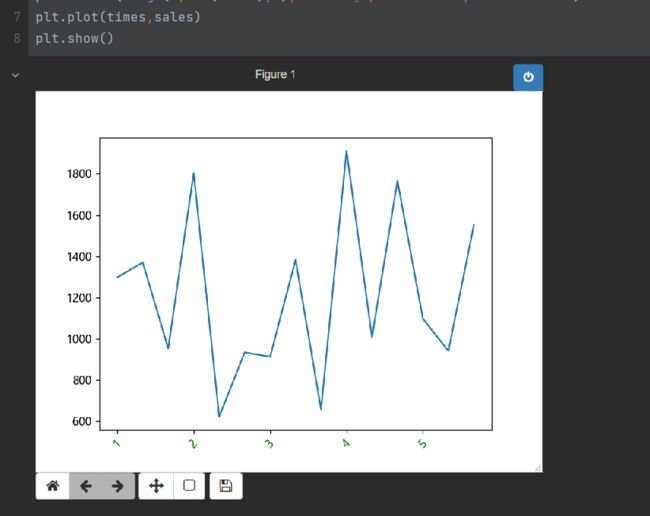
# 如果想回到原先的显示方式(默认模式),则使用:
  %matplotlib inline
9. 设置图例legend
图例是集中于地图一角或–侧的地图上各种符号和颜色所代表内容与指标的说明,有助于更好的认识地图。
在使用图例前,要为每个图形设置label参数
times = ['2015/6/26', '2015/8/1','2015/9/6','2015/10/12','2015/11/17','2015/12/23','2016/1/28','2016/3/4','2016/5/15','2016/6/20', '2016/7/26' , '2016/8/31', '2016/10/6' , '2016/11/11', '2016/12/17']
my_in = np.random.randint(500,2000,size=len(times))
my_out = np.random.randint(200,800,size=len(times))

plt.xticks(range(0,len(times),2),rotation=45)


# 在使用图例前,要为每个图形设置label参数
plt.plot(times,my_in,label="收入",color="g")
plt.plot(times,my_out,label="输入",color='y')
# 默认会使用每个图形的label值作为图例中的说明
plt.legend()

plt.show()

此外,可以通过设置loc属性来设置图例的位置,默认情况下会自动找一个合适的位置:
times = ['2015/6/26', '2015/8/1','2015/9/6','2015/10/12','2015/11/17','2015/12/23','2016/1/28','2016/3/4','2016/5/15','2016/6/20', '2016/7/26' , '2016/8/31', '2016/10/6' , '2016/11/11', '2016/12/17']
my_in = np.random.randint(500,2000,size=len(times))
my_out = np.random.randint(200,800,size=len(times))

plt.xticks(range(0,len(times),2),rotation=45)

plt.plot(times,my_in,label="收入",color="g")
plt.plot(times,my_out,label="输入",color='y')

plt.legend(loc="upper right")  # 通过loc属性设置图例的位置

plt.show()

loc可选值:
| 位置字符串 | 位置值 | 备注 |
|---|---|---|
| best | 0 | 自动寻找最佳位置(默认) |
| upper right | 1 | 右上角 |
| upper left | 2 | 左上角 |
| lower left | 3 | 左下角 |
| lower right | 4 | 右下角 |
| right | 5 | 右边中间 |
| center left | 6 | 左边中间 |
| center right | 7 | 右边中间 |
| lower center | 8 | 中间最下面 |
| upper center | 9 | 中间最上面 |
| center | 10 | 正中心 |
bbox_to_anchor 参数用来更好的控制以及调整图例框的位置
bbox_to_anchor = (x,y,width,height)
x,y表示图例框的某个点的坐标位置,而至于那个点是哪里,取决于plt.legend()中的参数loc决定,例如:loc = 'center’则x,y表示图例框中心点的位置;
width表示将由x,y表示的原图例框的初始位置水平移动多少距离(距离原图例框的宽度)
height表示将由x,y表示的原图例框的初始位置竖直移动多少距离(距离原图例框的高度)
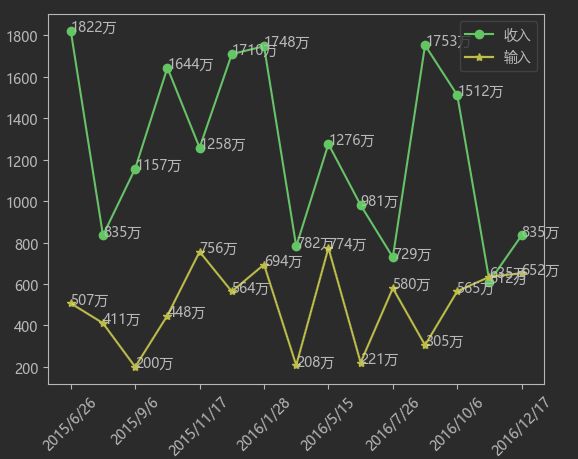
10. 显示线条数据值text
plt.text(x,y,string,fontsize=15,verticalalignment="top",horizontalalignment="right")
- x,y:表示坐标值上的值
- string:表示说明文字
- fontsize:表示字体大小
- verticalalignment::(va)垂直对齐方式,参数: [ ‘center’ | ‘top’ | ‘bottom’ | ‘baseline’]
- horizontalalignment: (ha)水平对齐方式,参数: [ ‘center’ | ‘right’ | ‘left’ ]
- rotation表示标签的旋转角度,以逆时针计算,取整
- 后面还有 family 用来设置字体,style 设置字体的风格,weight 字体的粗细, bbox 给字体添加框,如 bbox=dict(facecolor=‘red’, alpha=0.5) 等,各种风格,应有尽有,总有一款适合你。
times = ['2015/6/26', '2015/8/1','2015/9/6','2015/10/12','2015/11/17','2015/12/23','2016/1/28','2016/3/4','2016/5/15','2016/6/20', '2016/7/26' , '2016/8/31', '2016/10/6' , '2016/11/11', '2016/12/17']
my_in = np.random.randint(500,2000,size=len(times))
my_out = np.random.randint(200,800,size=len(times))
plt.xticks(range(0,len(times),2),rotation=45)
plt.plot(times,my_in,label="收入",color="g",marker="o")
plt.plot(times,my_out,label="输入",color='y',marker="*")

# 设置每个点对应的文本信息  (x,y,y) -> x:x坐标 y: y坐标   y: 显示的值
for x,y in zip(times,my_in):
    plt.text(x,y,"%s万"%y)

for x,y in zip(times,my_out):
    plt.text(x,y,"%s万"%y)


plt.legend()
plt.show()
11.绘制网格 grid
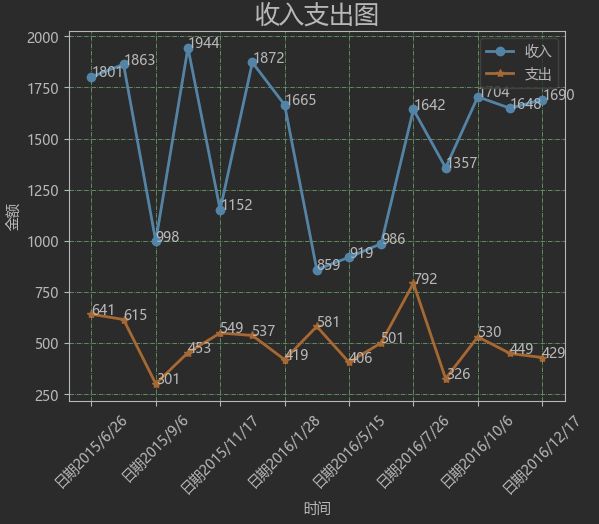
我们可以使用 pyplot 中的 grid() 方法来设置图表中的网格线。
grid() 方法语法格式如下:
matplotlib.pyplot.grid(b=None, which='major', axis='both', )
参数说明:
- b:可选,默认为 None,可以设置布尔值,true 为显示网格线,false 为不显示,如果设置 **kwargs 参数,则值为 true。
- which:可选,可选值有 ‘major’、‘minor’ 和 ‘both’,默认为 ‘major’,表示应用更改的网格线。
- axis:可选,设置显示哪个方向的网格线,可以是取 ‘both’(默认),‘x’ 或 ‘y’,分别表示两个方向,x 轴方向或 y 轴方向。
- **kwargs:可选,设置网格样式,可以是 color=‘r’, linestyle=‘-’ 和 linewidth=2,分别表示网格线的颜色,样式和宽度
- color:‘b’ 蓝色,‘m’ 洋红色,‘g’ 绿色,‘y’ 黄色,‘r’ 红色,‘k’ 黑色,‘w’ 白色,‘c’ 青绿色,‘#008000’ RGB 颜色符串
- linestyle:‘‐’ 实线,‘‐‐’ 破折线,‘‐.’ 点划线,‘:’ 虚线
- linewidth:设置线的宽度,可以设置一个数字
times = ['2015/6/26', '2015/8/1','2015/9/6','2015/10/12','2015/11/17','2015/12/23','2016/1/28','2016/3/4','2016/5/15','2016/6/20', '2016/7/26' , '2016/8/31', '2016/10/6' , '2016/11/11', '2016/12/17']
my_in = np.random.randint(500,2000,size=len(times))
my_out = np.random.randint(300,800,size=len(times))
plt.title('收入支出图',fontsize=18)
plt.xlabel('时间')
plt.ylabel('金额')
plt.xticks(range(0,len(times),2),rotation=45,labels=['日期%s'%times[i] for i in range(0,len(times),2)])
plt.plot(times,my_in,label='收入',marker="o",linewidth=2)
plt.plot(times,my_out,label='支出',marker='*',linewidth=2)

for x,y in zip(times,my_in):
    plt.text(x,y,y)
for x,y in zip(times,my_out):
    plt.text(x,y,y)

plt.grid(True,color='g',linestyle='-.',linewidth=0.5)  # 显示网格,并设置网格颜色,样式,宽度
plt.legend()
plt.show()
12. 坐标轴的操作gca,移动,坐标区间
使用plt.gca()对坐标轴进行操作
gca就是get current axes(获取当前区域对象)的意思,我们用来移动坐标轴的位置
首先观察画布上面的坐标轴,如图
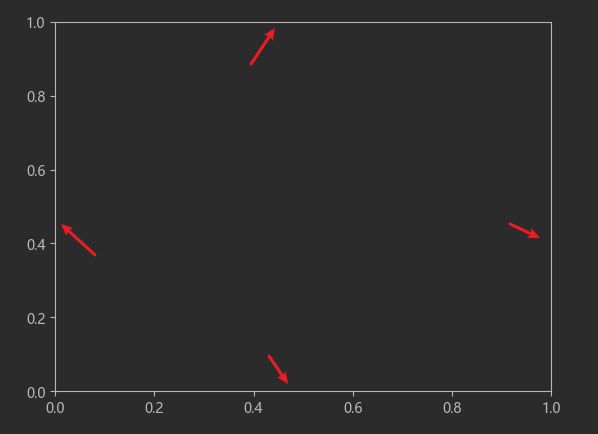
上图中,用红色标识出的白色边界框线在Matplotlib中被称为spines,中文翻译为脊柱…在我理解看来,意思是这些边界框线是坐标轴区域的“支柱"。
那么,我们最终要挪动的其实就是这四个“支柱”
通过坐标轴spines,确定top,bottom,left,right
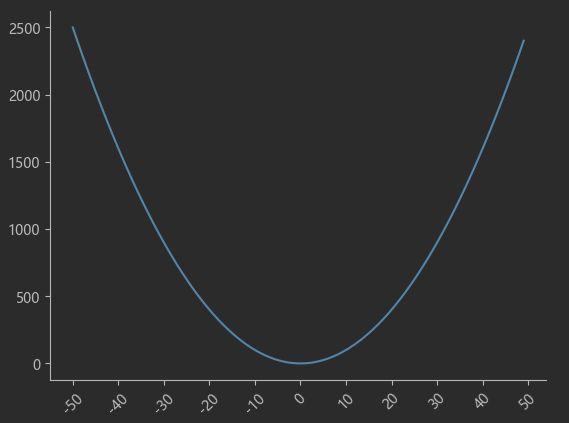
**隐藏坐标轴 **
设置颜色为none,即会隐藏掉
x = np.arange(-50,50)
y = x ** 2
plt.xticks(range(-50,len(x),10),rotation=45)

# 获取当前区域对象
ax = plt.gca()
# 通过坐标轴spines,确定top,bottom,left,right

# 不需要右侧和上侧的坐标轴,则可以设置颜色为none,即会隐藏掉
ax.spines['right'].set_color("none")
ax.spines['top'].set_color("none")

plt.plot(x,y)
position位置参数有三种,data,outward(向外),axes
data:移动到指定值的位置 axes:按照比率进行移动
data:移动到指定值位置
x = np.arange(-50,50)
y = x ** 2
plt.xticks(range(-50,len(x),10),rotation=45)

ax = plt.gca()
ax.spines['right'].set_color("none")
ax.spines['top'].set_color("none")

# 移动左轴到指定位置
ax.spines['bottom'].set_position(('data',500))

plt.plot(x,y)

axes:按照比率进行移动
axes:0.0-1.0之间的值,整个轴上的比例
x = np.arange(-50,50)
y = x ** 2
plt.xticks(range(-50,len(x),10),rotation=45)

ax = plt.gca()
ax.spines['right'].set_color("none")
ax.spines['top'].set_color("none")

# 移动左轴到指定位置
ax.spines['bottom'].set_position(('axes',0.5))

plt.plot(x,y)

将坐标轴移动到图像中间
x = np.arange(-50,50)
y = x ** 2
plt.xticks(range(-50,len(x),10),rotation=45)

# 获取当前坐标轴
ax = plt.gca()

# 不需要右侧和上侧的坐标轴,则科研设置颜色为none,即会隐藏掉
ax.spines['right'].set_color("none")
ax.spines['top'].set_color("none")

# 移动下轴到指定位置
ax.spines['left'].set_position(('data',0.0))
# 移动左轴到指定位置
ax.spines['bottom'].set_position(('data',0.0))

plt.plot(x,y)
通过ylimt设置坐标区间
x = np.arange(-50,50)
y = x ** 2
plt.xticks(range(-80,len(x),10),rotation=45)

ax = plt.gca()

ax.spines['right'].set_color("none")
ax.spines['top'].set_color("none")

ax.spines['left'].set_position(('data',0.0))
ax.spines['bottom'].set_position(('data',0.0))

# 设置y轴的坐标区间
plt.ylim(-1000,3000)
# 设置x轴的坐标区间
plt.xlim(-80,100)

plt.plot(x,y)
13. 对数坐标
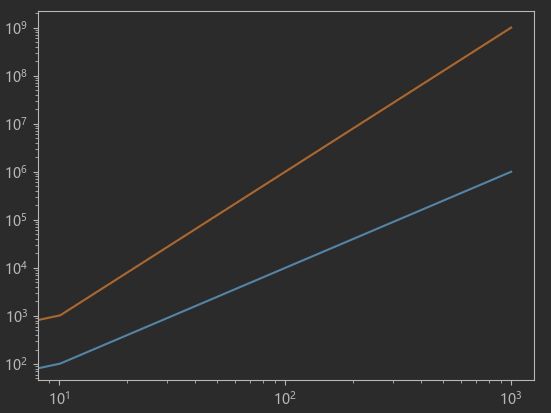
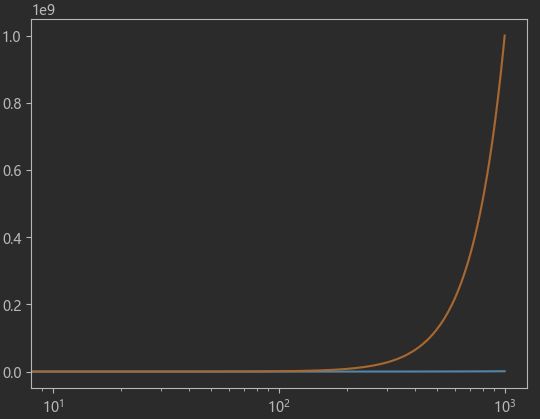
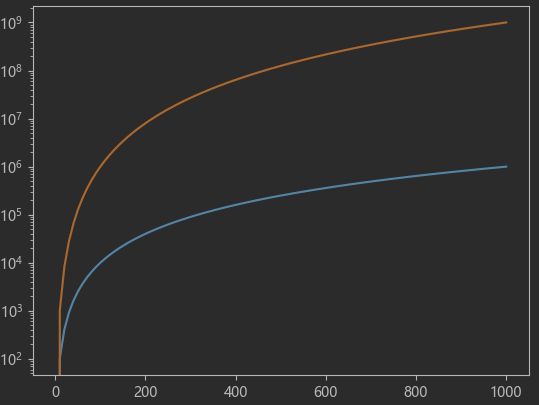
对跨越多个数量级的数据进行可视化时,需要使用对数坐标。
在matplotlib中,loglog、semilogx和semilogy分别对应x轴和y轴同时、只有x轴、只有y轴使用对数坐标。
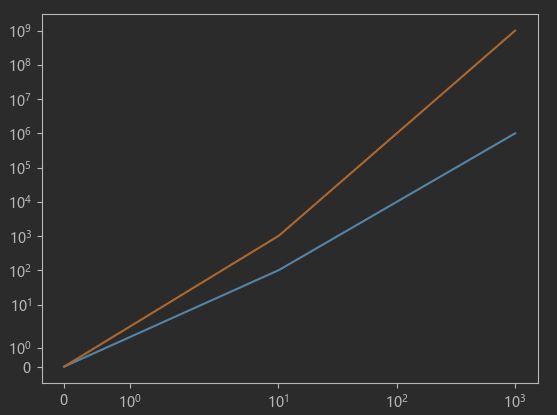
另外一种方法是使用set_xscale和set_yscale方法,将log作为第一个参数,将数轴分布设置为对数坐标。
通过loglog进行设置
x = np.linspace(0,1e3,100)
y1 = x**2
y2 = x**3

# 设置对数坐标
plt.loglog(x,y1)
plt.loglog(x,y2)
通过semilogx进行设置
x = np.linspace(0,1e3,100)
y1 = x**2
y2 = x**3

# 设置对数坐标
plt.semilogx(x,y1)
plt.semilogx(x,y2)
通过semilogy进行设置
x = np.linspace(0,1e3,100)
y1 = x**2
y2 = x**3

# 设置对数坐标
plt.semilogy(x,y1)
plt.semilogy(x,y2)
通过set_xscale和set_yscale进行设置
可选值:linear,log, symlog, logit
x = np.linspace(0,1e3,100)
y1 = x**2
y2 = x**3

# 通过set_xscale和set_yscale进行设置
ax = plt.gca()
ax.set_xscale('symlog')  # 可选关键词{"linear", "log", "symlog", "logit"}
ax.set_yscale('symlog')
plt.plot(x,y1)
plt.plot(x,y2)
14. 注解annotate和text
文本标签、标题和注释是大部分图形的重要组成部分,对它们的格式进行完全控制是生成出版品质图形的基本要求。
annotate用于在图形上给数据添加文本注解,而且支持带箭头的划线工具,方便我们在合适的位置添加描述信息。
axes.annotate(s, xy, *args, **kwargs)
- **s:**注释文本的内容
- **xy:**被注释的坐标点,二维元组形如(x,y)
- **xytext:**注释文本的坐标点,也是二维元组,默认与xy相同
- **xycoords:**被注释点的坐标系属性,允许输入的值如下
| 属性值 | 含义 |
|---|---|
| ‘figure points’ | 以绘图区左下角为参考,单位是点数 |
| ‘figure pixels’ | 以绘图区左下角为参考,单位是像素数 |
| ‘figure fraction’ | 以绘图区左下角为参考,单位是百分比 |
| ‘axes points’ | 以子绘图区左下角为参考,单位是点数(一个figure可以有多个axex,默认为1个) |
| ‘axes pixels’ | 以子绘图区左下角为参考,单位是像素数 |
| ‘axes fraction’ | 以子绘图区左下角为参考,单位是百分比 |
| ‘data’ | 以被注释的坐标点xy为参考 (默认值) |
| ‘polar’ | 不使用本地数据坐标系,使用极坐标系 |
- textcoords :注释文本的坐标系属性,默认与xycoords属性值相同,也可设为不同的值。除了允许输入xycoords的属性值,还允许输入以下两种:
| 属性值 | 含义 |
|---|---|
| ‘offset points’ | 相对于被注释点xy的偏移量(单位是点) |
| ‘offset pixels’ | 相对于被注释点xy的偏移量(单位是像素) |
- **arrowprops:**箭头的样式,dict(字典)型数据,如果该属性非空,则会在注释文本和被注释点之间画一个箭头。如果不设置
'arrowstyle'关键字,则允许包含以下关键字:
| 关键字 | 说明 |
|---|---|
| width | 箭头的宽度 |
| frac | 箭头长度的比例 |
| headwidth | 箭头头部的宽度 |
| shrink | 标注位置到文字的比例 |
| ? | 任何 matplotlib.patches.FancyArrowPatch中的关键字 |
如果设置了‘arrowstyle’关键字,以上关键字就不能使用。允许的值有:
| 箭头的样式 | 属性 |
|---|---|
'-' |
None |
'->' |
head_length=0.4,head_width=0.2 |
'-[' |
widthB=1.0,lengthB=0.2,angleB=None |
| `’ | - |
| `'- | >'` |
'<-' |
head_length=0.4,head_width=0.2 |
'<->' |
head_length=0.4,head_width=0.2 |
| `'< | -'` |
| `'< | - |
'fancy' |
head_length=0.4,head_width=0.4,tail_width=0.4 |
'simple' |
head_length=0.5,head_width=0.5,tail_width=0.2 |
'wedge' |
tail_width=0.3,shrink_factor=0.5 |
FancyArrowPatch的关键字包括:
| Key | Description |
|---|---|
| arrowstyle | 箭头的样式 |
| connectionstyle | 连接线的样式 |
| relpos | 箭头起始点相对注释文本的位置,默认为 (0.5, 0.5),即文本的中心,(0,0)表示左下角,(1,1)表示右上角 |
| patchA | 箭头起点处的图形(matplotlib.patches对象),默认是注释文字框 |
| patchB | 箭头终点处的图形(matplotlib.patches对象),默认为空 |
| shrinkA | 箭头起点的缩进点数,默认为2 |
| shrinkB | 箭头终点的缩进点数,默认为2 |
| mutation_scale | default is text size (in points) |
| mutation_aspect | default is 1. |
| ? | any key for matplotlib.patches.PathPatch |
connectionstyle是属性值有:
| 名称 | 属性 |
|---|---|
| angle | angleA=90,angleB=0,rad=0.0 |
| angle3 | angleA=90,angleB=0 |
| arc | angleA=0,angleB=0,armA=None,armB=None,rad=0.0 |
| arc3 | rad=0.0 |
| bar | armA=0.0,armB=0.0,fraction=0.3,angle=None |
- annotation_clip : 布尔值,可选参数,默认为空。设为True时,只有被注释点在子图区内时才绘制注释;设为False时,无论被注释点在哪里都绘制注释。仅当xycoords为‘data’时,默认值空相当于True。
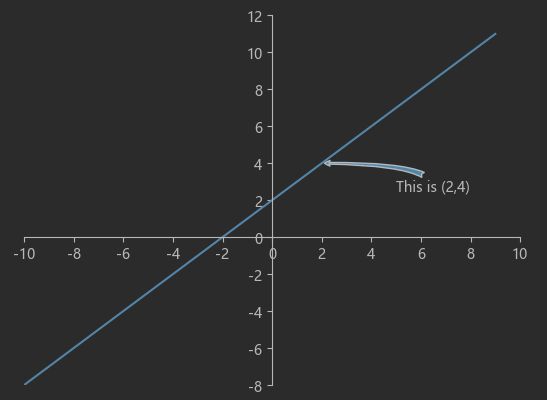
x = np.arange(-10,10)
y = x+2

plt.xticks(range(-10,11,2))
plt.yticks(range(-8,13,2))
plt.xlim(-10,10)
plt.ylim(-8,12)

ax = plt.gca()
ax.spines['right'].set_color('none')
ax.spines['top'].set_color('none')
ax.spines['left'].set_position(('data',0.0))
ax.spines['bottom'].set_position(('data',0.0))

# 设置注解
plt.annotate('This is (2,4)',(2,4),xytext=(5,2.5),xycoords='data',textcoords='data',arrowprops={'arrowstyle':'fancy','connectionstyle':'angle3'})

plt.plot(x,y)
具体标注某一个点,我们结合之前学习的知识
x = np.arange(-10,10)
y = x+2

plt.xticks(range(-10,11,2))
plt.yticks(range(-8,13,2))
plt.xlim(-10,10)
plt.ylim(-8,12)

ax = plt.gca()
ax.spines['right'].set_color('none')
ax.spines['top'].set_color('none')
ax.spines['left'].set_position(('data',0.0))
ax.spines['bottom'].set_position(('data',0.0))

x0 = 2
y0 = 4

# 标注具体点
plt.scatter(x0,y0,color='g',s=50)

# 点到x轴的连线
plt.plot([x0,x0],[0,y0],linestyle='--',color='r')
# 点到y轴的连线
plt.plot([0,x0],[y0,y0],linestyle='--',color='r')

# 设置注解
plt.annotate('This is (2,4)',(x0,y0),xytext=(5,2.5),xycoords='data',textcoords='data',arrowprops={'arrowstyle':'->','connectionstyle':'arc3,rad=.2'})

plt.plot(x,y)

此外,我们可以使用plt.text()进行标注
plt.text(x, y, s, fontsize, verticalalignment,horizontalalignment,rotation , **kwargs)
- x,y表示标签添加的位置,默认是根据坐标轴的数据来度量的,是绝对值,也就是说图中点所在位置的对应的值,特别的,如果你要变换坐标系的话,要用到transform=ax.transAxes参数。
- s表示标签的符号,字符串格式,比如你想加个"我爱三行科创",更多的是你标注跟数据有关的主体,你如实写便是。
- fontsize顾名思义就是你加标签字体大小了,取整数。
- verticalalignment表示垂直对齐方式,可选 ‘center’,‘top’,‘bottom’,‘baseline’等. horizontalalignment表示水平对齐方式,可以填’center’, ‘right’', 'left’等
- rotation表示标签的旋转角度,以逆时针计算,取整
- 后面还有family用来设置字体,style 设置字体的风格, weight字体的粗细, bbox给字体添加框,如 bbox=dict(facecolor=‘red’,alpha=0.5)等,各种风格,应有尽有,总有一款适合你。
x = np.arange(-10,10)
y = x+2

plt.xticks(range(-10,11,2))
plt.yticks(range(-8,13,2))
plt.xlim(-10,10)
plt.ylim(-8,12)

ax = plt.gca()
ax.spines['right'].set_color('none')
ax.spines['top'].set_color('none')
ax.spines['left'].set_position(('data',0.0))
ax.spines['bottom'].set_position(('data',0.0))

x0 = 2
y0 = 4

plt.scatter(x0,y0,color='g',s=50)

plt.plot([x0,x0],[0,y0],linestyle='--',color='r')
plt.plot([0,x0],[y0,y0],linestyle='--',color='r')

plt.annotate('This is (2,4)',(x0,y0),xytext=(5,2.5),xycoords='data',textcoords='data',arrowprops={'arrowstyle':'->','connectionstyle':'arc3,rad=.2'})

# 设置文本注解
plt.text(-9,4,'This is the some text.',fontdict={'size':14,'color':'r'})

plt.plot(x,y)
15. 坐标轴刻度显示位置和坐标轴刻度属性设置

如上图,有时图像会出现遮挡问题。
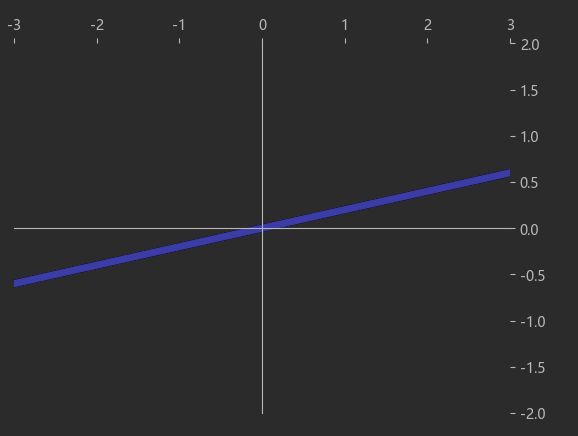
我们可以使用ax.xaxis.set_ticks_position和ax.yaxis.set_ticks_position来设置坐标刻度显示位置
x = np.arange(-3,4)
y = x * 0.2

ax = plt.gca()
ax.spines['right'].set_color("none")
ax.spines['top'].set_color("none")
ax.spines['left'].set_position(('data',0.0))
ax.spines['bottom'].set_position(('data',0.0))

plt.xlim(-3,3)
plt.ylim(-2,2)

# 设置坐标刻度显示的位置,如
ax.xaxis.set_ticks_position("top")
ax.yaxis.set_ticks_position("right")

plt.plot(x,y,linewidth=5,color='b')
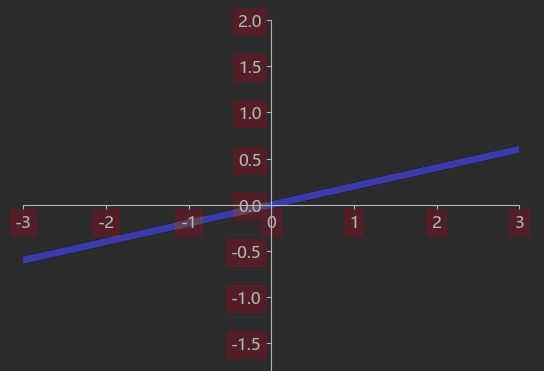
我们可以通过label.set_bbox来设置坐标轴小标的属性
facecolor 背景颜色 edgecolor 边框 alpha 透明度 zorder 设置叠加顺序
x = np.arange(-3,4)
y = x * 0.2

ax = plt.gca()
ax.spines['right'].set_color("none")
ax.spines['top'].set_color("none")
ax.spines['left'].set_position(('data',0.0))
ax.spines['bottom'].set_position(('data',0.0))

plt.xlim(-3,3)
plt.ylim(-2,2)

ax.xaxis.set_ticks_position("bottom")
ax.yaxis.set_ticks_position("left")

for label in ax.get_xticklabels() + ax.get_yticklabels():
    # 设置坐标轴小标label的字体大小
    label.set_fontsize(12)
    # 设置坐标轴小标的背景  facecolor 背景颜色  edgecolor 边框   alpha 透明度  zorder 设置叠加顺序
    label.set_bbox(dict(facecolor='pink',edgecolor='None',alpha=0.8,zorder=2))

plt.plot(x,y,linewidth=5,color='b',zorder=1)
16. 线条样式设置
plot() 用于画图它可以绘制点和线,语法格式如下:
# 画单条线
plot([x], y, [fmt], *, data=None, **kwargs)
# 画多条线
plot([x], y, [fmt], [x2], y2, [fmt2], ..., **kwargs)
参数说明:
- **x, y:**点或线的节点,x 为 x 轴数据,y 为 y 轴数据,数据可以列表或数组。
- **fmt:**可选,定义基本格式(如颜色、标记和线条样式)。
- ****kwargs:**可选,用在二维平面图上,设置指定属性,如标签,线的宽度等。
**颜色字符:**通过设置color属性,‘b’ 蓝色,‘m’ 洋红色,‘g’ 绿色,‘y’ 黄色,‘r’ 红色,‘k’ 黑色,‘w’ 白色,‘c’ 青绿色,‘#008000’ RGB 颜色符串。多条曲线不指定颜色时,会自动选择不同颜色。
**线型参数:**通过设置linestyle属性,‘‐’ 实线,‘‐‐’ 破折线,‘‐.’ 点划线,‘:’ 虚线。
**标记字符:**通过设置marker属性,‘.’ 点标记,‘,’ 像素标记(极小点),‘o’ 实心圈标记,‘v’ 倒三角标记,‘^’ 上三角标记,‘>’ 右三角标记,‘<’ 左三角标记…等等。
透明度:通过alpha属性进行设置,取值0-1
标记点颜色:通过markeredgecolor属性进行设置
标记点大小:通过markersize属性进行设置
标志点边缘粗细:通过markeredgewidth属性进行设置,一般使用空心标记时会进行设置
marker 可以定义的符号如下:
| 标记 | 符号 | 描述 |
|---|---|---|
| “.” | 点 | |
| “,” | 像素点 | |
| “o” | 实心圆 | |
| “v” | 下三角 | |
| “^” | 上三角 | |
| “<” | 左三角 | |
| “>” | 右三角 | |
| “1” | 下三叉 | |
| “2” | 上三叉 | |
| “3” | 左三叉 | |
| “4” | 右三叉 | |
| “8” | 八角形 | |
| “s” | 正方形 | |
| “p” | 五边形 | |
| “P” | 加号(填充) | |
| “*” | 星号 | |
| “h” | 六边形 1 | |
| “H” | 六边形 2 | |
| “+” | 加号 | |
| “x” | 乘号 x | |
| “X” | 乘号 x (填充) | |
| “D” | 菱形 | |
| “d” | 瘦菱形 | |
| “|” | 竖线 | |
| “_” | 横线 | |
| 0 (TICKLEFT) | 左横线 | |
| 1 (TICKRIGHT) | 右横线 | |
| 2 (TICKUP) | 上竖线 | |
| 3 (TICKDOWN) | 下竖线 | |
| 4 (CARETLEFT) | 左箭头 | |
| 5 (CARETRIGHT) | 右箭头 | |
| 6 (CARETUP) | 上箭头 | |
| 7 (CARETDOWN) | 下箭头 | |
| 8 (CARETLEFTBASE) | 左箭头 (中间点为基准) | |
| 9 (CARETRIGHTBASE) | 右箭头 (中间点为基准) | |
| 10 (CARETUPBASE) | 上箭头 (中间点为基准) | |
| 11 (CARETDOWNBASE) | 下箭头 (中间点为基准) | |
| “None”, " " or “” | 没有任何标记 | |
| ‘ . . . ... ...’ | 渲染指定的字符。例如 “ f f f” 以字母 f 为标记。 |
17. 创建图形对象
在 Matplotib 中,面向对象编程的核心思想是创建图形对象(figure object)。通过图形对象来调用其它的方法和属性,这样有助于我们更好地处理多个画布。在这个过程中,pyplot 负责生成图形对象,并通过该对象来添加一个或多个axes 对象(即绘图区域)。
Matplotib 提供了matplotlib. figure 图形类模块,它包含了创建图形对象的方法。通过调用 pyplot 模块中 figure() 函数来实例化figure 对象。
plt.figure(num=None,  # 图像变好或名称,数字为编号,字符串为名称
           figsize=None,  # 指定figure的宽和高,单位为英寸
           dpi=None,  # 绘图对象的分辨率,即每英寸多少个像素,缺省值为72
           facecolor=None,  # 背景颜色
           edgecolor=None,  # 边框颜色
           frameon=True, # 是否显示边框
           FigureClass=Figure, # matplotlib.figure.Figure派生类,从派生类创建figure实例
           clear=False, # 重建figure实例
           **kwargs
           )
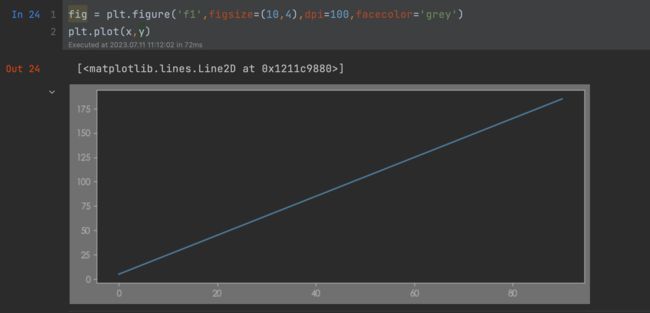
例:
fig = plt.figure('f1',figsize=(10,4),dpi=100,facecolor='grey') # 设置互补
plt.plot(x,y)
18. 多子图
figure是绘制对象(可理解为一个空白的画布),—个igure对象可以包含多个Axes子图,一个Axes是一个绘图区域,不加设置时,Axes为1,且每次绘图其实都是在figure 上的Axes 上绘图。
我们是在图形对象上面的Axes区域进行作画。
绘制子图的几种方式:
- add axes():添加区域
- subplot():均等地划分面布,只是创建一个包含子图区域的画布(返回区域对象)
- subplots():既创建了一个包含子图区域的画布,又创建了一个figure 图形对象(返回图形对象和区域对象)
18.1 add_axes添加区域
Matplotib 定义了一个axes 类(轴域类),该类的对象被称为 axes 对象(即轴域对象),它指定了一个有数值范围 限制的绘图区域。在一个给定的画布(igure)中可以包含多个axes 对象,但是同一个axes 对象只能在一个画布中使用。
2D绘图区域(axes)包含两个轴(axis)对象
语法:
add_axes(rect)
-
该方法用来生成一个axes 轴域对象,对象的位置由参数rect决定
-
rect 是位置参数,接受一个由 4 个元素组成的浮点数列表(百分比),形如[left, bottom,width, height],它表示添加到画布中的矩形区域的左下角坐标(x,y),以及宽度和高度。
例:
fig = plt.figure('myfig',figsize=(10,4),dpi=100,facecolor='grey')
ax1 = fig.add_axes([0,0,0.5,1]) # 宽是画布的50%
ax2 = fig.add_axes([0.6,0,0.3,1])

在区域里面进行作画
fig = plt.figure('myfig',figsize=(10,4),dpi=100,facecolor='grey')
ax1 = fig.add_axes([0,0,0.5,1]) # 宽高是画布的50%
ax2 = fig.add_axes([0.6,0,0.3,1])
ax3 = fig.add_axes([0.05,0.6,0.2,0.3])
ax1.plot(x,y)
ax2.plot(x,y2,color='g')
使用plt作画时,会默认在最近创建的区域中进行作画,如:
fig = plt.figure()
ax1 = fig.add_axes([0,0,1,1])
ax2 = fig.add_axes([0.3,0.3,0.5,0.5])
plt.plot([1,2,3,4,5],[15,5,6,13,9],color='r')
plt.bar([1,2,3,4,5],[12,5,7,3,8])
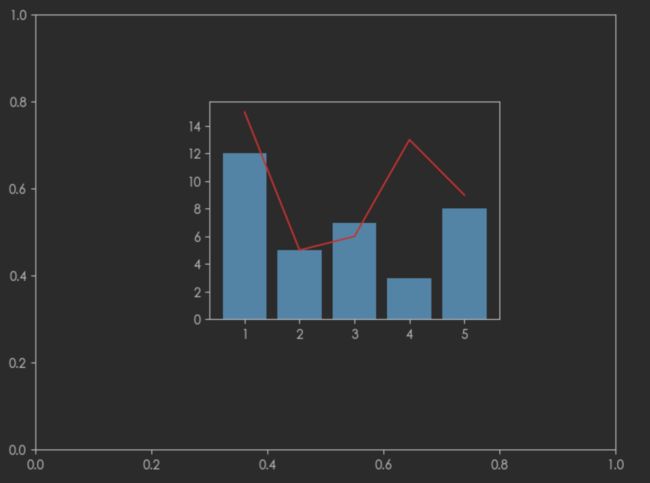
不能在figure中直接进行作画,必须在区域中进行作画
18.2 subplot()函数
可以均等的划分画布
语法:
subplot(nrows, ncols, index, **kwargs)
参数:
- nrows: 行
- ncols: 列
- index: 位置
- kwargs: title/label/ylabel…
也可以将几个值写在一起,如:subplot(233)
返回:区域对象axes
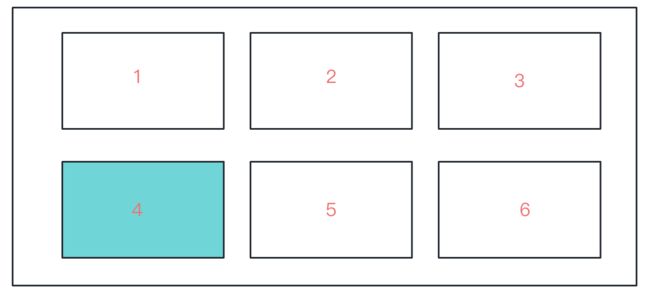
nrows 与ncols 表示要划分几行几列的子区域 (nrows*nclos表示子图数量),index 的初始值为1,用来选定具体的某个子区域。例如:subplot(234)表示在当前画布的右上角创建一个两行三列的绘图区域(如下图所示),同时,选择在第4个位置绘制子图。
当nrows为2,ncols为3,index为4时,则:
例:
ax1 = plt.subplot(2,2,3)
ax1.plot([1,2,3,4,5],[4,7,9,32,12])
ax2 = plt.subplot(222)
ax2.plot([1,2,3,4,5],[8,5,3,2,1])
plt.bar([1,2,3,4,5],[9,6,5,3,2],color='g')
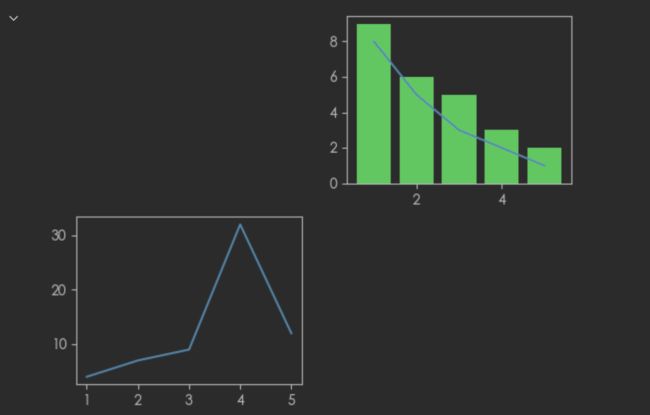
如果新建的子图与现有的子图重叠,那么重叠部分的子图将会被自动删除,因为它们不可以共享绘图区域,例如:
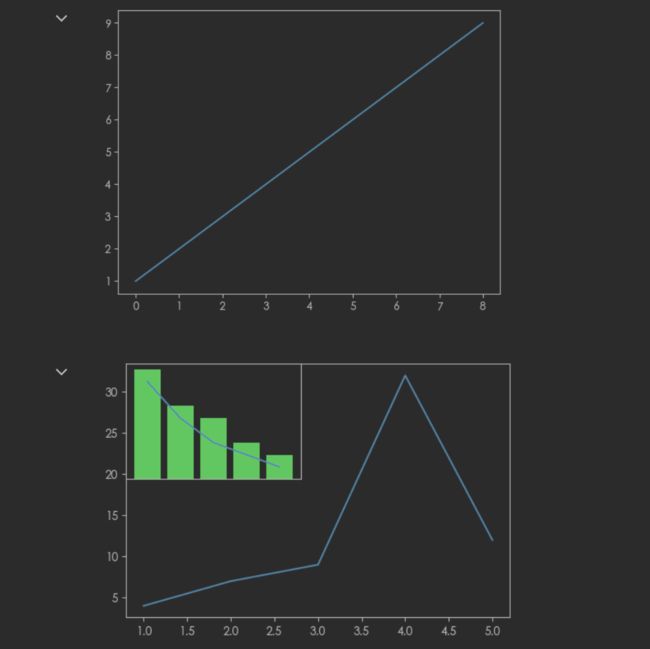
如果不想原来的被覆盖,需要解决这个问题,则需要创建新的画布,通过figure.add_subplot(),如:
plt.plot(np.arange(1,10))

fig = plt.figure(figsize=(6,4),dpi=100)
ax1 = fig.add_subplot(111)
ax1.plot([1,2,3,4,5],[4,7,9,32,12])
ax2 = fig.add_subplot(221)
ax2.plot([1,2,3,4,5],[8,5,3,2,1])
plt.bar([1,2,3,4,5],[9,6,5,3,2],color='g')
plt.xticks(ticks=[])
plt.yticks(ticks=[])
18.3 图形设置和标题重叠
设置多图的基本信息方式:
-
在创建的时候直接设置
如:
fig = plt.figure(figsize=(6,4),dpi=100) ax1 = fig.add_subplot(111,title='测试',xlabel='x轴') # 直接设置title标题和xlabel但是,存在子图标题重叠问题,如:
fig = plt.figure(figsize=(6,4))
ax1 = fig.add_subplot(2,1,1,title='子图1')
ax2 = fig.add_subplot(2,1,2,title='子图2')
ax1.plot(np.arange(10,40,3))
ax2.plot(np.arange(10,70,7))
解决办法:在最后使用
plt.tight_layout()fig = plt.figure(figsize=(6,4)) ax1 = fig.add_subplot(2,1,1,title='子图1') ax2 = fig.add_subplot(2,1,2,title='子图2') ax1.plot(np.arange(10,40,3)) ax2.plot(np.arange(10,70,7)) plt.tight_layout() # 紧凑的布局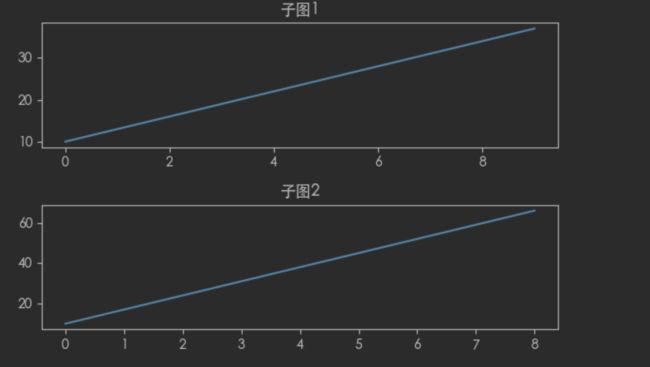
-
使用pyplot模块中的方法设置后再绘制
fig = plt.figure(figsize=(6,4))

ax1 = fig.add_subplot(2,1,1)
plt.title("子图1")
plt.plot(np.arange(10,40,3))

ax2 = fig.add_subplot(2,1,2)
plt.title("子图2")
plt.plot(np.arange(10,70,7))

plt.tight_layout()
-
使用返回的区域对象进行设置
注意:区域对象的方法很多都是set_开头
fig = plt.figure(figsize=(6,4))

ax1 = fig.add_subplot(2,1,1)
ax1.set_title("子图1")
ax1.plot(np.arange(10,40,3))

ax2 = fig.add_subplot(2,1,2)
ax2.set_title("子图2")
ax2.plot(np.arange(10,70,7))

plt.tight_layout()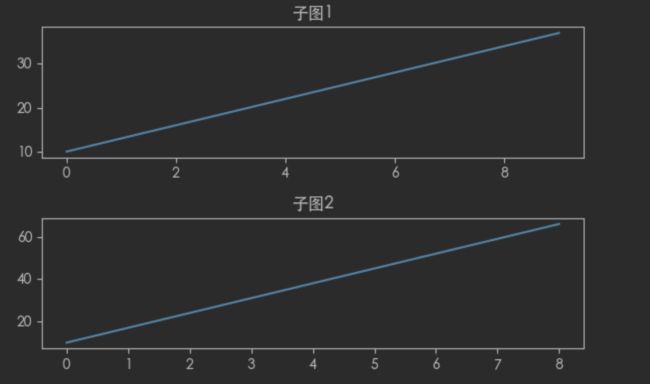
18.4 subplots()函数
matplotlib.pyplot模块提供了一个subplots()函数,它的使用方法和 subplot()函数类似。其不同之处在于,subplots()既创建了一个包含子图区域的画布,又创建了一个figure图形对象,而subplot()只是创建一个包含子图区域的画布。
subplots函数格式:
fig,ax = plt.subplots(nrows=1, ncols=1, *, sharex=False, sharey=False, squeeze=True, subplot_kw=None, gridspec_kw=None, **fig_kw)
- nrows:默认为 1,设置图表的行数。
- ncols:默认为 1,设置图表的列数。
- sharex、sharey:设置 x、y 轴是否共享属性,默认为 false,可设置为 ‘none’、‘all’、‘row’ 或 ‘col’。 False 或 none 每个子图的 x 轴或 y 轴都是独立的,True 或 ‘all’:所有子图共享 x 轴或 y 轴,‘row’ 设置每个子图行共享一个 x 轴或 y 轴,‘col’:设置每个子图列共享一个 x 轴或 y 轴。
- squeeze:布尔值,默认为 True,表示额外的维度从返回的 Axes(轴)对象中挤出,对于 N1 或 1N 个子图,返回一个 1 维数组,对于 N*M,N>1 和 M>1 返回一个 2 维数组。如果设置为 False,则不进行挤压操作,返回一个元素为 Axes 实例的2维数组,即使它最终是1x1。
- subplot_kw:可选,字典类型。把字典的关键字传递给 add_subplot() 来创建每个子图。
- gridspec_kw:可选,字典类型。把字典的关键字传递给 GridSpec 构造函数创建子图放在网格里(grid)。
- fig_kw:把详细的关键字参数传给 figure() 函数。
函数的返回值是一个元组,包括一个图形对象和所有的axes对象。其中axes对象的数量等于 nrows * ncois,且每个axes 对象均可通过索引值访问(从0开始)
例:
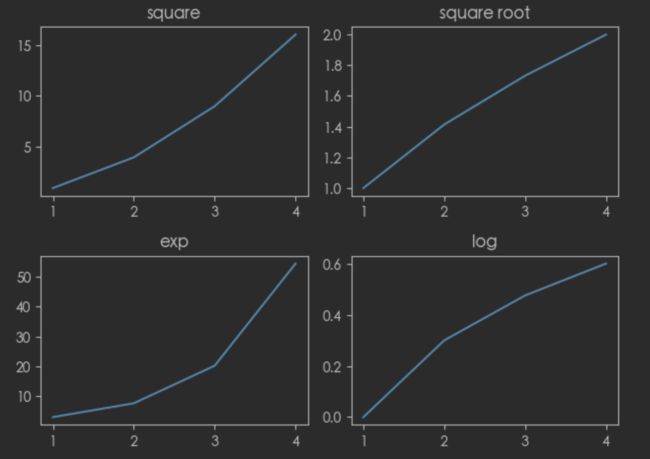
fig,ax = plt.subplots(2,2)
x = np.arange(1,5)

ax[0][0].plot(x,x**2)
ax[0][0].set_title('square')

ax[0][1].plot(x,np.sqrt(x))
ax[0][1].set_title('square root')

ax[1][0].plot(x,np.exp(x))
ax[1][0].set_title('exp')

ax[1][1].plot(x,np.log10(x))
ax[1][1].set_title('log')

plt.tight_layout()
例:
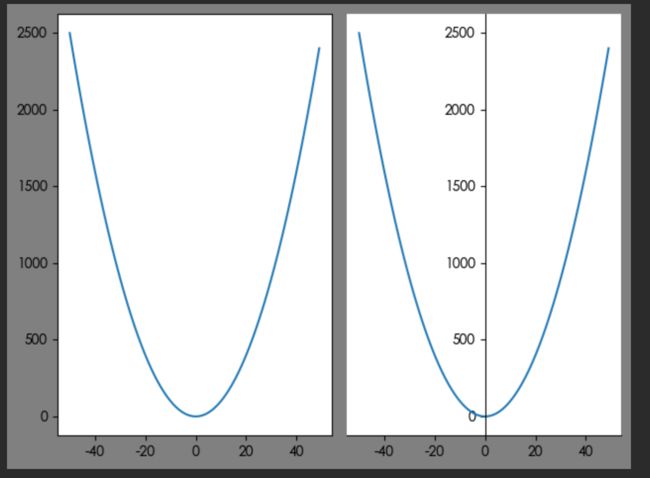
fig,axes = plt.subplots(1,2)
ax1 = axes[0]
ax2 = axes[1]
x = np.arange(-50,50,1)
y = x**2

fig.set_facecolor("grey")

ax1.plot(x,y)
ax2.plot(x,y)

ax2.spines['left'].set_position(('data',0))
ax2.spines['top'].set_color("none")
ax2.spines['right'].set_color("none")

plt.tight_layout()
18.5 特殊例子
fig = plt.figure(figsize=(6,4),dpi=100)
ax = fig.add_subplot(1,2,1)
ax.set_facecolor('r')

ax2 = fig.add_subplot(2,2,2)
ax4 = fig.add_subplot(2,2,4)
ax2.set_facecolor('g')
ax4.set_facecolor('b')

plt.tight_layout()

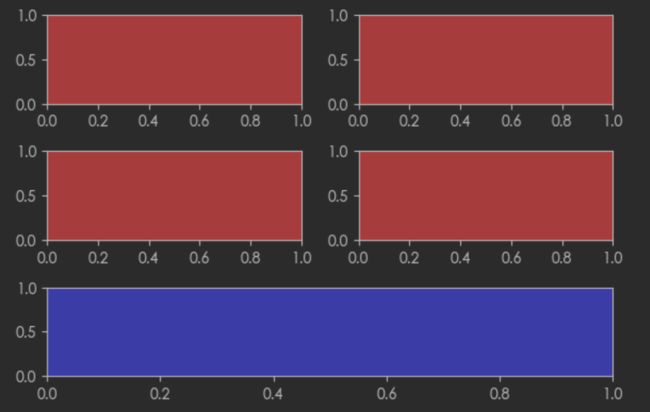
fig = plt.figure(figsize=(6,4),dpi=100)
ax1 = fig.add_subplot(3,2,1)
ax2 = fig.add_subplot(3,2,2)
ax3 = fig.add_subplot(3,2,3)
ax4 = fig.add_subplot(3,2,4)
ax1.set_facecolor('r')
ax2.set_facecolor('r')
ax3.set_facecolor('r')
ax4.set_facecolor('r')

ax = fig.add_subplot(3,1,3)
ax.set_facecolor('b')

plt.tight_layout()
19. Bar柱状图
19.1 基本柱状图
柱状图是一种用矩形柱来表示数据分类的图表。
柱状图可以垂直绘制,也可以水平绘制。
它的高度与其所表示的数值成正比关系。
柱状图显示了不同类别之间的比较关系,图表的水平轴 x 指定被比较的类别,垂直轴Y则表示具体的类别值
语法:
matplotlib.pyplot.bar(x, height, width=0.8, bottom=None, *, align='center', data=None, **kwargs)
参数:
x:浮点型数组,柱形图的 x 轴数据。
height:浮点型数组,柱形图的高度。
width:浮点型数组,柱形图的宽度。
bottom:浮点型数组,底座的 y 坐标,默认 0。
align:柱形图与 x 坐标的对齐方式,‘center’ 以 x 位置为中心,这是默认值。 ‘edge’:将柱形图的左边缘与 x 位置对齐。要对齐右边缘的条形,可以传递负数的宽度值及 align=‘edge’。
**kwargs::其他参数。
描边相关的关键字参数:
- edgecolor或者ec
- linestyle或者ls
- linewidth或者lw
例:
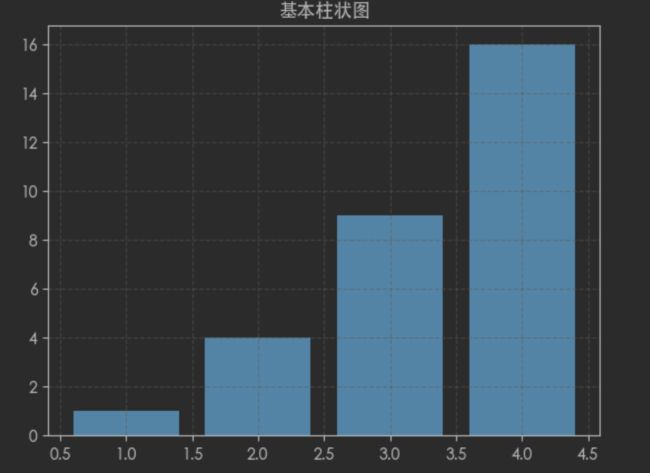
x = np.arange(1,5,1)
y = x**2
plt.title("基本柱状图")
plt.bar(x,y)
plt.grid(ls='--',alpha=0.5)
bottom参数
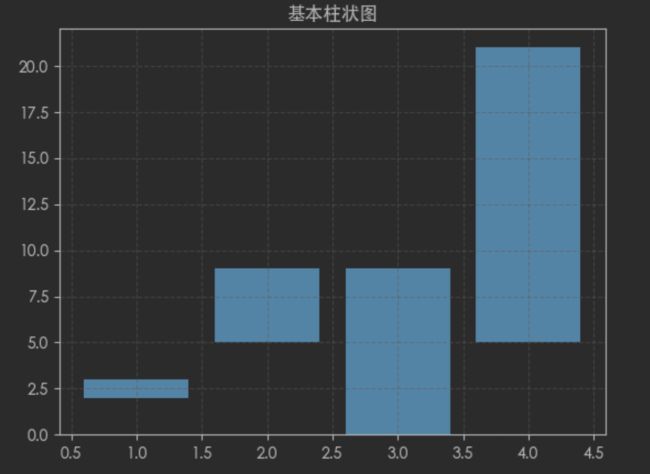
柱状图的起始位置,也就是y轴的起始坐标,默认为None
例:
x = np.arange(1,5,1)
y = x**2
plt.title("基本柱状图")
plt.bar(x,y,bottom=[2,5,0,5])
plt.grid(ls='--',alpha=0.5)
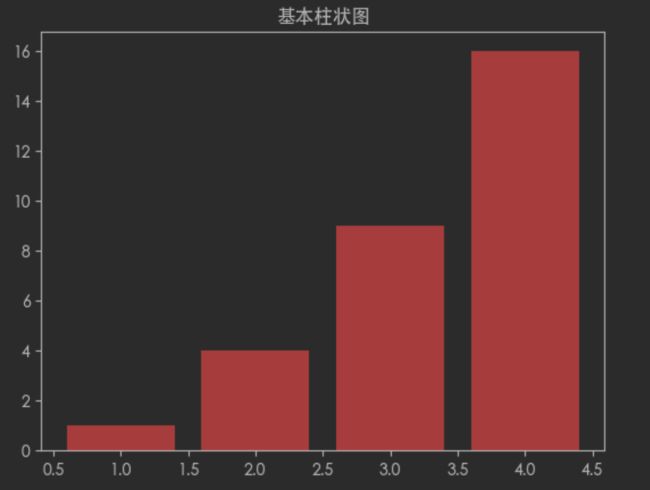
柱状图颜色
通过facecolor属性进行设置
例:
x = np.arange(1,5,1)
y = x**2
plt.title("基本柱状图")
plt.bar(x,y,facecolor='r') # 设置颜色为红色
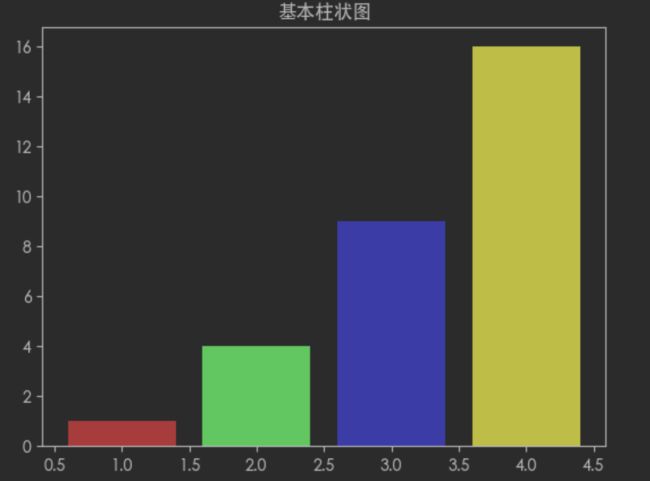
也可以通过设置color属性进行设置,color属性可以接受一个列表,展示每个柱子不同的颜色,如:
x = np.arange(1,5,1)
y = x**2
plt.title("基本柱状图")
plt.bar(x,y,color=['r','g','b','y']) # 设置颜色
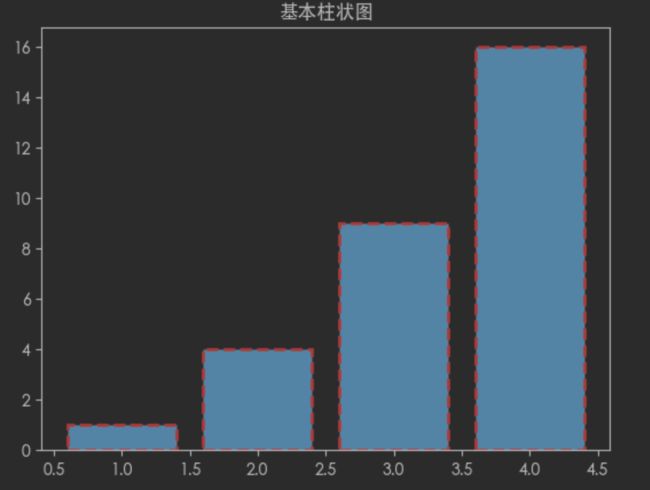
描边
x = np.arange(1,5,1)
y = x**2
plt.title("基本柱状图")
plt.bar(x,y,ls='--',lw=2,ec='r') # 描边
19.2 同位置多柱状图
分析:
- 本实例需要对x轴进行计算,因此需要将x轴转数值
- 确定同一x轴中,每个柱状图x轴的起始位置
- 需要设置图形的宽度
- 图形2的起始位置=图形2起始位置+图形的宽度
- 图形3的起始位置=图形3起始位置+2倍图形的宽度
- 需要给每个柱状图循环显示文本内容
- 显示图例
country = ['中国','俄罗斯','美国']
y_j = [23,20,9]
y_y = [27,18,13]
y_t = [19,22,18]

# 将x轴转化为数值  [0,1,2]
x = np.arange(len(country))

fig = plt.figure(figsize=(6,4),dpi=100)
ax = fig.add_subplot(1,1,1)
# 设置柱子的宽度
width = 0.1
# 确定金牌起始位置
j_x = x
# 确定银牌起始位置
y_x = x + width
# 确定铜牌起始位置
t_x = x + width*2
# 绘制
ax.bar(j_x,y_j,width=width,label='金牌')
ax.bar(y_x,y_y,width=width,label='银牌')
ax.bar(t_x,y_t,width=width,label='铜牌')

# 显示柱子的值
for i in range(len(country)):
    # va:垂直位置   ha:水平位置
    plt.text(j_x[i],y_j[i],y_j[i],va="bottom",ha="center")
    plt.text(y_x[i],y_y[i],y_y[i],va="bottom",ha="center")
    plt.text(t_x[i],y_t[i],y_t[i],va="bottom",ha="center")

# 显示图例
plt.legend()
# 将x轴由数字转为国家  用y_x 而不用 x   是因为要将x轴文本居中 刚好对其银牌
plt.xticks(y_x,labels=country)
19.3 堆叠柱状图
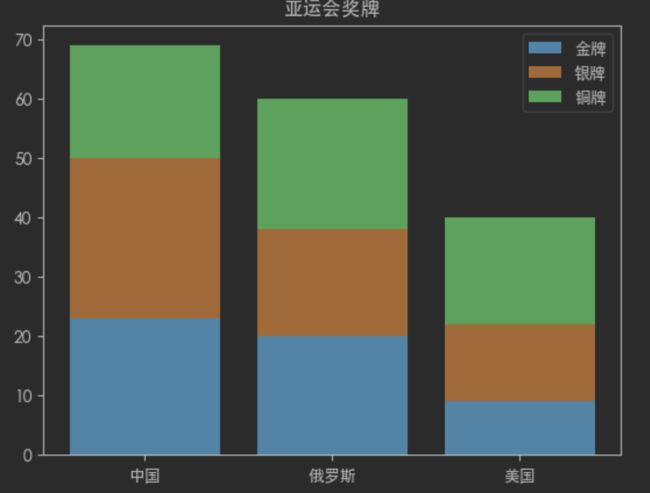
x = ['中国','俄罗斯','美国']
y_j = [23,20,9]
y_y = [27,18,13]
y_t = [19,22,18]
# 计算铜牌起始位置
bottom = []
for i in range(0,len(y_j)):
    bottom.append(y_j[i]+y_y[i])
plt.title("亚运会奖牌")
plt.bar(x,y_j,label='金牌')
plt.bar(x,y_y,bottom=y_j,label='银牌')
plt.bar(x,y_t,bottom=bottom,label='铜牌')

plt.legend()
19.4 水平柱状图
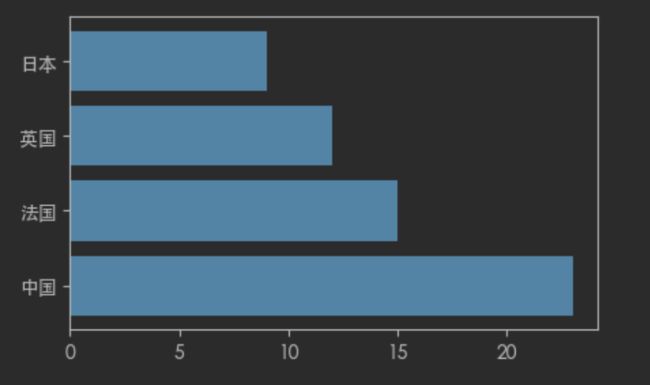
调用 Matplotib 的barh() 函数可以生成水平柱状图。
barh()函数的用法与 bar() 函数的用法基本一样,只是在调用 barh() 函数时使用 y参数传入Y轴数据,使用 width 参数传入代表条柱宽度的数据。
语法:
plt.barh(y, width, height=0.8, left=None, *, align=’center’, **KWargs)
例如:
country = ['中国','法国','英国','日本']
num = [23,15,12,9]

fig = plt.figure()
ax = fig.add_subplot(1,1,1)
ax.barh(country,num)
练习:三天中3部电影的票房变化
movie = ['长津湖','奇迹笨小孩','消失的她']
day1 = np.array([2023,1190,3024])
day2 = np.array([2784,1586,3206])
day3 = np.array([2811,1929,4023])

# 计算第三日票房数据柱子的位置
left_3 = day1+day2

fig = plt.figure()
ax = fig.add_subplot(1,1,1)
ax.barh(movie,day1,height=.3,label='Day 1')
ax.barh(movie,day2,left=day1,height=.3,label='Day 2')
ax.barh(movie,day3,left=left_3,height=.3,label='Day 3')

sum_data = day1 + day2 + day3

# 添加数据文字
for i in range(len(movie)):
    ax.text(sum_data[i],movie[i],sum_data[i],va='center',ha='left')

# 设置横坐标限制
plt.xlim(0,sum_data.max()+2000)

plt.tight_layout()
plt.legend()
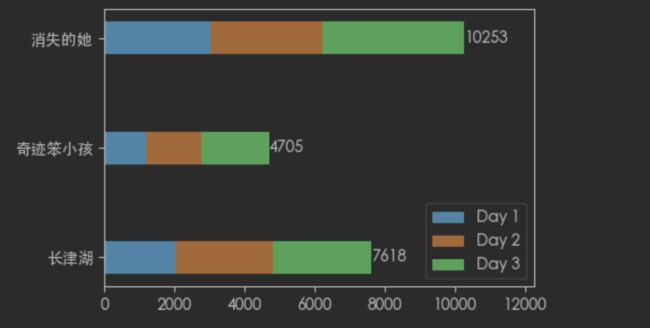
ha:horizontalalignment控制文本的x位置参数表示文本边界框的左边,中间或右边。
va:verticalalignment控制文本的y位置参数表示文本边界框的底部,中心或顶部
20. Hist直方图
20.1 基本直方图
直方图 (Histogram)又称质量分布图,它是一种条形图的一种,由一系列高度不等的纵向线段来表示数据分布的情况。直方图的横轴表示数据类型,纵轴表示分布情况。
首先,我们需要了解柱状图和直方图的区别。直方图用于概率分布,它显示了一组数值序列在给定的数值范围内出现的概率,而柱状图则用于展示各个类别的频数。
| 柱状图 | 直方图 |
|---|---|
| 柱状图一般用于描述离散型分类数据的对比 | 直方图一般用于描述连续型数据的分布关系 |
| 每根柱子宽度固定,柱子之间会有间距 | 每根柱子宽度可以不一样,且一般没有间距 |
| 横轴变量可以任意排序 | 横轴变量有一定顺序规则 |
语法:
matplotlib.pyplot.hist(x, bins=None, range=None, density=False, weights=None, cumulative=False, bottom=None, histtype='bar', align='mid', orientation='vertical', rwidth=None, log=False, color=None, label=None, stacked=False, **kwargs)
参数:
x:表示要绘制直方图的数据,可以是一个一维数组或列表。bins:可选参数,表示直方图的箱数。默认为10。range:可选参数,表示直方图的值域范围,可以是一个二元组或列表。默认为None,即使用数据中的最小值和最大值。density:可选参数,表示是否将直方图归一化。默认为False,即直方图的高度为每个箱子内的样本数,而不是频率或概率密度。weights:可选参数,表示每个数据点的权重。默认为None。cumulative:可选参数,表示是否绘制累积分布图。默认为False。bottom:可选参数,表示直方图的起始高度。默认为None。histtype:可选参数,表示直方图的类型,可以是’bar’、‘barstacked’、‘step’、‘stepfilled’等。默认为’bar’。align:可选参数,表示直方图箱子的对齐方式,可以是’left’、‘mid’、‘right’。默认为’mid’。orientation:可选参数,表示直方图的方向,可以是’vertical’、‘horizontal’。默认为’vertical’。rwidth:可选参数,表示每个箱子的宽度。默认为None。log:可选参数,表示是否在y轴上使用对数刻度。默认为False。color:可选参数,表示直方图的颜色。label:可选参数,表示直方图的标签。stacked:可选参数,表示是否堆叠不同的直方图。默认为False。**kwargs:可选参数,表示其他绘图参数。
返回值:
- n:数组或数组列表 - 直方图的值,即每个区间数据的个数
- bins:数组 - 返回各个bin的区间起始位置的值
- patches:返回每个bin里面包含的数据,是一个list
将统计值的范围分段,即将整个值的范围分成一系列间隔,然后计算每个间隔中有多少值。直方图也可以被归一化以显示“相对“频率。然后,它显示了属于几个类别中的每个类别的占比,其高度总和等于1
例:
fig = plt.figure()
ax = fig.add_subplot(1,1,1)
# 生成随机数据
data = np.random.randint(140,200,200)
# 绘制直方图 bins:分成10组,ec:边框颜色
num,bins,patches = ax.hist(data,bins=10,ec='white')
print(num)
print(bins)
print(patches)
'''
[17. 19. 19. 11. 30. 20. 16. 19. 24. 25.]
[140.  145.9 151.8 157.7 163.6 169.5 175.4 181.3 187.2 193.1 199. ]

'''

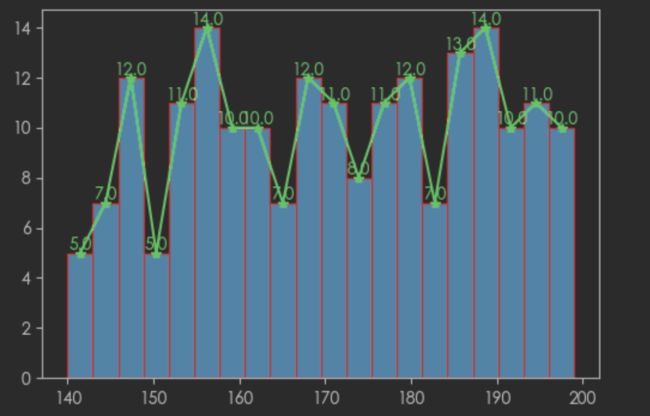
20.2 折线直方图
在直方图中,我们也可以加一个折线图,辅助我们查看数据变化情况
- 首先通过pyplot.subplots()创建Axes对象
- 通过Axes对象调用hist())方法绘制直方图,返回折线图所需要的下x,y数据。
- 然后Axes对象调用plot()绘制折线图
- 我们对第一节代码进行改造一下
fig = plt.figure()
ax = fig.add_subplot(1,1,1)
# 生成随机数据
data = np.random.randint(140,200,200)
# 绘制直方图 bins:分成20组,ec:边框颜色
num,bins,patches = ax.hist(data,bins=20,ec='r')

# 计算直方图每个柱子中点的数据
x = []
for i in range(len(bins)-1):
    x.append((bins[i]+bins[i+1])/2)
# 绘制折线
ax.plot(x,num,marker="*",color='g')
# 添加数据文本
for i in range(len(x)):
    plt.text(x[i],num[i],num[i],va='bottom',ha='center',color='g')
20.3 不等距分组
前面的直方图都是等距的,但有时我们需要得到不等距的直方图,这个时候只需要确定分组上下限
例:
fig = plt.figure()
ax = fig.add_subplot(1,1,1)
# 生成随机数据
data = np.random.randint(140,200,200)
# 分组
bins = [140,145,160,169,180,188,200]
ax.hist(data,bins,ec='r')
plt.xticks(bins)
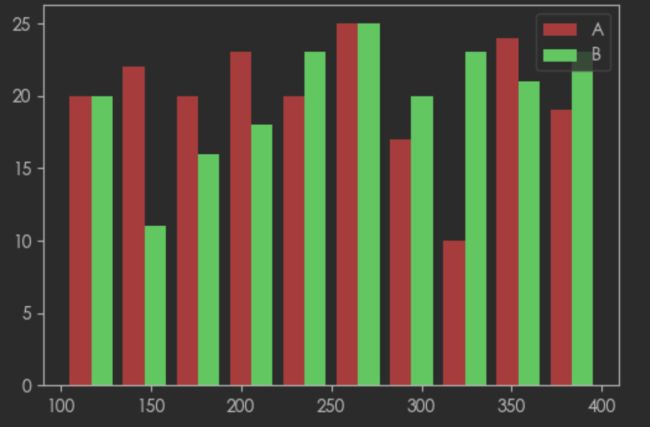
20.4 多类型直方图
我们在使用直方图查查看数据的频率时,有时候会查看多种类型数据出现的频率。
这时候我们可以以列表的形式传入多种数据给hist()方法的x数据
例:
fig = plt.figure()
ax = fig.add_subplot(1,1,1)
# 生成随机数据
data1 = np.random.randint(100,400,200)
data2 = np.random.randint(100,400,200)

ax.hist([data1,data2],bins=10,label=['A','B'],color=['r','g'])
ax.legend()
20.5 堆叠直方图
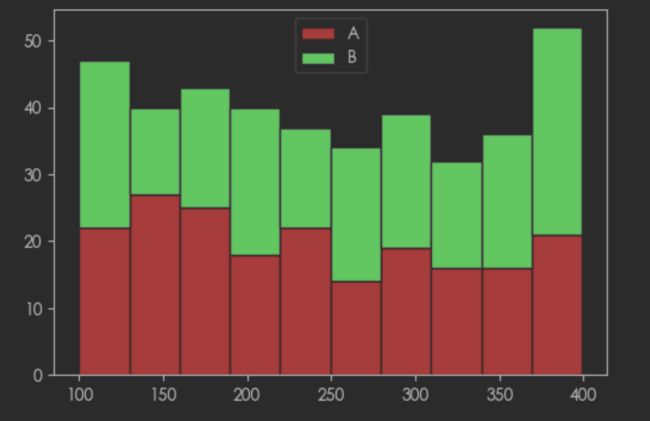
我们有时候会对吧同样数据范围情况下,对比两组不同对象群体收集的数据差异,指定stacked=True
fig = plt.figure()
ax = fig.add_subplot(1,1,1)
# 生成随机数据
data1 = np.random.randint(100,400,200)
data2 = np.random.randint(100,400,200)

ax.hist([data1,data2],bins=10,label=['A','B'],color=['r','g'],stacked=True,ec='white')
ax.legend()
21. Pie饼状图
21.1 基本饼状图
饼状图用来显示个数据系列,具体来说,饼状图显示一个数据系列中各项目的占项目总和的百分比。
Maiplotib 提供了一个 pie()函数,该函数可以生成数组中数据的饼状图。您可使用 x/sum(x) 来计算各个扇形区域占饼图总和的百分比。语法:
matplotlib.pyplot.pie(x, explode=None, labels=None, colors=None, autopct=None, pctdistance=0.6, shadow=False, labeldistance=1.1, startangle=0, radius=1, counterclock=True, wedgeprops=None, textprops=None, center=0, 0, frame=False, rotatelabels=False, *, normalize=None, data=None)[source]
- x:浮点型数组或列表,用于绘制饼图的数据,表示每个扇形的面积。
- explode:数组,表示各个扇形之间的间隔,默认值为0。
- labels:列表,各个扇形的标签,默认值为 None。
- colors:数组,表示各个扇形的颜色,默认值为 None。
- autopct:设置饼图内各个扇形百分比显示格式,%d%% 整数百分比,%0.1f 一位小数, %0.1f%% 一位小数百分比, %0.2f%% 两位小数百分比。
- labeldistance:标签标记的绘制位置,相对于半径的比例,默认值为 1.1,如 <1则绘制在饼图内侧。
- pctdistance::类似于 labeldistance,指定 autopct 的位置刻度,默认值为 0.6。
- shadow::布尔值 True 或 False,设置饼图的阴影,默认为 False,不设置阴影。
- radius**:**:设置饼图的半径,默认为 1。
- startangle::用于指定饼图的起始角度,默认为从 x 轴正方向逆时针画起,如设定 =90 则从 y 轴正方向画起。
- counterclock:布尔值,用于指定是否逆时针绘制扇形,默认为 True,即逆时针绘制,False 为顺时针。
- wedgeprops:字典类型,默认值 None。用于指定扇形的属性,比如边框线颜色、边框线宽度等。例如:wedgeprops={‘linewidth’:5} 设置 wedge 线宽为5。
- textprops:字典类型,用于指定文本标签的属性,比如字体大小、字体颜色等,默认值为 None。
- center:浮点类型的列表,用于指定饼图的中心位置,默认值:(0,0)。
- frame:布尔类型,用于指定是否绘制饼图的边框,默认值:False。如果是 True,绘制带有表的轴框架。
- rotatelabels:布尔类型,用于指定是否旋转文本标签,默认为 False。如果为 True,旋转每个 label 到指定的角度。
- data:用于指定数据。如果设置了 data 参数,则可以直接使用数据框中的列作为 x、labels 等参数的值,无需再次传递。
返回值:
wedges:一个包含扇形对象的列表。texts:一个包含文本标签对象的列表。autotexts:一个包含自动生成的文本标签对象的列表。
例:
fig = plt.figure()
ax = fig.add_subplot(1,1,1)

labels = ['娱乐','饮食','出行','住宿','其他']
datas = [689,1403,307,388,673]
ax.pie(datas,labels=labels)
plt.tight_layout()
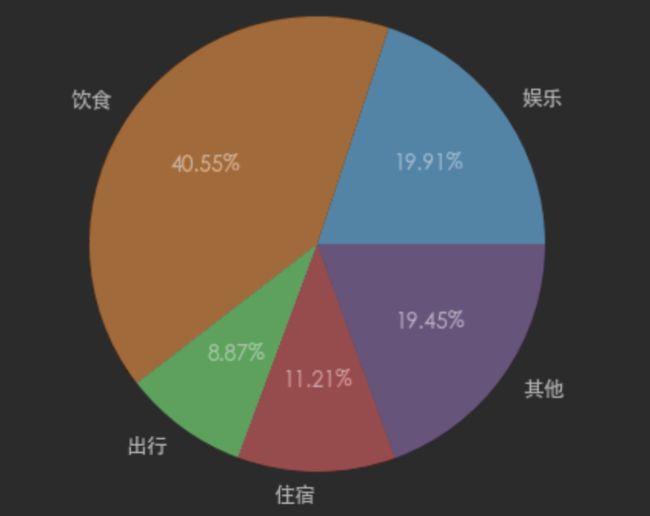
饼状图百分比显示
添加autopct='%.2f%%',保留两位小数
fig = plt.figure()
ax = fig.add_subplot(1,1,1)

labels = ['娱乐','饮食','出行','住宿','其他']
datas = [689,1403,307,388,673]
ax.pie(datas,labels=labels,autopct='%.2f%%')
plt.tight_layout()
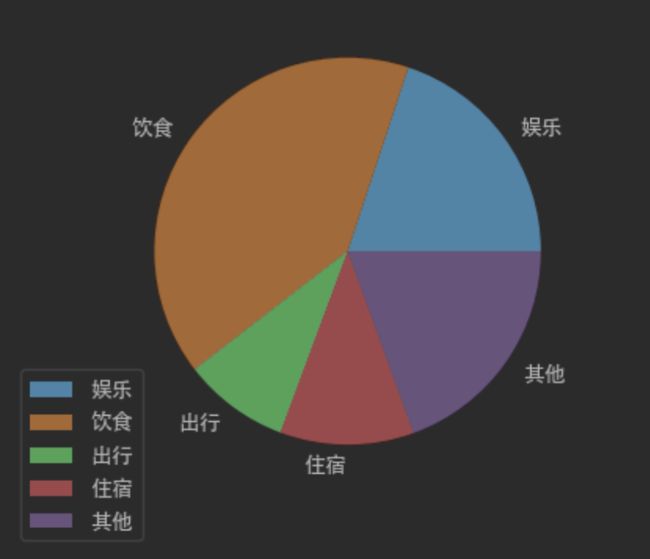
图例
例:
fig = plt.figure()
ax = fig.add_subplot(1,1,1)

labels = ['娱乐','饮食','出行','住宿','其他']
datas = [689,1403,307,388,673]
# 饼图分离
explode = [0,0.02,0.04,0.06,0.08]
ax.pie(datas,labels=labels) # 添加explode属性

plt.legend(loc=3, bbox_to_anchor=(-0.2, -0.12))
21.2 饼状图分离
指定饼图某些部分的突出显示
添加explode属性
fig = plt.figure()
ax = fig.add_subplot(1,1,1)

labels = ['娱乐','饮食','出行','住宿','其他']
datas = [689,1403,307,388,673]
# 饼图分离
explode = [0,0.02,0.04,0.06,0.08]
ax.pie(datas,labels=labels,autopct='%.2f%%',explode=explode) # 添加explode属性

plt.tight_layout()
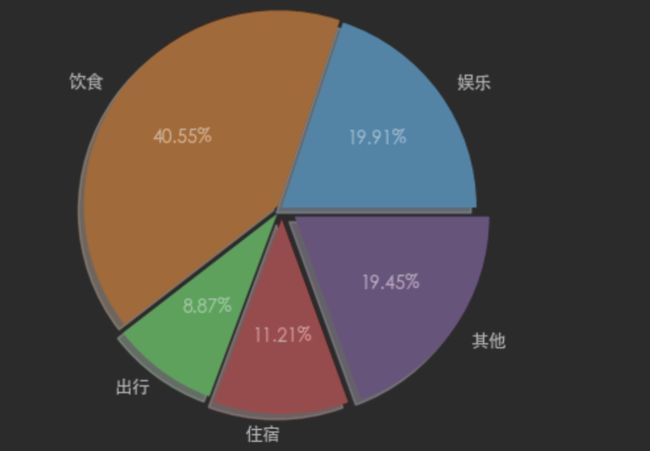
21.3 饼图阴影
通过设置shadow=True
例:
fig = plt.figure()
ax = fig.add_subplot(1,1,1)

labels = ['娱乐','饮食','出行','住宿','其他']
datas = [689,1403,307,388,673]
# 饼图分离
explode = [0,0.02,0.04,0.06,0.08]
ax.pie(datas,labels=labels,autopct='%.2f%%',explode=explode,shadow=True) # 添加explode属性

plt.tight_layout()
21.4 设置饼图百分比和文本距离中心位置
-
pctdistance: 设置百分比标签与圆心的距离
-
labeldistance: 设置各扇形标签 (图例)与圆心的距离
例:
fig = plt.figure()
ax = fig.add_subplot(1,1,1)

labels = ['娱乐','饮食','出行','住宿','其他']
datas = [689,1403,307,388,673]
# 饼图分离
explode = [0,0.02,0.04,0.06,0.08]
ax.pie(datas,labels=labels,autopct='%.2f%%',explode=explode,pctdistance=1.35,labeldistance=1.2) # 添加explode属性

plt.tight_layout()

22. Scatter散点图
散点图也叫X-Y 图,它将所有的数据以点的形式展现在直角坐标系上,以显示变量之间的相互影响程度,点的位置由变量的数值决定。
通过观察散点图上数据点的分布情况,我们可以推断出变量间的相关性。如果变量之间不存在相互关系,那么在散点图上就会表现为随机分布的离散的点,如果存在某种相关性,那么大部分的数据点就会相对密集并以某种趋势呈现。
数据的相关关系主要分为:正相关 (两个变量值同时增长)、负相关 (一个变量值增加另一个变量值下降)、不相关、线性相关、指数相关等。那些离点集群较远的点我们称为离群点或者异常点。
语法:
matplotlib.pyplot.scatter(x, y, s=None, c=None, marker=None, cmap=None, norm=None, vmin=None, vmax=None, alpha=None, linewidths=None, *, edgecolors=None, plotnonfinite=False, data=None, **kwargs)
参数:
x,y:长度相同的数组,也就是我们即将绘制散点图的数据点,输入数据。
s:点的大小,默认 20,也可以是个数组,数组每个参数为对应点的大小。
c:点的颜色,默认蓝色 ‘b’,也可以是个 RGB 或 RGBA 二维行数组。
marker:点的样式,默认小圆圈 ‘o’。
cmap:Colormap,默认 None,标量或者是一个 colormap 的名字,只有 c 是一个浮点数数组的时才使用。如果没有申明就是 image.cmap。
norm:Normalize,默认 None,数据亮度在 0-1 之间,只有 c 是一个浮点数的数组的时才使用。
vmin,vmax::亮度设置,在 norm 参数存在时会忽略。
alpha::透明度设置,0-1 之间,默认 None,即不透明。
linewidths::标记点的长度。
edgecolors::颜色或颜色序列,默认为 ‘face’,可选值有 ‘face’, ‘none’, None。
plotnonfinite::布尔值,设置是否使用非限定的 c ( inf, -inf 或 nan) 绘制点。
**kwargs::其他参数。
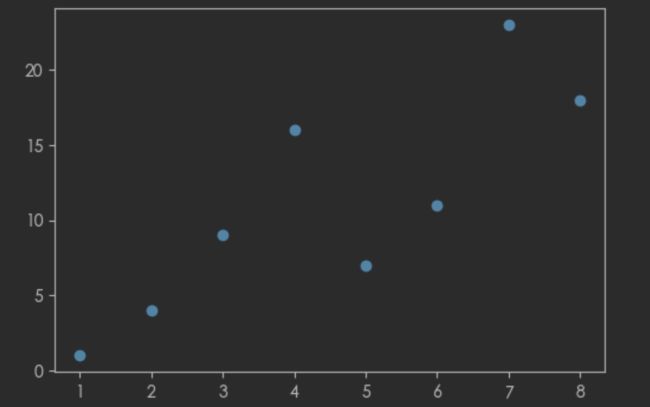
例:
x = np.array([1, 2, 3, 4, 5, 6, 7, 8])
y = np.array([1, 4, 9, 16, 7, 11, 23, 18])
plt.scatter(x, y)
散点图的属性设置
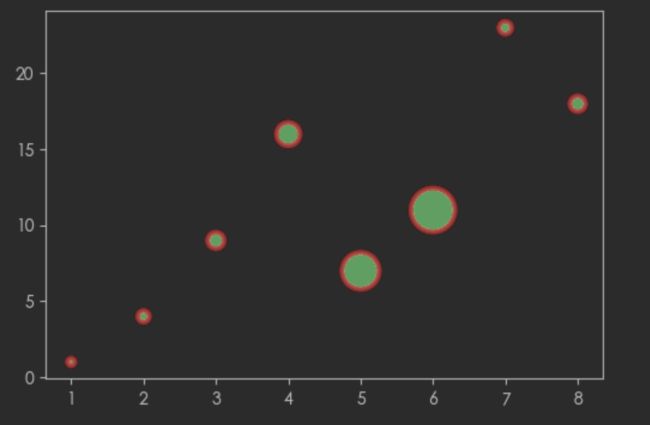
x = np.array([1, 2, 3, 4, 5, 6, 7, 8])
y = np.array([1, 4, 9, 16, 7, 11, 23, 18])
sizes = np.array([20,50,100,200,500,700,60,90])
plt.scatter(x, y, s=sizes,ec='r',color='g',lw=3,alpha=0.8)
自定义点点颜色和透明度
# x轴数据
x = np.random.rand(50)
# y轴数据
y = np.random.rand(50)
# 生成一个浮点数或者N维浮点数组,取数范围,正态分布的随机样本数
s = (10*np.random.randn(50)) ** 2

# 颜色可以使用一组数字序列
# 如果只需要三种颜色
# colors = np.resize(np.array([1,2,3]),50)
# 颜色随机
colors = np.random.rand(50)
plt.scatter(x,y,s,c=colors)

**可以选择不同的颜色条 - 配合cmap参数 **
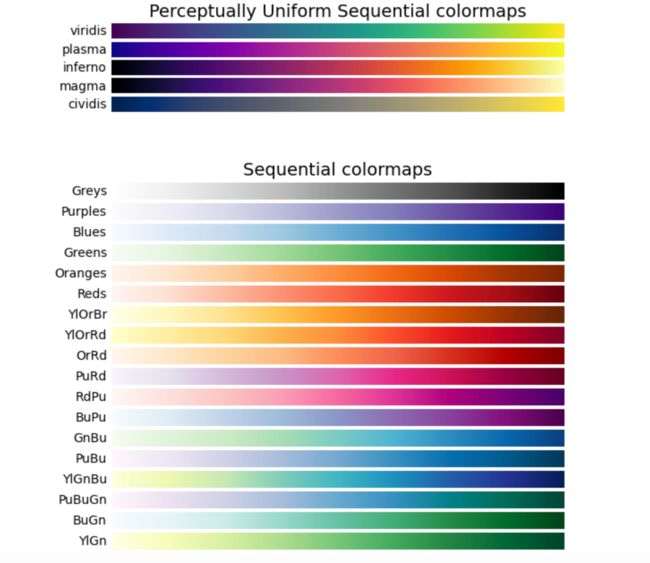
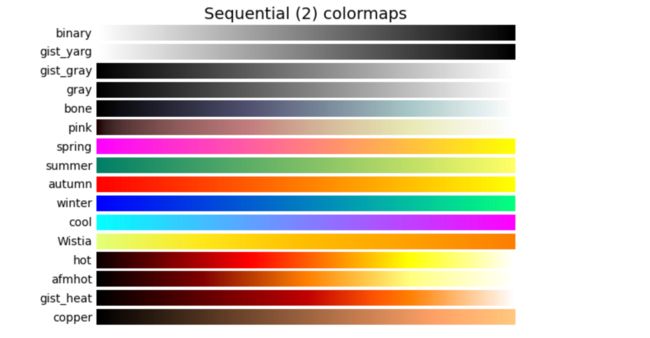
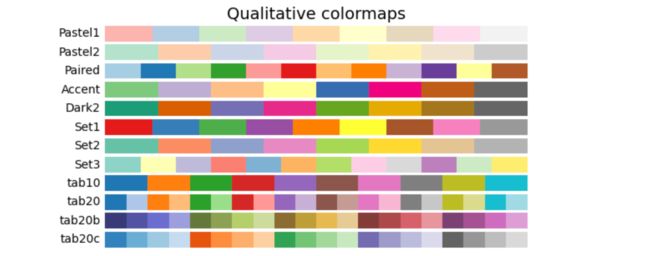
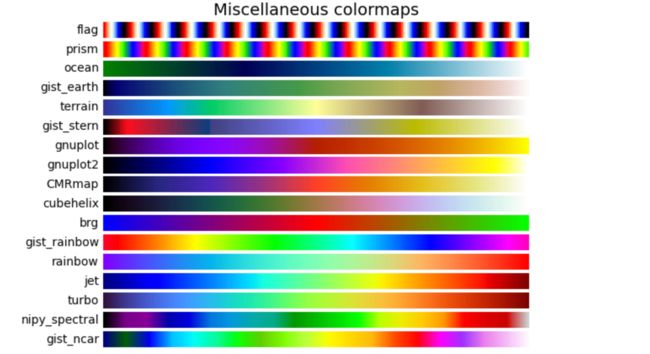
颜色条colormap
Matplotlib模块提供了很多可用的颜色条
颜色条就像一个颜色列表,其中每种颜色都有一个范围从0到100的值
Cmap可选值
![]()
例:
# x轴数据
x = np.random.rand(50)
# y轴数据
y = np.random.rand(50)

colors = np.linspace(0,1,50)
plt.scatter(x,y,c=colors,cmap='cividis')

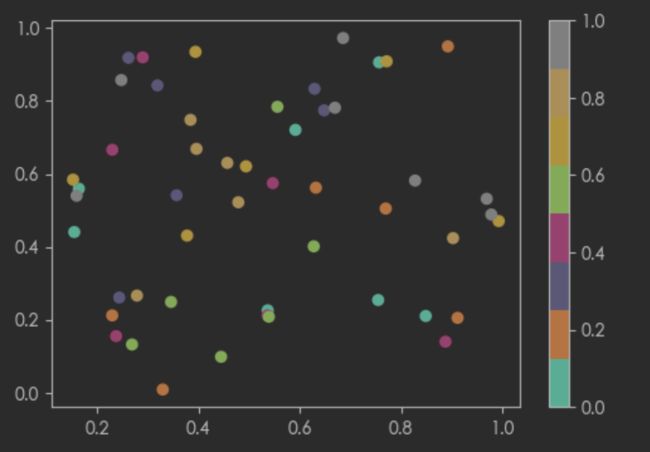
如果要显示颜色条,需要使用 plt.colorbar() 方法,例如
# x轴数据
x = np.random.rand(50)
# y轴数据
y = np.random.rand(50)

colors = np.linspace(0,1,50)

fig = plt.figure()
ax = fig.add_subplot(1,1,1)

plt.scatter(x,y,c=colors,cmap='Dark2')
plt.colorbar()
23. Contours等高线图
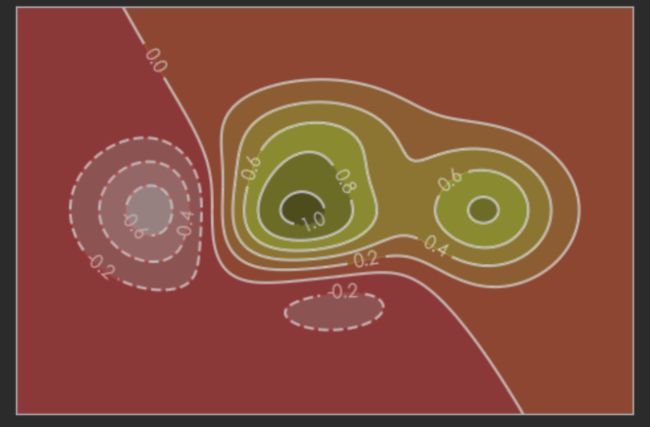
plt.contourf()画出范围 plt.contour()画出等高线 plt.clabe()标注label
def f(x,y):
    # the height function
    return (1-x/2+x**5 + y**3) * np.exp(-x**2-y**2)

n = 256
x = np.linspace(-3,3,n)
y = np.linspace(-3,3,n)

X,Y = np.meshgrid(x,y)

# use plt.contourf to filling contours
# X,Y and value for (X,Y) point  分成10块  画出范围  camp 颜色
plt.contourf(X,Y,f(X,Y),8,alpha = 0.75,cmap=plt.cm.hot)

# use plt.contour to add contour lines  画等高线  分成10块
C = plt.contour(X,Y,f(X,Y),8,colors='black')

# adding label
plt.clabel(C,inline=True,fontsize=10)

plt.xticks(())
plt.yticks(())
plt.show()
24. 3D数据
plt.plot_surface()
import numpy as np
from matplotlib import pyplot as plt
from mpl_toolkits.mplot3d import Axes3D

fig = plt.figure()
ax = Axes3D(fig)

# X,Y value
X = np.arange(-4,4,0.25)
Y = np.arange(-4,4,0.25)
X,Y = np.meshgrid(X,Y)
R = np.sqrt(X**2+Y**2)
# height value
Z = np.sin(R)

# 画出3D图
# rstride : row stride  行跨度
# cstride : column stride  列跨度
# edgecolor : 边框  k:black
ax.plot_surface(X,Y,Z,rstride=1,cstride=1,cmap=plt.get_cmap('rainbow'),edgecolor='k')

# 等高线
# zdir  从 哪个 轴压下去
ax.contourf(X,Y,Z,zdir='z',offset=-2,cmap=plt.get_cmap('rainbow'))
ax.set_zlim(-2,2)  # 设置等高线的高度

plt.show()
25. 保存图片
语法:
pyplot.savefig(fname, dpi=None, facecolor=’w’, edgecolor=’w’, orientation=’portrait’, papertype=None, format=None, transparent=False, bbox_inches=None, pad_inches=0.1, frameon=None, metadata=None)
参数:
- fname:(字符串或者仿路径或仿文件)如果格式已经设置,这将决定输出的格式并将文件按fname来保存。如果格式没有设置,在fname有扩展名的情况下推断按此保存,没有扩展名将按照默认格式存储为"png"格式,并将适当的扩展名添加在fame后面。
- dpi: 分辨率,每英寸的点数
- facecolor(颜色或"auto",默认值是"auto"):图形表面颜色。如果是"auto",使用当前图形的表面颜色。
- edgecolor (颜色或"auto",默认值:“auto”):圈形乡边缘颜色。如果是"auto",使用当前图形的边缘颜色。
- format(字符串):文件格式,比如’png”,“pdf,“svg”等,未设置的行为将被记录在fname
- tansparent: 用于将图片背景设置为透明。图形也会是透明,除非通过关键字参数指定了表面颜色和/或边缘
例:
fig = plt.figure()
ax = fig.add_subplot(1,1,1)
x = [1,2,3,4,5]
y = [32,45,21,45,74]

ax.bar(x,y)
plt.savefig('test.png')
注意:
第一个参数就是保存的路径
如果路径中包含未创建的文件夹,会报错,需要手动或者使用os模块创建
必须在调用plt.show( 之前保存,否则将保存的是空白图形
26. 词云图
wordcloud 是什么?词云图,也叫文字云,是对文本中出现频率较高的“关键词”予以视觉化的展现,词云图过滤掉大量的低频低质的文本信息,使得浏览者只要一眼扫过文本就可领略文本的主旨。
WordCloud
WordCloud 是一款python环境下的词云图工具包,同时支持python2和python3,能通过代码的形式把关键词数据转换成直观且有趣的图文模式。
语法:
w=WordCloud()
参数:
参数 描述
- width:指定生成词云图片的宽度,如果该参数不指定,则默认为400像素
- height:指定生成词云图片的高度,如果该参数不指定,则默认为200像素
- min_font_size:指定词云字体中的最小字号,如果该参数不指定,则默认为4号
- max_font_size:指定词云字体中的最大字号,如果该参数不指定,则会根据词云图片的高度自动调节
- font_step:指定词云字体字号之间的间隔,如果该参数不指定,则默认为1
- font_path:指定字体文件的路径
- max_words:指定词云显示的最大单词数量,默认为200
- stop_words:指定词云的排除词列表,列入到排除词列表中的单词不会被词云显示
- mask:指定生成词云图片的形状,如果需要非默认形状,需要使用imread()函数引用图片
- background_color:指定词云图片的北京颜色,默认为黑色
27. 箱线图
boxplot()
箱线图(Boxplot)是一种用作显示一组数据分散情况资料的统计图表
箱线图基本介绍
箱线图,又称箱形图(boxplot) 或盒式图,不同于一般的折线图、柱状图或饼图等图表,其包含一些统计学的均值、分位数、极值等统计量,该图信息量较大,不仅能够分析不同类别数据平均水平差异,还能揭示数据间离散程度、 异常值、分布差异等。具体含义可通如下图表进行说明:
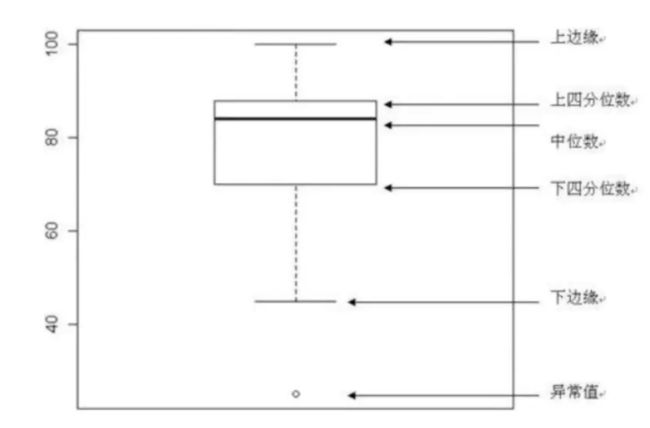
在箱型图中,我们从上四分位数到下四分位数绘制一个盒子,然后用一条垂直触须(形象地称为“盒须”) 穿过盒子的中间。上垂线延伸至上边缘(最大值),下垂线延伸至下边缘(最小值)
箱型图应用场景
- 箱型图由于能显示一组数据分散情况,常用于品质管理
- 箱型图有利于数据的清洗,能快速知道数据分别情况
- 箱型图有助于分析一直数据的偏向如分析公司员工收入水平
语法:
matplotlib.pyplot.boxplot(x, notch=None, sym=None, vert=None, whis=None, positions=None, widths=None, patch_artist=None, bootstrap=None, usermedians=None, conf_intervals=None, meanline=None, showmeans=None, showcaps=None, showbox=None, showfliers=None, boxprops=None, labels=None, flierprops=None, medianprops=None, meanprops=None, capprops=None, whiskerprops=None, manage_xticks=True, autorange=False, zorder=None, hold=None, data=None)
| 参数 | 说明 | 参数 | 说明 |
|---|---|---|---|
| x | 指定要绘制箱线图的数据; | showcaps | 是否显示箱线图顶端和末端的两条线 |
| notch | 是否是凹口的形式展现箱线图 | showbox | 是否显示箱线图的箱体 |
| sym | 指定异常点的形状 | showfliers | 是否显示异常值 |
| vert | 是否需要将箱线图垂直摆放 | boxprops | 设置箱体的属性,如边框色,填充色等 |
| whis | 指定上下须与上下四分位的距离 | labels | 为箱线图添加标签 |
| positions | 指定箱线图的位置 | filerprops | 设置异常值的属性 |
| widths | 指定箱线图的宽度 | medianprops | 设置中位数的属性 |
| patch_artist | 是否填充箱体的颜色; | meanprops | 设置均值的属性 |
| meanline | 是否用线的形式表示均值 | capprops | 设置箱线图顶端和末端线条的属性 |
| showmeans | 是否显示均值 | whiskerprops | 设置须的属性 |
例:
x = np.random.rand(20)
# showmeans:显示算术平均值  meanline:均值是否显示为线
plt.boxplot(x,showmeans=True,meanline=True)
plt.show()
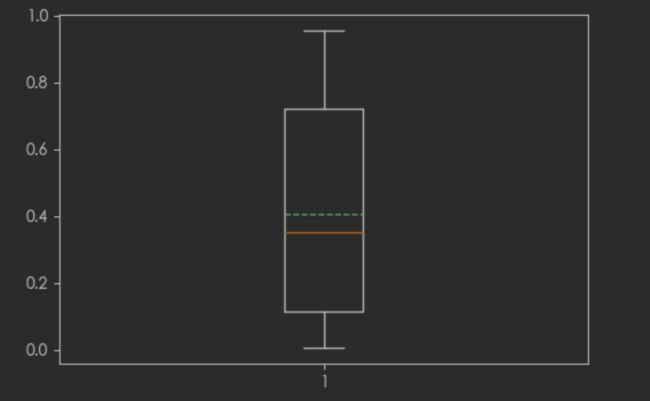
改变样式,例:
x = np.random.randint(10,100,size=(5,5))
box = {
    'linestyle':'--',
    'linewidth':1,
    'color':'blue'
}
mean = {
    'marker':'o',
    'markerfacecolor':'pink',
    'markersize':2
}
plt.boxplot(x,meanline=True,showmeans=True,labels=['A','B','C','D','E'],boxprops=box,meanprops=mean)

28. 次坐标轴
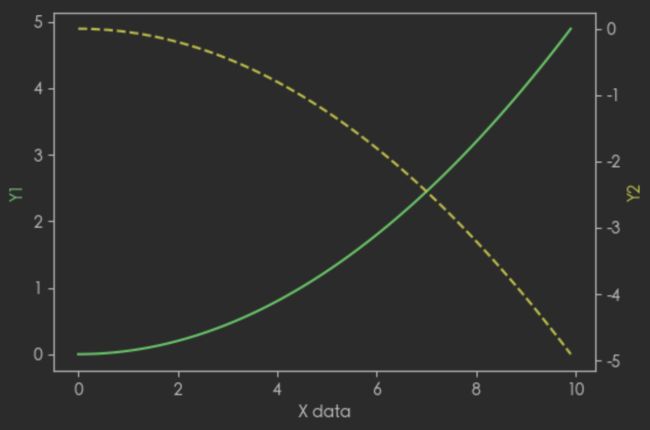
x = np.arange(0,10,0.1)
y1 = 0.05*x**2
y2 = -1*y1

fig = plt.figure()
ax1 = fig.add_subplot(1,1,1)

# 镜像 ax1 的数据
ax2 = ax1.twinx()
ax1.plot(x,y1,color='g',ls='-')
ax2.plot(x,y2,color='y',ls='--')

ax1.set_xlabel('X data')
ax1.set_ylabel('Y1',color='g')

ax2.set_ylabel('Y2',color='y')

plt.show()
29. Animation动画
import numpy as np
from matplotlib import pyplot as plt
from matplotlib import  animation

fig,ax = plt.subplots()

x = np.arange(0,2*np.pi,0.01)
line, = ax.plot(x,np.sin(x))

# 更新的方式
def animate(i):
    # i : frames
    line.set_ydata(np.sin(x+i/100))
    return line,

# 起始的状态
def init():
    line.set_ydata(np.sin(x))
    return line,

# frames 100个时间点
# interval 隔多久更新一次 单位毫秒
# bilt 是否更新整张图  还是只更新变化了的点
# True : 只更新变化了的     False : 更新整张图的点
ani = animation.FuncAnimation(fig=fig,func=animate,frames=100,init_func=init,interval=20,blit=True)

plt.show()

