机器学习实战-系列教程8:SVM分类实战3非线性SVM(鸢尾花数据集/软间隔/线性SVM/非线性SVM/scikit-learn框架)项目实战、代码解读
机器学习 实战系列 总目录
本篇文章的代码运行界面均在Pycharm中进行
本篇文章配套的代码资源已经上传
SVM分类实战1之简单SVM分类
SVM分类实战2线性SVM
SVM分类实战3非线性SVM
4、非线性SVM
4.1 创建非线性数据
from sklearn.datasets import make_moons
X, y = make_moons(n_samples=100, noise=0.15, random_state=42)

def plot_dataset(X, y, axes):
    plt.plot(X[:, 0][y==0], X[:, 1][y==0], "bs")
    plt.plot(X[:, 0][y==1], X[:, 1][y==1], "g^")
    plt.axis(axes)
    plt.grid(True, which='both')
    plt.xlabel(r"$x_1$", fontsize=20)
    plt.ylabel(r"$x_2$", fontsize=20, rotation=0)

plot_dataset(X, y, [-1.5, 2.5, -1, 1.5])
plt.show()
4.2 分类预测
from sklearn.datasets import make_moons
from sklearn.pipeline import Pipeline
from sklearn.preprocessing import PolynomialFeatures
polynomial_svm_clf=Pipeline((("poly_features",PolynomialFeatures(degree=3)),
                            ("scaler",StandardScaler()),
                            ("svm_clf",LinearSVC(C=10,loss="hinge"))
                            ))
polynomial_svm_clf.fit(X,y)
- 使用PolynomialFeatures模块进行预处理,使用这个可以增加数据维度
- polynomial_svm_clf.fit(X,y)对当前进行训练传进去X和y数据
def plot_predictions(clf,axes):
    x0s = np.linspace(axes[0],axes[1],100)
    x1s = np.linspace(axes[2],axes[3],100)
    x0,x1 = np.meshgrid(x0s,x1s)
    X = np.c_[x0.ravel(),x1.ravel()]
    y_pred = clf.predict(X).reshape(x0.shape)
    plt.contourf(x0,x1,y_pred,cmap=plt.cm.brg,alpha=0.2)

plot_predictions(polynomial_svm_clf,[-1.5,2.5,-1,1.5])
plot_dataset(X,y,[-1.5,2.5,-1,1.5])
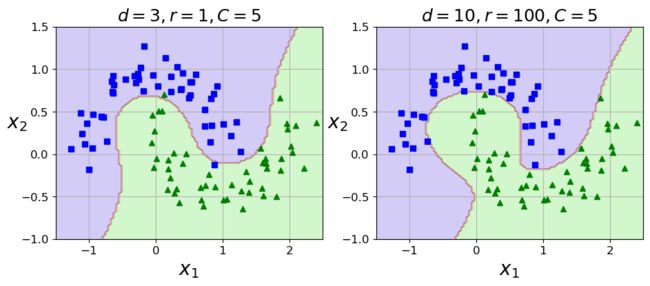
5、核函数
5.1 核函数
from sklearn.svm import SVC

poly_kernel_svm_clf = Pipeline([
        ("scaler", StandardScaler()),
        ("svm_clf", SVC(kernel="poly", degree=3, coef0=1, C=5))
    ])

poly_kernel_svm_clf.fit(X, y)
poly100_kernel_svm_clf = Pipeline([
        ("scaler", StandardScaler()),
        ("svm_clf", SVC(kernel="poly", degree=10, coef0=100, C=5))
    ])

poly100_kernel_svm_clf.fit(X, y)
plt.figure(figsize=(11, 4))

plt.subplot(121)
plot_predictions(poly_kernel_svm_clf, [-1.5, 2.5, -1, 1.5])
plot_dataset(X, y, [-1.5, 2.5, -1, 1.5])
plt.title(r"$d=3, r=1, C=5$", fontsize=18)

plt.subplot(122)
plot_predictions(poly100_kernel_svm_clf, [-1.5, 2.5, -1, 1.5])
plot_dataset(X, y, [-1.5, 2.5, -1, 1.5])
plt.title(r"$d=10, r=100, C=5$", fontsize=18)

plt.show()
5.2 高斯核函数
SVM分类实战1之简单SVM分类
SVM分类实战2线性SVM
SVM分类实战3非线性SVM


