OpenRisc-53-debugging the OpenRISC 1200
引言
Introduction
There are different ways of performing debugging depending on the "target" (the actual representation of the OpenRISC processor and platform.) Two main categories of target exist; physical targets such as FPGA or ASIC OpenRISC implementations, and simulated targets such as a low-level event-driven simulations of RTL models (using a simulator such as Icarus Verilog) or models with greater abstraction such as the OR1ksim architectural simulator.
We will focus on debugging with the GNU debugger , GDB, as the primary user interface. The "targets" that GDB connects to will somehow support GDB with a "stub" or a component that can understand and translate GDB commands into the appropriate commands for the target. Here is some more information about using gdb for software debugging.
The four currently supported targets for debugging are:
- Physical target (FPGA or ASIC)
- Event-driven simulation
- Cycle-accurate model simulation
- Architectural simulator
Debugging a physical target
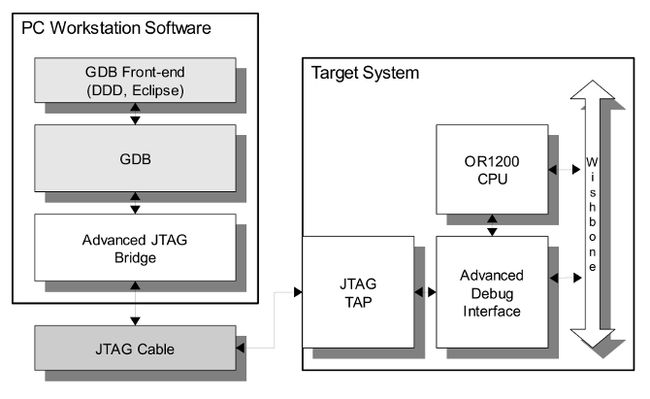
Physical implementations of OpenRISC systems can be debugged using a set of tools made available at OpenCores.org . Whether simply poking registers in IP cores or debugging complex software executing on the processor, these tools provide a useful debugging capability. The following block diagram gives a simplistic representation of the of the components involved in debugging a physical target.
JTAG TAP
The implementation of the Test Access Port (TAP) is fully IEEE 1149.1 compliant. It includes a TAP controller, a 4-bit instruction register and three test data registers: idcode register, bypass register and boundary scan register.
SoC debug interface
The Debug Interface is used for development purposes (debugging). It is an interface between the CPU(s), peripheral cores and any commercial debugger/emulator. The external debugger or BS tester connects to the core via JTAG port that is fully IEEE 1149.1 compatible. For that reason JTAG TAP needs to be used together with this core.
The GNU debugger
The GNU debugger, GDB, is a popular tool that is capable of debugging many architectures from many platforms. The OpenRISC port of GDB (or32-elf-gdb), is used as the primary debugging tool for all OpenRISC targets. It functions as, among other things, the actual user interface when debugging.
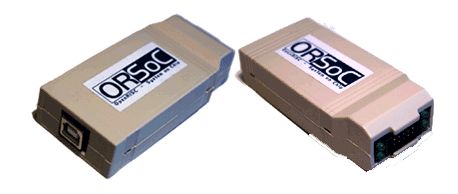
Using the ORSoC USB to JTAG debugger
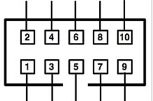
ORSoC has developed an USB to JTAG debugger , aimed at debugging OpenRISC based systems. One or more OpenRISC processors can be controlled over a JTAG interface. Additionally the debugger could be used to handle a serial connection for a console. Signal level on the JTAG is user configurable by use of an external voltage. The debugger is USB 1.1 compatible for easy connection to a host. A local proxy server handles the USB connection and offers a TCP connection to a software debugger. The GNU debugger with optional graphical user interface, such as DDD, is supported. It connects to the board under test with a ribbon cable. The cable has a 2×5 pin header with 0,1″ spacing using the following pinout:
| Pin | Connects To | Description |
| 1 | JTAG TCK | JTAG Test Clock |
| 2 | GND | Ground |
| 3 | JTAG TDO | JTAG Test Data Out |
| 4 | VCCIO JTAG | External Reference Voltage JTAG Port |
| 5 | JTAG TMS | JTAG Test Mode Select |
| 6 | VCCIO UART | External Reference Voltage UART |
| 7 | UART RX | UART Receive |
| 8 | UART TX | UART Transmitt |
| 9 | JTAG TDI | JTAG Test Data Input |
| 10 | GND | Ground |
Contact pin numbering
Connecting to the Atlys board
We will use the available Pmod connector on the Atlys board to connect the USB-JTAG debugger cable.The Pmod connector is a 2x6 right-angle, 100-mil female connector that mates with standard 2x6 pin headers available from a variety of catalog distributors. The 12-pin Pmod connector provides two VCC signals (pins 6 and 12), two Ground signals (pins 5 and 11), and eight logic signals. VCC and Ground pins can deliver up to 1A of current. Jumper JP12 selects the Pmod Vcc voltage (3.3V or 2.5V) in addition to selecting the VHDC voltage. Pmod data signals are not matched pairs, and they are routed using best-available tracks without impedance control or delay matching.
From the schematics.
Connecting the JTAG port to the Pmod connector
To physically connect the JTAG module input and output pins to the Pmod connector we will modify the atlys.ucf file. From the file orsoc_top.v we can find out the port names of the JTAG module.

Here is the modified atlys.ucf file. We put the TCK clock on a clock input pin (JA-CLK-P).
Reduild the design
We will rerun the complete design flow after the changes we have made. See: Using ORPSoC. Just remember to run: <make clean> before the new make commands.
Pmod to FPGA to JTAG debugger
The Pmod connector is connected to the follow pins on the Spartan-6 FPGA and the JTAG debugger.
| Pmod Connector | FPGA pin | JTAG Debugger |
| JA1 | T3 | 3 TDO |
| JA2 | R3 | 5 TMS |
| JA3 | P6 | 9 TDI |
| JA4 | N5 | |
| JA5 GND | 2 GND | |
| JA6 VCC | 4 VCC | |
| JA7 | V9 | |
| JA8 | T9 | 1 TCK |
| JA9 | V4 | |
| JA10 | T4 | |
| JA11 GND | ||
| JA12 VCC |
Building a connection board
We need to build a small board to connect the USB-JTAG ribbon cable to the Pmod contact. It looks like this:
The debug proxy
The debug proxy controls the link between GDB and the physical target. It implements a GDB stub, and provides support for most GDB commands. Physical connection to the board is made with the use of a USB debug cable. The ORSoC USB Debug Cable is one supported USB cable but there are other solutions. The proxy first establishes a connection with the target and stalls the processor. Next it waits for a connection with GDB via network sockets, and then begins translating received GDB commands into JTAG transactions with the debug interface via the USB cable. Transactions such as reading and writing registers, or downloading executables to memory are done through this interface. The OpenRISC Debug Proxy (or_debug_proxy) can be downloaded from the OpenRISC project's subversion repository using the following command:
svn co http://opencores.org/ocsvn/openrisc/openrisc/trunk/or_debug_proxy
The README included with the source provides detailed installation and usage instructions but a brief step-by-step guide for installation and compilation under Linux.
We can use a simple make to compile the program (or_debug_proxy). Before we compile the program we have to make sure the lftd2xx library is available. For more information read the README file.
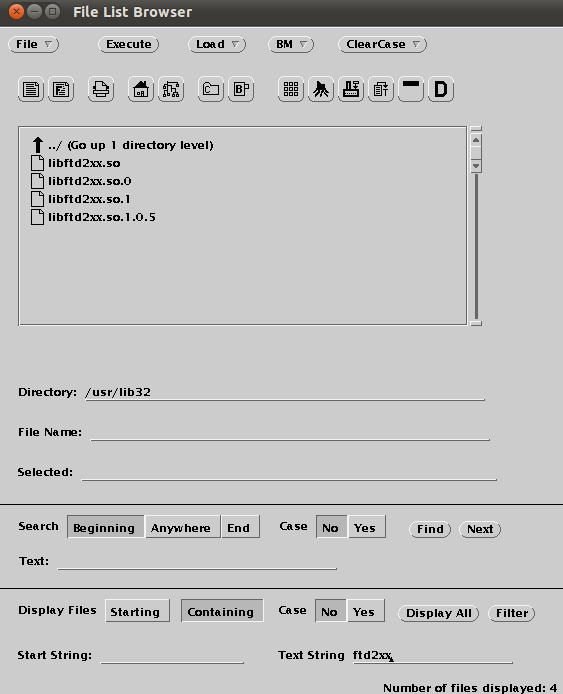
Downloading FTD2xx library
After failing to connect to the board I found out that the new version FTD2XX (1.0.5) did not work together with the or_debug_proxy. We have to download the old library (0.4.16) from the FTDI web page.
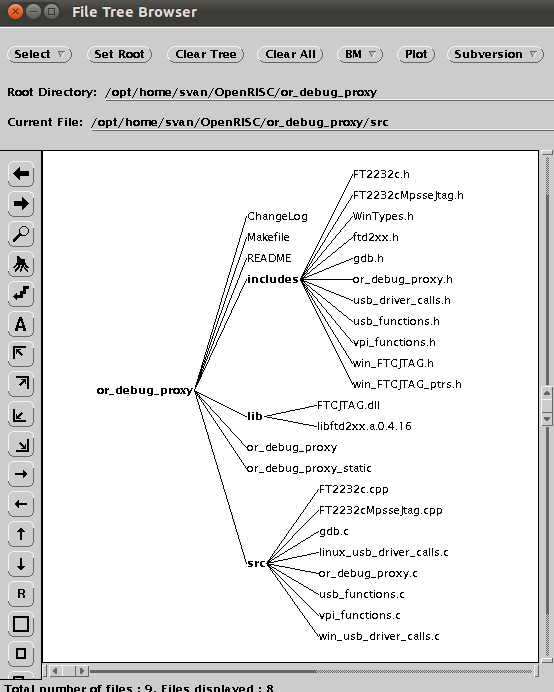
Compiling OpenRISC Debug Proxy
There are two ways to compile the proxy - one linked to the dynamic library, and one linked to the static library. There is no difference in performance or functionality, it is a little easier to compile against the static library as there are more steps involved to install the dynamic library. To compile the proxy application against the static library, simply go into the source directory and run a "make static", note that this requires the static driver library is located in the lib/ directory in the proxy source code.
Here are all the files involved.
Installation
The OR debug proxy application runs on multiple platforms only requiring slightly different driver configurations on each. Currently, Cygwin Windows, several Linux distros and Mac OS X (10.4 and above) are supported. Use with the ORSoC debug cable requires installation of some form of the FTDI Chip FTD2XX driver. It is required that the Linux distribution have a version 2.4 kernel, or above. This is due to the USB driver libraries by FTDI Chip used to interface with the USB debug device..
These USB to serial devices typically trigger the loading of another FTDI driver when they're attached to the system. This is the ftdi_sio driver and now comes standard in newer kernels. This is of use to us, as one of the two serial devices will remain is a standard UART under /dev/ttyUSBx. However, to enable a high-speed JTAG interface with our hardware we require newer, specialised drivers from FTDI called the D2XX drivers. As seen above they are already installed in our system.
ORSoC USB debug cable device permissions
To avoid having to run the proxy with sudo or as root user, permissions on the USB should be set permitting regular users access to the device. An example of setting the permissions on recent udev systems (almost all 2.6 kernel distributions use udev) is presented here. The ORSoC USB debug cable is identified from its USB vendor and product IDs (0x0403 and 0x6010, respectively) by the system when it is connected. Use the command lsusb to locate the connected USB-JTAG Debugger (Bus 005 Device 015).
We can insert a rule which allows user read and write permissions on this device when it is connected.This rule should be inserted in a file in the udev rules directory, /etc/udev/rules.d. It is easiest to create a new file, called 90-permissions.rules in the udev rules directory, which should contain the following:

Test this rule by unplugging and reconnecting the USB debug cable, and looking at the permissions of the two /dev/ttyUSB devices. The permissions should look like the following when listed with ls -l:
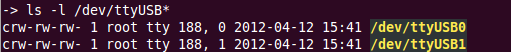
If the permissions do not have rw- in the final three characters, then the user is not able to access it. It is possible the rules file was not setup properly. Check the README for solutions to setting permissions on the cable for other platforms.
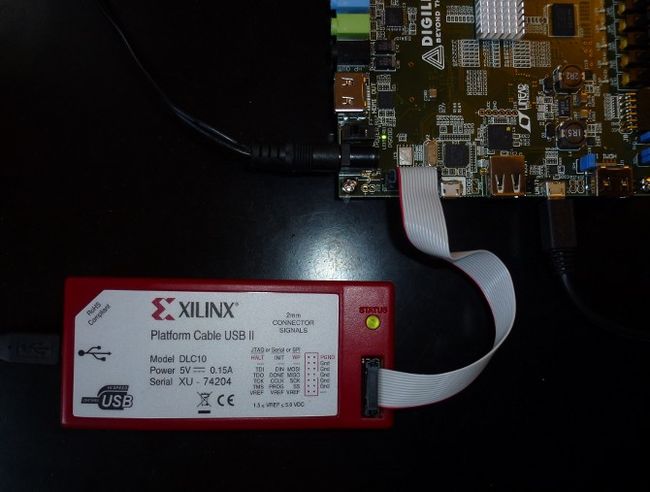
The final setup
Here is what the debug solution looks like.

Connecting to the target
Once the tools are setup, a connection to the system must be established. This connection occurs in two steps. The first step is to establish the connection between the proxy and the JTAG tap controller via the USB debug cable. Next, GDB connects to the proxy, and the debugging session can begin.
Connecting the proxy to the target
Connecting the proxy to the target is the first step to setting up the debugging chain. The proxy attempts to create the connection automatically when it is run. When the proxy is launched it automatically performs some actions, these are: reading of the JTAG TAP controller ID and check it's sensible, set the TAP to debug mode, stall the CPU, read back a few registers (PC, NPC, GPR1), and finally open a socket for the connection from GDB. The port for GDB to connect to is specified on the command line when launching the proxy with the -r option. In the following example port 55555 is used.
./or_debug_proxy -r 55555
Because we haven't connect the JTAG debugger to the Atlys board we get the following error message:
We will figure out how to connect to the board and make the small connection board. Is is fixed now. We have a debug connection with the Atlys board.
Connecting GDB to target
Once the proxy is running, the next step is connecting to the proxy from GNU Debugger GDB (or32-elf-gdb). Since GDB 6.8, communication between the proxy and GDB uses the remote serial protocol (RSP). The following commands show an example of starting GDB and connecting to the proxy. If the proxy is running on the same machine as GDB is being run on, then the following commands will work, otherwise substitute the IP of the machine running the proxy for localhost:
or32-elf-gdb
target remote localhost:55555
Compiling program for debugging
Use this command to compile the LEDtest.c program for debugging (-g option to generate debug information) :
or32-elf-gcc -g mboard=atlys LEDtest.c -o LEDtest.elf
Loading and running a program
Here are the commands to load and run a C-program (LEDtest.elf) from GDB.
file LEDtest.elf (Load symbol table)
load (Load program to target)
c (run program)

GDB connecting through RSP with target remote is connecting to a target which is already executing, but has stalled. Thus it is inappropriate to use the run command (which specifies a new program to run). Instead the continue and step commands are used. The load command will reset the program counter to the entry point of the program. So a subsequent continue will cause the newly loaded program to execute from its entry point.
Debugging OpenRISC with gdb
The document: "Debugging with gdb: the gnu Source-Level Debugger for gdb" can be read here.
The people at Embecosm Limited has written a manual called "Debugging the OpenRISC 1000 with GDB". This manual describes how to use GDB to debug C programs cross compiled for and running on processors using the OpenRISC 1000 architecture. In addition the info command is extended to allow inspection of OpenRISC 1000 Special Purpose registers, and a new command “spr” is added to set the value of a Special Purpose Register. See section OpenRISC 1000 Specific Commands.
All the normal GDB commands should work, although hardware watchpoints are not tested at present. The info registers command will show the 32 general purpose registers, while the info registers all command will add the program counter, supervision register and exception program counter registe For those who like their debugging graphical, the gdbtui command is available (or32-elf-gdbtui). GDB for OpenRISC 1000 can also be run under DDD as follows: ddd --debugger or32-elf-gdb
Debugging examples
Loading a program (LEDtest.exe) and single stepping the code:
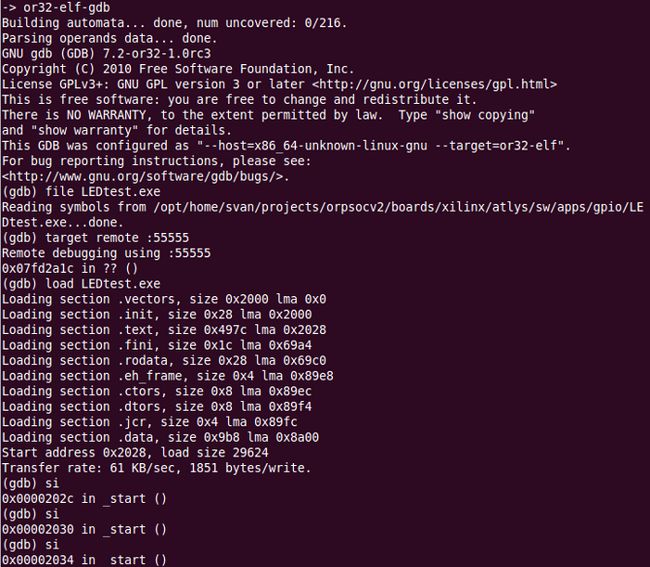
Displaying all the CPU's special purpose registers: info spr sys
Using Data Display Debugger DDD
DDD is a graphical front-end for command-line debuggers such as GDB, DBX, WDB, Ladebug, JDB, XDB, the Perl debugger, the bash debugger, or the Python debugger. DDD displays data structures as graphs and plots.Here is the User's Manual.
OpenOCD
OpenOCD is a program that we can use to talk to our debug interface on our hardware via JTAG, over a variety of cables, in a realtively flexible manner. We can script up things in TCL to control the system, or we can run a GDB RSP server and do things from GDB. OpenOCD will replace or_debug_proxy as the future debug interface.
The OpenOCD code with basic OpenRISC 1000 support is found on the openrisc.net git tree: git clone git://openrisc.net/julius/openocd
Using the advanced debug interface
There is also another solution available for debugging our board. It is called the advanced debug interface. To use this interface we have to modify our SOC design.
Connecting to the Atlys board
I don't have a solution today. If someone can provide me with one I would be more than happy. Can we use this box together with the Advanced Debug System?
We will find out next week. While we are waiting we can study the document " Debugging System for OpenRISC 1000-based Systems" written by Nathan Yawn.