DataMining-朴素贝叶斯Naive Bayesian
贝叶斯分类器是一种对于属性集X和类变量Y的概率关系建模的方法,其有两种实现方式:朴素贝叶斯和贝叶斯信念网络。本次首先介绍贝朴素叶斯,以及在R软件中的实现和注意事项。
一、朴素贝叶斯理论
要注意:
(1)对于连续型的属性集变量,可依照高斯分布即正态分布比较大小,或者利用和密度估计比较属性的两个取值的概率大小,在R软件中可以实现;
(2)m估计也称为贝叶斯估计(Baysian estimation),另外对于条件概率不为0的估计称为极大似然估计;
二、朴素贝叶斯R软件实现
需要用到的包有:klaR
install.packages("klaR")
library(klaR)
例子1:定性属性集常规方法
1、首先导入数据:文件computer.csv
computer <- read.csv("computer.csv",header=T);computer
查看数据:
> computer
           age income student credit_rating buys_computer
1        youth   high      no          fair            no
2        youth   high      no     excellent            no
3  middle-aged   high      no          fair           yes
4       senior medium      no          fair           yes
5       senior    low     yes          fair           yes
6       senior    low     yes     excellent            no
7  middle-aged    low     yes     excellent           yes
8        youth medium      no          fair            no
9        youth    low     yes          fair           yes
10      senior medium     yes          fair           yes
11       youth medium     yes     excellent           yes
12 middle-aged medium      no     excellent           yes
13 middle-aged   high     yes          fair           yes
14      senior medium      no     excellent            no
这是一个关于是否购买电脑的例子,有14个样本。
2、进行朴素贝叶斯分析:
NB <- NaiveBayes(buys_computer~., computer)
类似于回归分析,~前面表示因变量即这里的类变量,.表示所有的属性集,computer指定变量所在的数据集。
查看分析结果:(见代码后面的注释)
 1 > NB
 2 $apriori  #表示类变量的情况,有36%的人没有购买电脑,64%的人购买了电脑
 3 grouping
 4        no       yes
 5 0.3571429 0.6428571
 6
 7 $tables
 8 $tables$age
 9         var
10 grouping middle-aged    senior     youth
11      no    0.0000000 0.4000000 0.6000000         #在没有购买电脑的人中,年龄的分布
12      yes   0.4444444 0.3333333 0.2222222         #在购买的人中,年龄的分布
13
14 $tables$income
15         var
16 grouping      high       low    medium           # 收入的分布
17      no  0.4000000 0.2000000 0.4000000
18      yes 0.2222222 0.3333333 0.4444444
19
20 $tables$student
21         var
22 grouping        no       yes                    #是否是学生
23      no  0.8000000 0.2000000
24      yes 0.3333333 0.6666667
25
26 $tables$credit_rating                           #信用评分情况
27         var
28 grouping excellent      fair
29      no  0.6000000 0.4000000
30      yes 0.3333333 0.6666667
31
32
33 $levels                                         #类变量的水平,有两种
34 [1] "no"  "yes"
35
36 $call
37 NaiveBayes.default(x = X, grouping = Y)
38
39 $x
40            age income student credit_rating
41 1        youth   high      no          fair
42 2        youth   high      no     excellent
43 3  middle-aged   high      no          fair
44 4       senior medium      no          fair
45 5       senior    low     yes          fair
46 6       senior    low     yes     excellent
47 7  middle-aged    low     yes     excellent
48 8        youth medium      no          fair
49 9        youth    low     yes          fair
50 10      senior medium     yes          fair
51 11       youth medium     yes     excellent
52 12 middle-aged medium      no     excellent
53 13 middle-aged   high     yes          fair
54 14      senior medium      no     excellent
55
56 $usekernel                                          #是否利用核密度估计,没有
57 [1] FALSE
58
59 $varnames                                           #变量的名称
60 [1] "age"           "income"        "student"       "credit_rating"
61
62 attr(,"class")
63 [1] "NaiveBayes"
查看混淆矩阵,即利用建立的模型,预测分裂,得到列联表:
1 > pre1 <- predict(NB,computer[,-5])
2 > table(computer[,5],pre1$class)
3
4       no yes
5   no   4   1
6   yes  0   9
可以看到,有一个样本预测出错。
3、计算错判率及其区间估计:
> error <- sum(as.numeric(as.numeric(pre1$class)!=as.numeric(computer[,5])))/nrow(computer)
> error
[1] 0.07142857
可以计算错判率的区间估计:
> alpha <- 0.95
> z <- qnorm(1-(1-alpha)/2)
> n <- nrow(computer)          #样本数量
> CI.Upper <- (error+z^2/2/n+z*sqrt(error/n-error^2/n+z^2/4/n^2))/(1+z^2/n)
> CI.Lower <- (error+z^2/2/n-z*sqrt(error/n-error^2/n+z^2/4/n^2))/(1+z^2/n)
> c(CI.Lower,CI.Upper)
[1] 0.01272222 0.31468704
这里设定置信区间的置信水平为95%,得到错判率的区间估计。
4、预测
> newX <- data.frame(age="youth",income="medium",student="yes",credit_rating="fair")
> predict(NB,newX)#这个预测是错误的?Why?
$class
[1] yes
Levels: no yes

$posterior
              no       yes
[1,] 0.009626431 0.9903736
这里对于新值预测的结果现实,会购买电脑的概率为99%,但是这与人工计算的结果是不一致的。可以查看一下newX的属性:
> str(newX)
'data.frame':    1 obs. of  4 variables:
 $ age          : Factor w/ 1 level "youth": 1
 $ income       : Factor w/ 1 level "medium": 1
 $ student      : Factor w/ 1 level "yes": 1
 $ credit_rating: Factor w/ 1 level "fair": 1
结果显示,newX的各个自变量只有一个属性,这显然与原来的数据是不一致的。
利用以下方法可以避免这种错误:
> computer2 <- computer
> computer2[15,1]="youth"
> computer2[15,2]="medium"
> computer2[15,3]="yes"
> computer2[15,4]="fair"
> newX2 <- computer2[15,-5]
> predict(NB,newX2)#这个预测是正确的!
$class
 15
yes
Levels: no yes

$posterior
          no       yes
15 0.1954948 0.8045052
将新的样本插入到原来样本中,然后再取出这一样本,可以得到正确的预测结果,查看这个时候新的样本属性:
> str(newX2)
'data.frame':    1 obs. of  4 variables:
 $ age          : Factor w/ 3 levels "middle-aged",..: 3
 $ income       : Factor w/ 3 levels "high","low","medium": 3
 $ student      : Factor w/ 2 levels "no","yes": 2
 $ credit_rating: Factor w/ 2 levels "excellent","fair": 2
例子2:定性属性集-Laplace Smooothing方法稍后解释
参数fL=1表示利用了Laplace Smooothing
> NB2 <- NaiveBayes(buys_computer~., computer,fL=1)
> NB2$tables$age
        var
grouping middle-aged    senior youth
     no    0.1250000 0.3750000  0.50
     yes   0.4166667 0.3333333  0.25
> NB$tables$age
        var
grouping middle-aged    senior     youth
     no    0.0000000 0.4000000 0.6000000
     yes   0.4444444 0.3333333 0.2222222
> pre2 <- predict(NB2,computer[,-5])
> table(computer[,5],pre2$class) #混淆矩阵

      no yes
  no   4   1
  yes  0   9
> predict(NB2,newX2)
$class
 15
yes
Levels: no yes

$posterior
          no       yes
15 0.2321714 0.7678286

> NB2 <- NaiveBayes(buys_computer~., computer,fL=1)
> NB2$tables$age
        var
grouping middle-aged    senior youth
     no    0.1250000 0.3750000  0.50
     yes   0.4166667 0.3333333  0.25
> NB$tables$age
        var
grouping middle-aged    senior     youth
     no    0.0000000 0.4000000 0.6000000
     yes   0.4444444 0.3333333 0.2222222
> pre2 <- predict(NB2,computer[,-5])
> table(computer[,5],pre2$class) #混淆矩阵

      no yes
  no   4   1
  yes  0   9
> predict(NB2,newX2)
$class
 15
yes
Levels: no yes

$posterior
          no       yes
15 0.2321714 0.7678286
例子3:含定量属性集常规方法
导入数据:
> golf <- read.csv("golf.csv",header=T)
> golf
    Outlook Temperature Humidity Windy Play
1     Sunny          85       85 false   no
2     Sunny          80       90  true   no
3  Overcast          83       86 false  yes
4     Rainy          70       96 false  yes
5     Rainy          68       80 false  yes
6     Rainy          65       70  true   no
7  Overcast          64       65  true  yes
8     Sunny          72       95 false   no
9     Sunny          69       70 false  yes
10    Rainy          75       80 false  yes
11    Sunny          75       70  true  yes
12 Overcast          72       90  true  yes
13 Overcast          81       75 false  yes
14    Rainy          71       91  true   no
利用属性集中的定量变量Temperature和Humidity进行:
> NB.golf <- NaiveBayes(Play~Temperature+Humidity, golf)
> NB.golf
$apriori
grouping
       no       yes
0.3571429 0.6428571

$tables                  #这里给出的是在是否打球类别下,这些样本关于两个变量的均值和方差
$tables$Temperature
    [,1]     [,2]
no  74.6 7.893035
yes 73.0 6.164414

$tables$Humidity
        [,1]      [,2]
no  86.20000  9.731393
yes 79.11111 10.215729


$levels
[1] "no"  "yes"

$call
NaiveBayes.default(x = X, grouping = Y)

$x
   Temperature Humidity
1           85       85
2           80       90
3           83       86
4           70       96
5           68       80
6           65       70
7           64       65
8           72       95
9           69       70
10          75       80
11          75       70
12          72       90
13          81       75
14          71       91

$usekernel
[1] FALSE

$varnames
[1] "Temperature" "Humidity"

attr(,"class")
[1] "NaiveBayes"
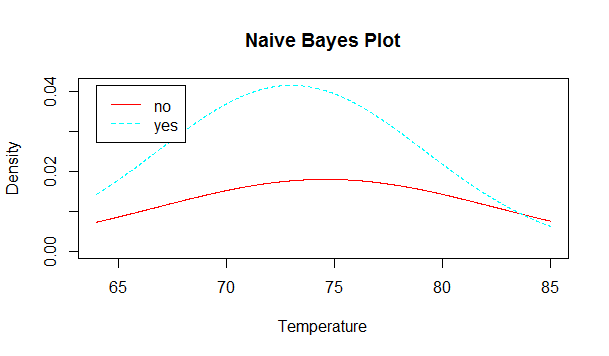
可以画出在两个类别下温度和湿度的分布曲线:
plot(NB.golf,vars="Temperature")
plot(NB.golf,vars="Humidity")
2、查看预测结果
> pre.golf <- predict(NB.golf,golf[,2:3])
> table(golf[,5],pre.golf$class) #混淆矩阵

      no yes
  no   2   3
  yes  2   7
可以看到,错误率还是比较高的
3、使用核密度估计
NB.golf2 <- NaiveBayes(Play~Temperature+Humidity, golf,usekernel=T)
注意:tables中给出的是Temperature和Humidity在各类下的分位数值及其对应的密度值
> plot(NB.golf2,vars="Temperature") #与直方图相似
> plot(NB.golf2,vars="Humidity") #与直方图相似
> pre.golf2 <- predict(NB.golf2,golf[,2:3])
> table(golf[,5],pre.golf2$class) #混淆矩阵

no yes
no 4 1
yes 1 8
可以看出,错误率明显减小了


