ISLR第三章线性回归应用练习题答案(上)
ISLR;R语言; 机器学习 ;线性回归
一些专业词汇只知道英语的,中文可能不标准,请轻喷
8.利用简单的线性回归处理Auto数据集
    library(MASS)
    library(ISLR)
    library(car)
    Auto=read.csv("Auto.csv",header=T,na.strings="?")
    Auto=na.omit(Auto)
    attach(Auto)
    summary(Auto)
输出结果:
        mpg          cylinders      displacement     horsepower
   Min.   : 9.00   Min.   :3.000   Min.   : 68.0   Min.   : 46.0
   1st Qu.:17.00   1st Qu.:4.000   1st Qu.:105.0   1st Qu.: 75.0
   Median :22.75   Median :4.000   Median :151.0   Median : 93.5
   Mean   :23.45   Mean   :5.472   Mean   :194.4   Mean   :104.5
   3rd Qu.:29.00   3rd Qu.:8.000   3rd Qu.:275.8   3rd Qu.:126.0
   Max.   :46.60   Max.   :8.000   Max.   :455.0   Max.   :230.0

       weight      acceleration        year           origin
   Min.   :1613   Min.   : 8.00   Min.   :70.00   Min.   :1.000
   1st Qu.:2225   1st Qu.:13.78   1st Qu.:73.00   1st Qu.:1.000
   Median :2804   Median :15.50   Median :76.00   Median :1.000
   Mean   :2978   Mean   :15.54   Mean   :75.98   Mean   :1.577
   3rd Qu.:3615   3rd Qu.:17.02   3rd Qu.:79.00   3rd Qu.:2.000
   Max.   :5140   Max.   :24.80   Max.   :82.00   Max.   :3.000

                   name
   amc matador       :  5
   ford pinto        :  5
   toyota corolla    :  5
   amc gremlin       :  4
   amc hornet        :  4
   chevrolet chevette:  4
   (Other)           :365
线性回归:
    lm.fit=lm(mpg~horsepower)
    summary(lm.fit)
输出结果:
 Call:
 lm(formula = mpg ~ horsepower)

 Residuals:
     Min       1Q   Median       3Q      Max
 -13.5710  -3.2592  -0.3435   2.7630  16.9240

Coefficients:
             Estimate Std. Error t value Pr(>|t|)
 (Intercept) 39.935861   0.717499   55.66   <2e-16 ***
 horsepower  -0.157845   0.006446  -24.49   <2e-16 ***
 ---
 Signif. codes:  0 ‘\*\*\*’ 0.001 ‘\*\*’ 0.01 ‘\*’ 0.05 ‘.’ 0.1 ‘ ’ 1

 Residual standard error: 4.906 on 390 degrees of freedom
 Multiple R-squared:  0.6059,    Adjusted R-squared:  0.6049
 F-statistic: 599.7 on 1 and 390 DF,  p-value: < 2.2e-16
a)
- 零假设 H 0:βhorsepower=0,假设horsepower与mpg不相关。
由于F-statistic值远大于1,p值接近于0,拒绝原假设,则horsepower和mpg具有统计显著关系。 - mpg的平均值为23.45,线性回归的RSE为4.906,有20.9248%的相对误差。R-squared为0.6059,说明60.5948%的mpg可以被horsepower解释。
- 线性回归系数小于零,说明mpg与horsepower之间的关系是消极的。
预测mpg
predict(lm.fit,data.frame(mpg=c(98)),interval="prediction")
Warning message:
'newdata'必需有1行 但变量里有392行
修改办法:
  predictor=mpg
  response=horsepower
  lm.fit2=lm(predictor~response)
  predict(lm.fit2,data.frame(response=c(98)),interval="confidence")
      fit   lwr   upr
  1 24.47 23.97 24.96
  predict(lm.fit2,data.frame(response=c(98)),interval="prediction")
       fit     lwr      upr
  1 24.46708 14.8094 34.12476
b)绘制mpg与horsepower散点图和最小二乘直线
    plot(response,predictor)
    abline(lm.fit2,lwd=3,col="red")
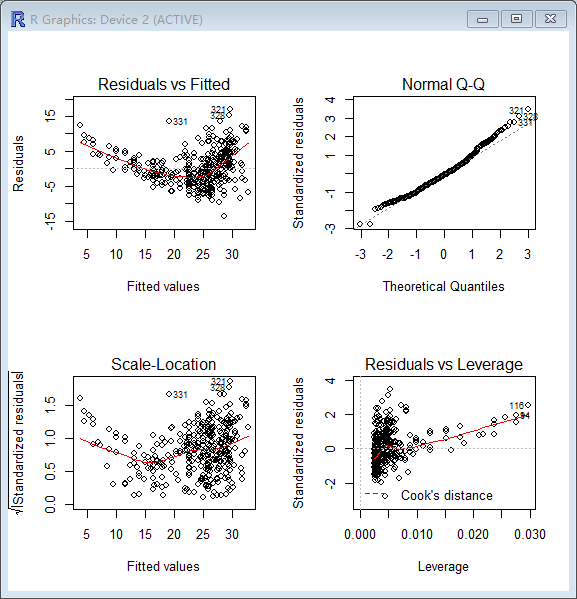
par(mfrow=c(2,2))
plot(lm.fit2)
9.利用联合的线性回归处理Auto数据集
a)绘制散点图矩阵
pairs(Auto)
 cor(subset(Auto,select=-name))

                      mpg  cylinders displacement horsepower     weight
  mpg           1.0000000 -0.7776175   -0.8051269 -0.7784268 -0.8322442
  cylinders    -0.7776175  1.0000000    0.9508233  0.8429834  0.8975273
  displacement -0.8051269  0.9508233    1.0000000  0.8972570  0.9329944
  horsepower   -0.7784268  0.8429834    0.8972570  1.0000000  0.8645377
  weight       -0.8322442  0.8975273    0.9329944  0.8645377  1.0000000
  acceleration  0.4233285 -0.5046834   -0.5438005 -0.6891955 -0.4168392
  year          0.5805410 -0.3456474   -0.3698552 -0.4163615 -0.3091199
  origin        0.5652088 -0.5689316   -0.6145351 -0.4551715 -0.5850054
               acceleration       year     origin
  mpg             0.4233285  0.5805410  0.5652088
  cylinders      -0.5046834 -0.3456474 -0.5689316
  displacement   -0.5438005 -0.3698552 -0.6145351
  horsepower     -0.6891955 -0.4163615 -0.4551715
  weight         -0.4168392 -0.3091199 -0.5850054
  acceleration    1.0000000  0.2903161  0.2127458
  year            0.2903161  1.0000000  0.1815277
  origin          0.2127458  0.1815277  1.0000000
c)多元线性回归:
lm.fit3=lm(mpg~.-name,data=Auto)
summary(lm.fit3)

Call:
lm(formula = mpg ~ . - name, data = Auto)

Residuals:
    Min      1Q  Median      3Q     Max
-9.5903 -2.1565 -0.1169  1.8690 13.0604

 Coefficients:
                 Estimate Std. Error t value Pr(>|t|)
  (Intercept)  -17.218435   4.644294  -3.707  0.00024 ***
  cylinders     -0.493376   0.323282  -1.526  0.12780
  displacement   0.019896   0.007515   2.647  0.00844 **
  horsepower    -0.016951   0.013787  -1.230  0.21963
  weight        -0.006474   0.000652  -9.929  < 2e-16 ***
  acceleration   0.080576   0.098845   0.815  0.41548
  year           0.750773   0.050973  14.729  < 2e-16 ***
  origin         1.426141   0.278136   5.127 4.67e-07 ***
  ---
  Signif. codes:  0 ‘***’ 0.001 ‘**’ 0.01 ‘*’ 0.05 ‘.’ 0.1 ‘ ’ 1

  Residual standard error: 3.328 on 384 degrees of freedom
  Multiple R-squared:  0.8215,    Adjusted R-squared:  0.8182
  F-statistic: 252.4 on 7 and 384 DF,  p-value: < 2.2e-16
- 零假设 :假设mpg与其他变量不相关。
由于F-statistic值远大于1,p值接近于0,拒绝原假设,则mpg与其他变量具有统计显著关系。 - 参照每个变量的P值,displacement、weight 、year 、origin在统计显著关系。
- 汽车对于能源的利用率逐年增长
d)
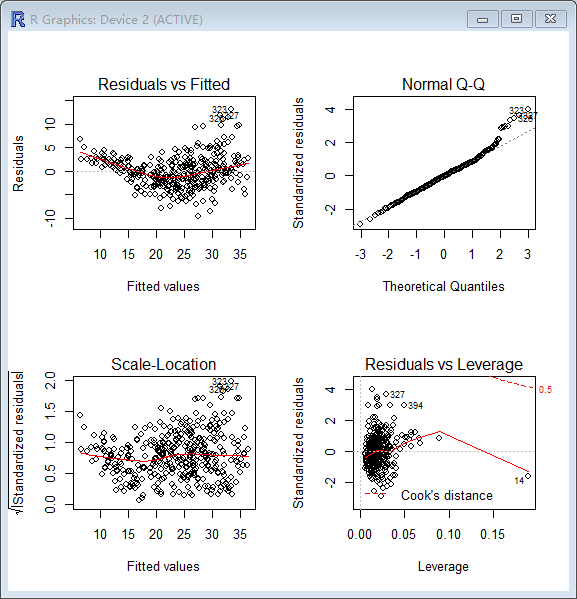
  par(mfrow=c(2,2))
  plot(lm.fit3)
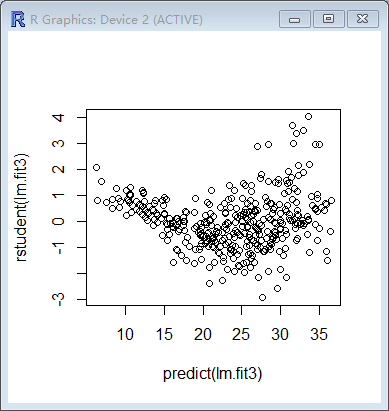
plot(predict(lm.fit3), rstudent(lm.fit3))
lm.fit4=lm(mpg~displacement*weight+year*origin)
summary(lm.fit4)
运行结果:
  Call:
  lm(formula = mpg ~ displacement * weight + year * origin)

  Residuals:
      Min      1Q  Median      3Q     Max
  -9.5758 -1.6211 -0.0537  1.3264 13.3266

  Coefficients:
                        Estimate Std. Error t value Pr(>|t|)
  (Intercept)          1.793e+01  8.044e+00   2.229 0.026394 *
  displacement        -7.519e-02  9.091e-03  -8.271 2.19e-15 ***
  weight              -1.035e-02  6.450e-04 -16.053  < 2e-16 ***
  year                 4.864e-01  1.017e-01   4.782 2.47e-06 ***
  origin              -1.503e+01  4.232e+00  -3.551 0.000432 ***
  displacement:weight  2.098e-05  2.179e-06   9.625  < 2e-16 ***
  year:origin          1.980e-01  5.436e-02   3.642 0.000308 ***
  ---
  Signif. codes:  0 ‘***’ 0.001 ‘**’ 0.01 ‘*’ 0.05 ‘.’ 0.1 ‘ ’ 1

  Residual standard error: 2.969 on 385 degrees of freedom
  Multiple R-squared:  0.8575,    Adjusted R-squared:  0.8553
  F-statistic: 386.2 on 6 and 385 DF,  p-value: < 2.2e-16
可以发现具有统计显著关系,残差也有很大的下降。
f)
lm.fit5 = lm(mpg~log(horsepower)+sqrt(horsepower)+horsepower+I(horsepower^2))
summary(lm.fit5)
运行结果:
  Call:
  lm(formula = mpg ~ log(horsepower) + sqrt(horsepower) + horsepower +
I(horsepower^2))

  Residuals:
       Min       1Q   Median       3Q      Max
  -15.3450  -2.4725  -0.1594   2.1068  16.2564

  Coefficients:
                     Estimate Std. Error t value Pr(>|t|)
  (Intercept)      -6.839e+02  2.439e+02  -2.804  0.00530 **
  log(horsepower)   6.515e+02  2.111e+02   3.085  0.00218 **
  sqrt(horsepower) -3.385e+02  1.092e+02  -3.101  0.00207 **
  horsepower        1.165e+01  3.898e+00   2.988  0.00299 **
  I(horsepower^2)  -7.425e-03  2.796e-03  -2.655  0.00825 **
  ---
  Signif. codes:  0 ‘***’ 0.001 ‘**’ 0.01 ‘*’ 0.05 ‘.’ 0.1 ‘ ’ 1

  Residual standard error: 4.331 on 387 degrees of freedom
  Multiple R-squared:  0.6952,    Adjusted R-squared:  0.692
  F-statistic: 220.6 on 4 and 387 DF,  p-value: < 2.2e-16
诊断回归:
  par(mfrow=c(2,2))
  plot(lm.fit5)
10.Carseats数据集
a)
summary(Carseats)
运行结果:
     Sales          CompPrice       Income        Advertising
   Min.   : 0.000   Min.   : 77   Min.   : 21.00   Min.   : 0.000
   1st Qu.: 5.390   1st Qu.:115   1st Qu.: 42.75   1st Qu.: 0.000
   Median : 7.490   Median :125   Median : 69.00   Median : 5.000
   Mean   : 7.496   Mean   :125   Mean   : 68.66   Mean   : 6.635
   3rd Qu.: 9.320   3rd Qu.:135   3rd Qu.: 91.00   3rd Qu.:12.000
   Max.   :16.270   Max.   :175   Max.   :120.00   Max.   :29.000
     Population        Price        ShelveLoc        Age          Education
   Min.   : 10.0   Min.   : 24.0   Bad   : 96   Min.   :25.00   Min.   :10.0
   1st Qu.:139.0   1st Qu.:100.0   Good  : 85   1st Qu.:39.75   1st Qu.:12.0
   Median :272.0   Median :117.0   Medium:219   Median :54.50         Median :14.0
   Mean   :264.8   Mean   :115.8                Mean   :53.32   Mean   :13.9
   3rd Qu.:398.5   3rd Qu.:131.0                3rd Qu.:66.00   3rd Qu.:16.0
   Max.   :509.0   Max.   :191.0                Max.   :80.00   Max.   :18.0
   Urban       US
   No :118   No :142
   Yes:282   Yes:258
多元线性回归:
  attach(Carseats)
  lm.fit=lm(Sales~Price+Urban+US)
  summary(lm.fit)
运行结果:
  Call:
  lm(formula = Sales ~ Price + Urban + US)

  Residuals:
      Min      1Q  Median      3Q     Max
  -6.9206 -1.6220 -0.0564  1.5786  7.0581

  Coefficients:
               Estimate Std. Error t value Pr(>|t|)
  (Intercept) 13.043469   0.651012  20.036  < 2e-16 ***
  Price       -0.054459   0.005242 -10.389  < 2e-16 ***
  UrbanYes    -0.021916   0.271650  -0.081    0.936
  USYes        1.200573   0.259042   4.635 4.86e-06 ***
  ---
  Signif. codes:  0 ‘***’ 0.001 ‘**’ 0.01 ‘*’ 0.05 ‘.’ 0.1 ‘ ’ 1

  Residual standard error: 2.472 on 396 degrees of freedom
  Multiple R-squared:  0.2393,    Adjusted R-squared:  0.2335
  F-statistic: 41.52 on 3 and 396 DF,  p-value: < 2.2e-16
b)
随着价格的升高销量下降
商场是否在郊区与销量无关
商场在美国销量会更多
c)Sales = 13.04 + -0.05 Price + -0.02 UrbanYes + 1.20 USYes
d)Priece和USYES可以,根据p值和F-statistic可以拒绝零假设。
e)
lm.fit2=lm(Sales~Price+US)
summary(lm.fit2)
输出结果:
  Call:
  lm(formula = Sales ~ Price + US)

  Residuals:
      Min      1Q  Median      3Q     Max
  -6.9269 -1.6286 -0.0574  1.5766  7.0515

  Coefficients:
              Estimate Std. Error t value Pr(>|t|)
  (Intercept) 13.03079    0.63098  20.652  < 2e-16 ***
  Price       -0.05448    0.00523 -10.416  < 2e-16 ***
  USYes        1.19964    0.25846   4.641 4.71e-06 ***
  ---
  Signif. codes:  0 ‘***’ 0.001 ‘**’ 0.01 ‘*’ 0.05 ‘.’ 0.1 ‘ ’ 1

  Residual standard error: 2.469 on 397 degrees of freedom
  Multiple R-squared:  0.2393,    Adjusted R-squared:  0.2354
  F-statistic: 62.43 on 2 and 397 DF,  p-value: < 2.2e-16
f)a)和e)RSE相近,但是e)稍微好一点
g)
confint(lm.fit2)
输出结果:
                    2.5 %      97.5 %
  (Intercept) 11.79032020 14.27126531
  Price       -0.06475984 -0.04419543
  USYes        0.69151957  1.70776632
h)
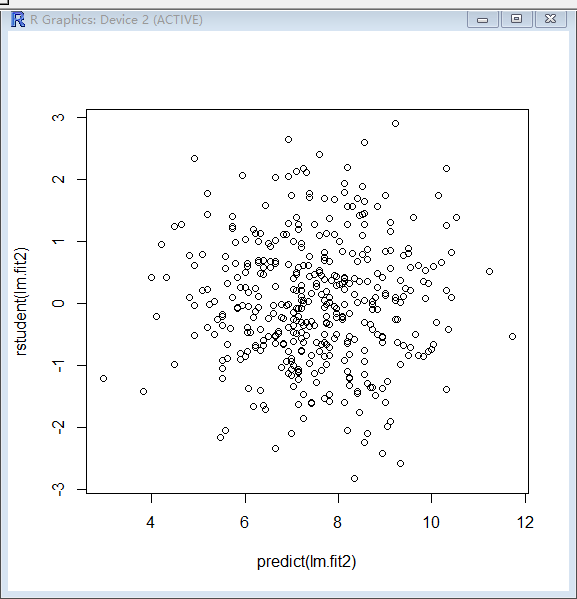
plot(predict(lm.fit2),rstudent(lm.fit2))
输出结果
  par(mfrow=c(2,2))
  plot(lm.fit2)
11.研究t-statistic
  lm.fit=lm(y~x+0)
  summary(lm.fit)
输出结果:
  Call:
  lm(formula = y ~ x + 0)

  Residuals:
       Min       1Q   Median       3Q      Max
  -2.92110 -0.43210  0.04155  0.67849  2.64495

  Coefficients:
    Estimate Std. Error t value Pr(>|t|)
  x   1.9454     0.1083   17.96   <2e-16 ***
  ---
  Signif. codes:  0 ‘***’ 0.001 ‘**’ 0.01 ‘*’ 0.05 ‘.’ 0.1 ‘ ’ 1

  Residual standard error: 1.033 on 99 degrees of freedom
  Multiple R-squared:  0.7651,    Adjusted R-squared:  0.7627
  F-statistic: 322.4 on 1 and 99 DF,  p-value: < 2.2e-16
p值接近0,拒绝零假设
b)
  lm.fit2=lm(x~y+0)
  summary(lm.fit2)
输出结果:
  Call:
  lm(formula = x ~ y + 0)

  Residuals:
       Min       1Q   Median       3Q      Max
  -1.05835 -0.30952 -0.01945  0.34313  1.15854

  Coefficients:
    Estimate Std. Error t value Pr(>|t|)
  y   0.3933     0.0219   17.96   <2e-16 ***
  ---
  Signif. codes:  0 ‘***’ 0.001 ‘**’ 0.01 ‘*’ 0.05 ‘.’ 0.1 ‘ ’ 1

  Residual standard error: 0.4646 on 99 degrees of freedom
  Multiple R-squared:  0.7651,    Adjusted R-squared:  0.7627
  F-statistic: 322.4 on 1 and 99 DF,  p-value: < 2.2e-16
同样p值接近0,拒绝零假设
c)a)和b)拟合的是同一条直线
d)
e)x与y地位相当,交换x,y位置t结果不变
f)
lm.fit3=lm(x~y)
summary(lm.fit3)
输出结果:
  Call:
  lm(formula = x ~ y)

  Residuals:
      Min      1Q  Median      3Q     Max
  -1.0381 -0.2899  0.0005  0.3628  1.1782

  Coefficients:
              Estimate Std. Error t value Pr(>|t|)
  (Intercept) -0.01975    0.04667  -0.423    0.673
  y            0.39308    0.02200  17.868   <2e-16 ***
  ---
  Signif. codes:  0 ‘***’ 0.001 ‘**’ 0.01 ‘*’ 0.05 ‘.’ 0.1 ‘ ’ 1

  Residual standard error: 0.4666 on 98 degrees of freedom
  Multiple R-squared:  0.7651,    Adjusted R-squared:  0.7627
  F-statistic: 319.3 on 1 and 98 DF,  p-value: < 2.2e-16
x对y线性回归
  lm.fit4=lm(y~x)
  summary(lm.fit4)
输出结果:
  Call:
  lm(formula = y ~ x)

  Residuals:
       Min       1Q   Median       3Q      Max
  -2.94807 -0.46147  0.01291  0.65020  2.61739

  Coefficients:
              Estimate Std. Error t value Pr(>|t|)
  (Intercept)  0.02765    0.10391   0.266    0.791
  x            1.94651    0.10894  17.868   <2e-16 ***
  ---
  Signif. codes:  0 ‘***’ 0.001 ‘**’ 0.01 ‘*’ 0.05 ‘.’ 0.1 ‘ ’ 1

  Residual standard error: 1.038 on 98 degrees of freedom
  Multiple R-squared:  0.7651,    Adjusted R-squared:  0.7627
  F-statistic: 319.3 on 1 and 98 DF,  p-value: < 2.2e-16
发现t值不变


