R语言绘图学习笔记
在做数据分析时,我们通常作的举动就是画散点图分析。因为通过散点图的分析,我们可以最直观,最简单的得出大概的结论。今天我分享的内容就是R语言的绘图函数。
关于R语言强大的绘图功能,我们可以通过函数demo(graphics),demo(persp)来见识R带给我们的绘图便利。
一、数据的初步分析
我们对数据的初步分析常用的图像有:散点图、直方图、茎叶图、箱线图。对于时间序列,散点图,acf图,pacf图,残差图更是数据分析、建模的有利帮手。
先介绍创建图像的函数plot()的用法:
Plot(x,y…):x(在x轴上)与y(在y轴上)的二元作图,如果缺省x,x视为y的序列标号
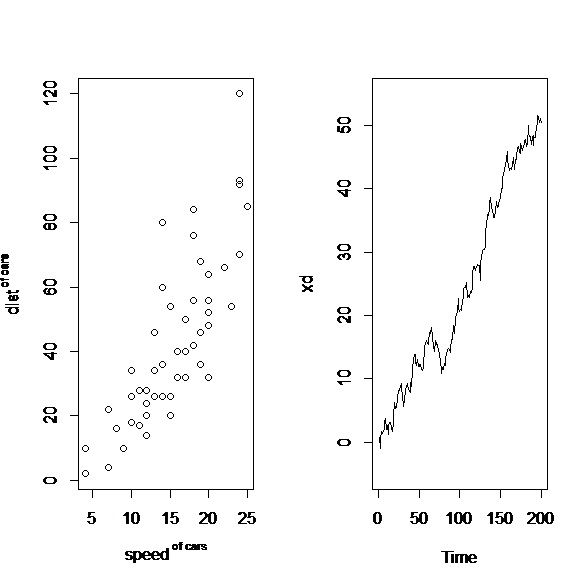
我们以截面数据(R中自带数据集cars为例,看看散点图的做法)
plot(cars$speed,cars$dist, xlab = expression(speed^" of cars"), ylab =expression(dist^" of cars"))#从图中我们可以看到线性相关,从而可以考虑对这两个变量做回归分析
我们以随机游走序列为例也来看一个时间序列图:
set.seed(154)#用途是给定伪随机数的seed,在同样的seed下,R生成的伪随机数序列是相同的。
w<-rnorm(200)
x<-cumsum(w)#累计求和,seeexample:cumsum(1:!0)
wd<-w+0.2
xd<-cumsum(wd)
plot.ts(xd,ylim=c(-5,55))
我们可以看到如下图像:
对于一些需要猜测分布截面数据,没有比直方图更适合的了。我们通常使用函数hist()。用法如下:
hist(x, breaks = "Sturges",
freq = NULL, probability = !freq,
include.lowest = TRUE, right = TRUE,
density = NULL, angle = 45, col = NULL, border = NULL,
main = paste("Histogram of" , xname),
xlim = range(breaks), ylim = NULL,
xlab = xname, ylab,
axes = TRUE, plot = TRUE, labels = FALSE,
nclass = NULL, warn.unused = TRUE, ...)
我们来看看模拟二项分布所得的数据的画出的直方图:
x<-rbinom(100000,100,0.9)
hist(x)
通常对于大规模的数据,了解其分布也是需要的,我们常用箱线图来描述,还是使用上面的模拟数据x,有boxplot(x).两个函数得到的图:
对于小规模数据,茎叶图也是常被使用的。R中的stem函数可以完成它。Stem函数用法:stem(x, scale = 1, width = 80, atom = 1e-08)
>stem(log10(islands))#对于R的数据集islands取常用对数得到的茎叶图.
The decimal point is at the |
1 | 1111112222233444
1 | 5555556666667899999
2 | 3344
2 | 59
3 |
3 | 5678
4 | 012
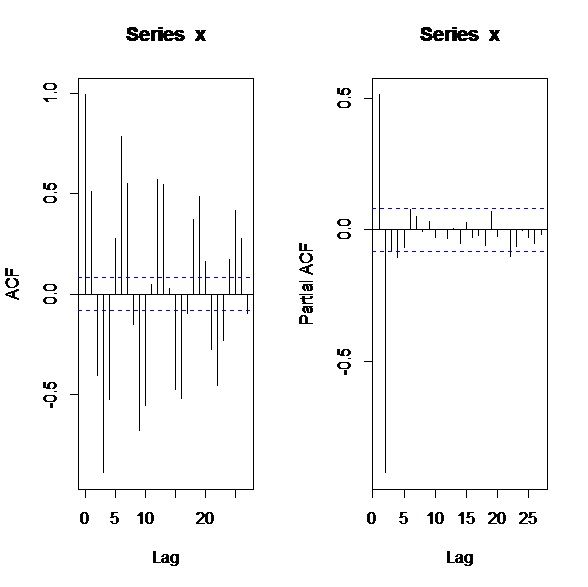
对于时间序列的绘图,我们以AR(2)模型的模拟为例:
w<-rnorm(550)
x<-filter(w,filter=c(1,-0.9),"recursive")
acf(x)
pacf(x)
得到图像:
这些可以创建一张图的函数,在R中被称为高级绘图函数。除了我们提到的这些外还有饼图:pie(),条形图:barplot(),qq图:qqnorm(),qqplot(),等高线:contour().等
二、图像的内容的丰富
R绘图函数的大部分参数是一致的,主要参数有:
Add=F(默认参数):叠加图形,不过要加点或线的话,一般使用points,lines这样的低级绘图函数
Type=”p” (默认参数):指定图形类型:p:点,l:线,b:点连线,o:线在点上,h:垂直线,s:阶梯式
Xlab,ylab:坐标轴标签
Main:主标题
Xlim,ylim:坐标轴范围
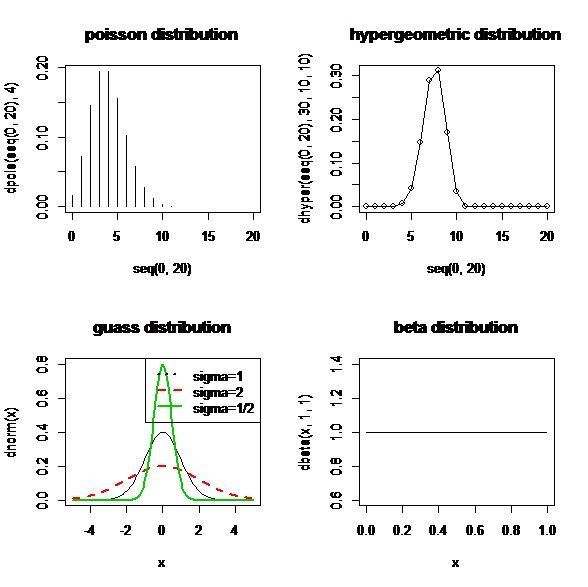
我们可以利用这些命令画一些概率密度分布图:
par(mfrow=c(2,2))
plot(seq(0,20),dpois(seq(0,20),4),type="h",main="poissondistribution")
plot(seq(0,20),dhyper(seq(0,20),30,10,10),type="o",main="hypergeometricdistribution")
curve(dnorm(x),xlim=c(-5,5),ylim=c(0,0.8))
curve(dnorm(x,0,2),add=T,col=2,lwd=2,lty=2)
curve(dnorm(x,0,1/2),add=T,col=3,lwd=2,lty=1)
legend(par('usr')[2],par('usr')[4],xjust=1,c("sigma=1","sigma=2","sigma=1/2"),
lwd=c(2,2,2),lty=c(3,2,1),col=c(1,2,3))
title(main="guassdistribution")
curve(dbeta(x,1,1),xlim=c(0,1),main="betadistribution")
得到图像:
我们对上面用到的一些低级绘图函数与绘图参数做一个简要说明:
Par():将图像分为几个部分,而且还可以指定每部分的长宽。如下例:
op<-par()
layout(matrix(c(2,1,0,3),2,2,byrow=T),c(1,6),c(4,1))
par(mar=c(1,1,5,2))
plot(cars$dist~cars$speed)
rug(side=1,jitter(cars$speed, 5))
rug(side=2,jitter(cars$dist, 5))
par(mar=c(1,2,5,1))
boxplot(cars$dist,axes=F)
par(op)#这个是在散点图左侧添加箱线图,你可以直接运行它。
Col:设定颜色,可以用颜色的数字代号,也可以用颜色的英文
Legend:添加图例,函数用法:
legend(x, y = NULL, legend, fill = NULL, col = par("col"),
border="black", lty, lwd, pch,
angle = 45, density = NULL, bty = "o", bg = par("bg"),
box.lwd = par("lwd"), box.lty = par("lty"), box.col = par("fg"),
pt.bg = NA, cex = 1, pt.cex = cex, pt.lwd = lwd,
xjust = 0, yjust = 1, x.intersp = 1, y.intersp = 1,
adj = c(0, 0.5), text.width = NULL, text.col = par("col"), text.font = NULL,
merge = do.lines && has.pch, trace = FALSE,
plot = TRUE, ncol = 1, horiz = FALSE, title = NULL,
inset = 0, xpd, title.col = text.col, title.adj = 0.5,
seg.len = 2)
Title:添加标题,包括主标题(main,置顶),副标题(sub,置底)
Lty:控制连线类型
Lwd:控制连线宽度
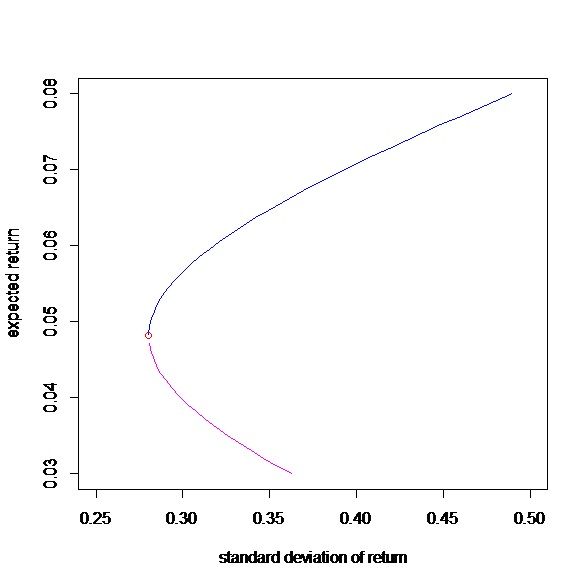
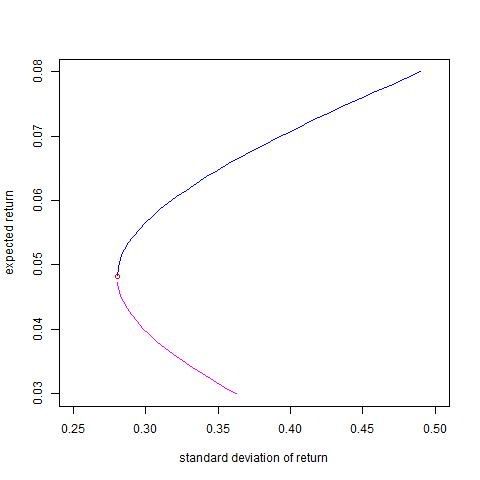
利用这些绘图命令,我们也可以尝试画出资本市场线:
#portfolio_efficient_frontier
bmu<-array(c(0.08,0.03,0.05),dim=c(1,3))
bomega<-matrix(c(0.3,0.02,0.01,0.02,0.15,0.03,0.01,0.03,0.18),3,3)
bone<-t(as.matrix(rep(1,length(bmu))))
ibomega<-solve(bomega)
A<-as.numeric((bone)%*%ibomega%*%t(bmu))
B<-as.numeric((bmu)%*%ibomega%*%t(bmu))
C<-as.numeric((bone)%*%ibomega%*%t(bone))
D<-B*C-A*A
bg<-(B*ibomega%*%t(bone)-A*ibomega%*%t(bmu))/D
bh<-(C*ibomega%*%t(bmu)-A*ibomega%*%t(bone))/D
gg<-as.numeric(t(bg)%*%bomega%*%bg)
hh<-as.numeric(t(bh)%*%bomega%*%bh)
gh<-as.numeric(t(bg)%*%bomega%*%bh)
mumin<--as.numeric(gh)/as.numeric(hh)
sdmin<-as.numeric(sqrt(gg*(1-gh^2/gg/hh)))
muP<-seq(min(bmu),max(bmu),length=50)
sigmaP<-rep(0,50)
for(i in 1:50){
omegaP<-bg+muP[i]*bh
sigmaP[i]<-sqrt(t(omegaP)%*%bomega%*%omegaP)
}
ind<-(muP>mumin)
ind2<-(muP<mumin)
Ap<-sigmaP[ind]
Bp<-muP[ind]
Ap1<-sigmaP[ind2]
Bp1<-muP[ind2]
plot(Ap,Bp,ylim=c(0.03,0.08),xlim=c(0.25,0.5),type="l",col="blue",
xlab="standard deviation ofreturn",ylab="expected return")
points(sdmin,mumin,col="red")
lines(Ap1,Bp1,col=6)
如下图:
还有一些绘图函数,如text(),参数expression,在绘图中也是十分重要的,但在此略去。
三、图像的保存
这里我们默认路径为工作路径,你可以通过getwd(),setwd()去查看或设置它。
其实在R语言里在图形生成的窗口是可以通过单击鼠标右键来复制或保存图像的,不过格式有限,通常是位图。对于想要保存为其他格式的,可以通过如下命令:
第一种png格式
png(file="myplot.png",bg="transparent")
dev.off()
第二种jpeg格式
jpeg(file="myplot.jpeg")
dev.off()
文件都放在getwd()里了
第三种pdf格式
pdf(file="myplot.pdf")
dev.off()
下面是一个具体的例子
png(file="myplot.png",bg="transparent")
plot(1:10)
rect(1,5, 3, 7, col="white")
dev.off()
当数据图很多时,记得用paste(),
for(i ingenid){
pdf(file=paste(i,'.pdf',sep=''))
hist(get(i))
dev.off()
}
下面是我用jpeg格式保存的资本市场线,你可以与前面给出的位图文件做一下对比:
#这一次的R脚本文件
par(mfrow=c(1,2))

plot(cars$speed, cars$dist, xlab = expression(speed^" of cars"), ylab = expression(dist^" of cars"))

set.seed(154)#用途是给定伪随机数的seed,在同样的seed下,R生成的伪随机数序列是相同的。这样的话,别人的模拟就是可以重复的。
w<-rnorm(200)
x<-cumsum(w)#累计求和,see example:cumsum(1:!0)
wd<-w+0.2
xd<-cumsum(wd)
plot.ts(xd,ylim=c(-5,55))

x<-rbinom(100000,100,0.9)
hist(x)
boxplot(x)

stem(log10(islands))

w<-rnorm(550)
x<-filter(w,filter=c(1,-0.9),"recursive")
acf(x)
pacf(x)

par(mfrow=c(2,2))
plot(seq(0,20),dpois(seq(0,20),4),type="h",main="poisson distribution")
plot(seq(0,20),dhyper(seq(0,20),30,10,10),type="o",main="hypergeometric distribution")
curve(dnorm(x),xlim=c(-5,5),ylim=c(0,0.8))
curve(dnorm(x,0,2),add=T,col=2,lwd=2,lty=2)
curve(dnorm(x,0,1/2),add=T,col=3,lwd=2,lty=1)
legend(par('usr')[2],par('usr')[4],xjust=1,c("sigma=1","sigma=2","sigma=1/2"),
lwd=c(2,2,2),lty=c(3,2,1),col=c(1,2,3))
title(main="guass distribution")
curve(dbeta(x,1,1),xlim=c(0,1),main="beta distribution")

op<-par()
layout(matrix(c(2,1,0,3),2,2,byrow=T),c(1,6),c(4,1))
par(mar=c(1,1,5,2))
plot(cars$dist~cars$speed)
rug(side=1,jitter(cars$speed, 5))
rug(side=2,jitter(cars$dist, 5))
par(mar=c(1,2,5,1))
boxplot(cars$dist,axes=F)
par(op)

#portfolio_efficient_frontier
bmu<-array(c(0.08,0.03,0.05),dim=c(1,3))
bomega<-matrix(c(0.3,0.02,0.01,0.02,0.15,0.03,0.01,0.03,0.18),3,3)
bone<-t(as.matrix(rep(1,length(bmu))))
ibomega<-solve(bomega)
A<-as.numeric((bone)%*%ibomega%*%t(bmu))
B<-as.numeric((bmu)%*%ibomega%*%t(bmu))
C<-as.numeric((bone)%*%ibomega%*%t(bone))
D<-B*C-A*A
bg<-(B*ibomega%*%t(bone)-A*ibomega%*%t(bmu))/D
bh<-(C*ibomega%*%t(bmu)-A*ibomega%*%t(bone))/D

gg<-as.numeric(t(bg)%*%bomega%*%bg)
hh<-as.numeric(t(bh)%*%bomega%*%bh)
gh<-as.numeric(t(bg)%*%bomega%*%bh)
mumin<--as.numeric(gh)/as.numeric(hh)
sdmin<-as.numeric(sqrt(gg*(1-gh^2/gg/hh)))
muP<-seq(min(bmu),max(bmu),length=50)
sigmaP<-rep(0,50)
for(i in 1:50){
omegaP<-bg+muP[i]*bh
sigmaP[i]<-sqrt(t(omegaP)%*%bomega%*%omegaP)
}

ind<-(muP>mumin)
ind2<-(muP<mumin)

Ap<-sigmaP[ind]
Bp<-muP[ind]
Ap1<-sigmaP[ind2]
Bp1<-muP[ind2]
plot(Ap,Bp,ylim=c(0.03,0.08),xlim=c(0.25,0.5),type="l",col="blue",
xlab="standard deviation of return",ylab="expected return")
points(sdmin,mumin,col="red")
lines(Ap1,Bp1,col=6)
