假设检验怎么做?这次把方法+Python代码一并教给你
作者 | Jose Garcia
译者 | 张睿毅
校对 | 张一豪、林亦霖
编辑 | 于腾凯
来源 | 数据派THU(ID:DatapiTHU)
【导读】本文中,作者给出了假设检验的解读与Python实现的详细的假设检验中的主要操作。
也许所有机器学习的初学者,或者中级水平的学生,或者统计专业的学生,都听说过这个术语,假设检验。我将简要介绍一下这个当我学习时给我带来了麻烦的主题。我把所有这些概念放在一起,并使用python进行示例。
在我寻求更广泛的事情之前要考虑一些问题 ——什么是假设检验?我们为什么用它?什么是假设的基本条件?什么是假设检验的重要参数?
让我们一个个地开始吧:
1、 什么是假设检验?
假设检验是一种统计方法,用于使用实验数据进行统计决策。假设检验基本上是我们对人口参数做出的假设。
例如:你说班里的学生平均年龄是40岁,或者一个男生要比女生高。
我们假设所有这些例子都需要一些统计方法来证明这些。无论我们假设什么是真的,我们都需要一些数学结论。
2、我们为什么要用它?
假设检验是统计学中必不可少的过程。假设检验评估关于总体的两个相互排斥的陈述,以确定样本数据最佳支持哪个陈述。当我们说一个发现具有统计学意义时,这要归功于一个假设检验。
3、什么是假设的基本条件?
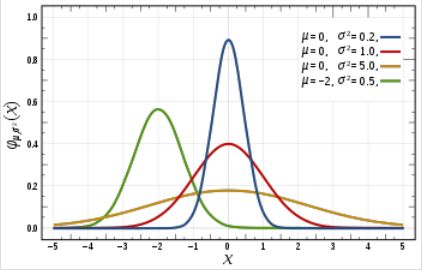
不同均值和方差下的正态分布
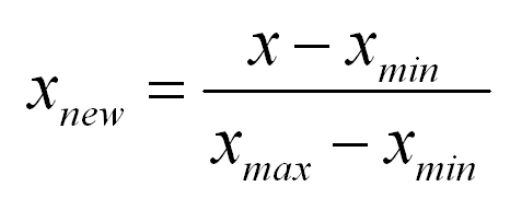
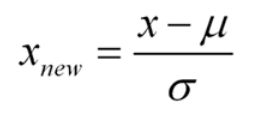
假设的基础是规范化和标准规范化
https://en.wikipedia.org/wiki/Normalization_(statistics);https://stats.stackexchange.com/questions/10289/whats——the——difference——between——normalization——and——standardization
我们所有的假设都围绕这两个术语的基础。让我们看看这些。
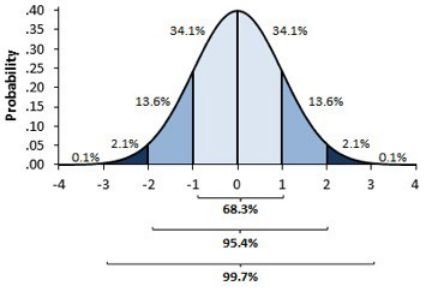
标准化的正态曲线图像和数据分布及每个部分的百分比
你一定想知道这两个图像之间有什么区别,有人可能会说我找不到,而其他人看到的图像会比较平坦,而不是陡峭的。好吧伙计这不是我想要表达的,首先你可以看到有不同的正态曲线所有那些正态曲线可以有不同的均值和方差,如第二张图像,如果你注意到图形是合理分布的,总是均值= 0和方差= 1。当我们使用标准化的正态数据时,z—score的概念就出现了。
正态分布
如果变量的分布具有正态曲线的形状——一个特殊的钟形曲线,则该变量被称为正态分布或具有正态分布。正态分布图称为正态曲线,它具有以下所有属性:1.均值,中位数和众数是相等。
正态分布方程
标准化正态分布
标准正态分布是平均值为0,标准差为1的正态分布
4、哪些是假设检验的重要参数?
-
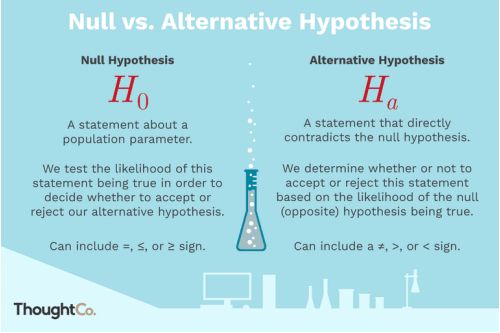
零假设:
-
备择假设:
-
T校验(学生T校验)
-
Z校验
-
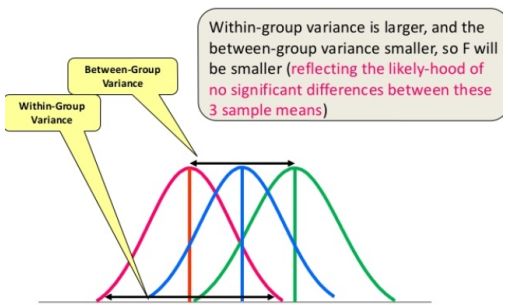
ANOVA校验
-
卡方检验
链接:https://www.investopedia.com/terms/v/variance.asp
链接:https://www.investopedia.com/terms/h/hypothesistesting.asp
-
单样本t检验
-
双样本t检验
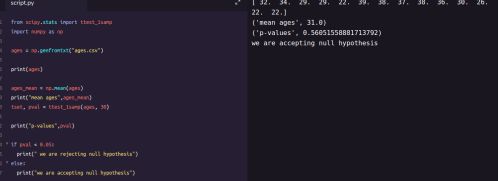
from scipy.stats import ttest_1sampimport
numpy as npages = np.genfromtxt
(“ages.csv”)print(ages)ages_mean = np.mean(ages)
print(ages_mean)tset, pval = ttest_1samp(ages, 30)
print(“p-values”,pval)if pval < 0.05:    # alpha value is 0.05 or 5%   print
(" we are rejecting null hypothesis")else:
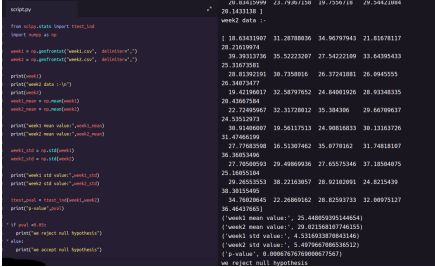
print("we are accepting null hypothesis”)from scipy.stats import ttest_indimport numpy as npweek1 = np.genfromtxt
("week1.csv", delimiter=",")
week2 = np.genfromtxt
("week2.csv", delimiter=",")print(week1)
print("week2 data :-\n")print(week2)
week1_mean = np.mean(week1
)week2_mean = np.mean(week2)print
("week1 mean value:",week1_mean)print
("week2 mean value:",week2_mean)
week1_std = np.std(week1)week2_std =
np.std(week2)print("week1 std value:",week1_std)
print("week2 std value:",week2_std)
ttest,pval = ttest_ind(week1,week2)print
("p-value",pval)if pval <0.05: print
("we reject null hypothesis")else: print("we accept null hypothesis”)import pandas as pd
from scipy import stats
df = pd.read_csv("blood_pressure.csv")
df[['bp_before','bp_after']].describe()
ttest,pval = stats.ttest_rel(df['bp_before'], df['bp_after'])
print(pval)
if pval<0.05:
print("reject null hypothesis")
else:
print("accept null hypothesis")链接:https://www.statisticshowto.datasciencecentral.com/ probability——and——statistics/hypothesis——testing/f——test/https://www.statisticshowto.datasciencecentral.com/probability——and——statistics/chi——square/https://www.statisticshowto. datasciencecentral.com/probability——and——statistics/t——test/
您的样本量大于30,否则,请使用t检验。
链接:https://www.statisticshowto.datasciencecentral.com/probability——and——statistics/find——sample——size/
数据点应彼此独立,换句话说,一个数据点不相关或不影响另一个数据点。
链接:https://www.statisticshowto.datasciencecentral.com/probability——and——statistics/dependent——events——independent/
您的数据应该是正常分布的。但是,对于大样本量(超过30个),这并不总是重要的。
您的数据应从人口中随机选择,每个项目都有相同的选择机会。
如果可能的话,样本量应该相等。
import pandas as pd
from scipy import statsfrom statsmodels.stats
 import weightstats as stestsztest ,pval = stests.ztest(df['bp_before'], x2=None, value=156)
print(float(pval))if pval<0.05:
    print("reject null hypothesis")
else:
print("accept null hypothesis")ztest ,pval1 = stests.ztest(df['bp_before'],
x2=df['bp_after'],
value=0,alternative='two-sided')print(float(pval1))if pval<0.05:
print("reject null hypothesis")else: print("accept null hypothesis")链接:https://en.wikipedia.org/ wiki/Analysis_of_variance
df_anova = pd.read_csv('PlantGrowth.csv')
df_anova = df_anova[['weight','group']]grps = pd.unique(df_anova.group.values)
d_data = {grp:df_anova['weight'][df_anova.group == grp] for grp in grps}
 F, p = stats.f_oneway(d_data['ctrl'], d_data['trt1'], d_data['trt2'])
print("p-value for significance is: ", p)
if p<0.05:
   print("reject null hypothesis")
else:
print("accept null hypothesis")链接:https://stattrek.com/Help/Glossary.aspx? Target=Categorical%20variable
import statsmodels.api as sm
from statsmodels.formula.api import olsdf_anova2 =
 pd.read_csv
("https://raw.githubusercontent.com/Opensourcefordatascience/Data-sets/master/crop_yield.csv")
model = ols('Yield ~ C(Fert)*C(Water)'
, df_anova2).fit()print(f"Overall model F
({model.df_model: .0f},{model.df_resid: .0f}) = {model.fvalue: .3f}, p = {model.f_pvalue: .4f}")
res = sm.stats.anova_lm(model, typ= 2)res链接:https://stattrek.com/Help/ Glossary.aspx?Target=Categorical%20variable
df_chi = pd.read_csv('chi-test.csv')
contingency_table=pd.crosstab(df_chi["Gender"],df_chi["Shopping?"])
print('contingency_table :-\n',contingency_table)
#Observed ValuesObserved_Values = contingency_table.values print
("Observed Values :
\n",Observed_Values)b=stats.chi2_contingency(contingency_table)
Expected_Values = b[3]print
("Expected Values :-\n",Expected_Values)
no_of_rows=len(contingency_table.iloc[0:2,0])
no_of_columns=len(contingency_table.iloc[0,0:2])ddof=(no_of_rows-1)*(no_of_columns-1)print
("Degree of Freedom:-",ddof
)alpha = 0.05from scipy.stats import chi2chi_square=sum([(o-e)
**2./e for o,e in zip(Observed_Values,Expected_Values)])
chi_square_statistic=chi_square[0]+chi_square[1]print
("chi-square statistic:-",chi_square_statistic)
critical_value=chi2.ppf(q=1-alpha,df=ddof)print
('critical_value:',critical_value)
#p-valuep_value=1-chi2.cdf(x=chi_square_statistic,df=ddof)
print('p-value:',p_value)print('Significance level: ',alpha)
print('Degree of Freedom: ',ddof)
print('chi-square statistic:',chi_square_statistic)
print('critical_value:',critical_value)print('p-value:',p_value)
if chi_square_statistic>=critical_value:    print
("Reject H0,There is a relationship
between 2 categorical variables")
else:    print("Retain H0,There is no relationship
 between 2 categorical variables")
  if p_value<=alpha:    print
("Reject H0,There is a relationship
between 2 categorical variables")else:    print
("Retain H0,There is no relationship between 2 categorical variables")译者介绍:张睿毅,北京邮电大学大二物联网在读。我是一个爱自由的人。在邮电大学读第一年书我就四处跑去蹭课,折腾整一年惊觉,与其在当下焦虑,不如在前辈中沉淀。于是在大二以来,坚持读书,不敢稍歇。资本主义国家的科学观不断刷新我的认知框架,同时因为出国考试很早出分,也更早地感受到自己才是那个一直被束缚着的人。太多真英雄在社会上各自闪耀着光芒。这才开始,立志终身向遇到的每一个人学习。做一个纯粹的计算机科学里面的小学生。喜欢算法,数据挖掘,图像识别,自然语言处理,神经网络,人工智能等方向。
原文链接:
https://towardsdatascience.com/hypothesis-testing-in-machine-learning-using-python-a0dc89e169ce
◆
精彩推荐
◆
倒计时!由易观携手CSDN联合主办的第三届易观算法大赛还剩 7 天,冠军团队将获得3万元!
本次比赛主要预测访问平台的相关事件的PV,UV流量(包括Web端,移动端等),大赛将会提供相应事件的流量数据,以及对应时间段内的所有事件明细表和用户属性表等数据,进行模型训练,并用训练好的模型预测规定日期范围内的事件流量。
推荐阅读
知乎算法团队负责人孙付伟:Graph Embedding在知乎的应用实践
必看,61篇NeurIPS深度强化学习论文解读都这里了
打破深度学习局限,强化学习、深度森林或是企业AI决策技术的“良药”
激光雷达,马斯克看不上,却又无可替代?
卷积神经网络中十大拍案叫绝的操作
Docker是啥?容器变革的火花?
5大必知的图算法,附Python代码实现
阿里云弹性计算负责人蒋林泉:亿级场景驱动的技术自研之路
40 岁身体死亡,11 年后成“硅谷霍金”,他用一块屏幕改变 100 万人!
AI大神如何用区块链解决模型训练痛点, AI+区块链的正确玩法原来是这样…… | 人物志

