运行环境:win10 64位 py 3.6 pycharm 2018.1.1
import numpy as np
import matplotlib.pyplot as plt
from sklearn import datasets,decomposition,manifold

def load_data():
    iris = datasets.load_iris()
    return iris.data,iris.target
def test_PCA(*data):
X,y = data
pca= decomposition.PCA(n_components=None)
pca.fit(X)
print('explained variance ratio : %s :'% str(pca.explained_variance_ratio_))
X,y = load_data()
test_PCA(X,y)
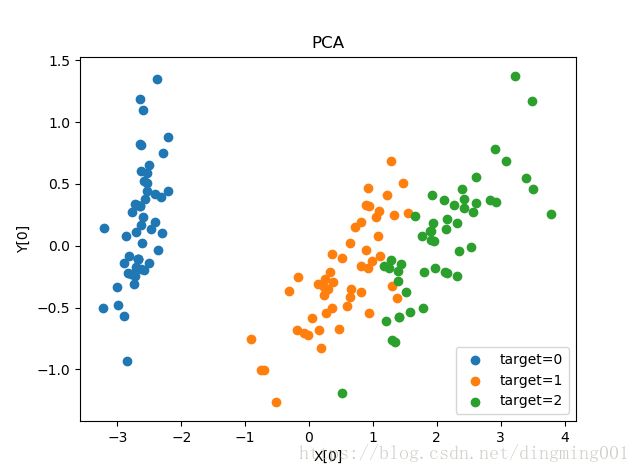
def plot_PCA(*data):
X,y = data
pca = decomposition.PCA(n_components=2)
pca.fit(X)
X_r = pca.transform(X)
fig = plt.figure()
ax = fig.add_subplot(1,1,1)
for label in np.unique(y):
position = y == label
ax.scatter(X_r[position,0],X_r[position,1],label='target=%d'%label)
ax.set_xlabel('X[0]')
ax.set_ylabel('Y[0]')
ax.legend(loc='best')
ax.set_title('PCA')
plt.show()
X,y = load_data()
plot_PCA(X,y)

#超大规模的数据降维
decomposition.IncrementalPCA
def test_KPCA(*data):
X,y = data
kernels= ['linear','poly','rbf','sigmoid']
for kernel in kernels:
kpca = decomposition.KernelPCA(n_components=None,kernel=kernel)
kpca.fit(X)
print('kernel=%s --> lambdas:%s:'%(kernel,kpca.lambdas_))
X,y = load_data()
test_KPCA(X,y)
def plot_KPCA(*data):
X,y = data
kernels = ['linear','poly','rbf','sigmoid']
fig = plt.figure()
for i,kernel in enumerate(kernels):
kpca = decomposition.KernelPCA(n_components=2, kernel=kernel)
kpca.fit(X)
X_r = kpca.transform(X)
ax = fig.add_subplot(2, 2, i+1)
for label in np.unique(y):
position = y == label
ax.scatter(X_r[position,0],X_r[position,1],label="target=%d"%label)
ax.set_xlabel('x[0]')
ax.set_ylabel('x[1]')
ax.legend(loc='best')
ax.set_title('kernel=%s'% kernel)
plt.suptitle("KPCA")
plt.show()
X, y = load_data()
plot_KPCA(X, y)

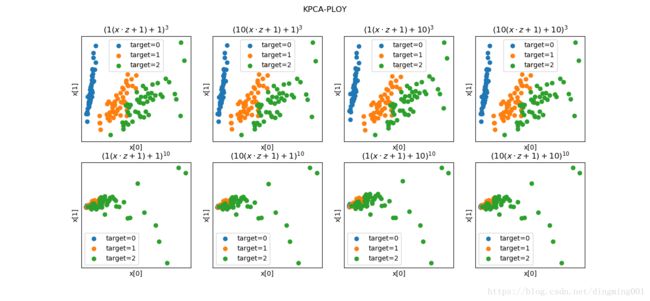
def plot_KPCA_ploy(*data):
X, y = data
fig = plt.figure()
params = [(3,1,1),(3,10,1),(3,1,10),(3,10,10),(10,1,1),(10,10,1),(10,1,10),(10,10,10)]
for i,(p,gamma,r) in enumerate(params):
kpca = decomposition.KernelPCA(n_components=2,kernel='poly',gamma=gamma,degree=p,coef0=r)
kpca.fit(X)
X_r = kpca.transform(X)
ax = fig.add_subplot(2,4,i+1)
for label in np.unique(y):
position = y == label
ax.scatter(X_r[position,0],X_r[position,1],label='target=%d'%label)
ax.set_xlabel('x[0]')
ax.set_xticks([])
ax.set_yticks([])
ax.set_ylabel('x[1]')
ax.legend(loc='best')
ax.set_title(r'$(%s(x\cdot z+1) + %s)^{%s}$'%(gamma,r,p))
plt.suptitle('KPCA-PLOY')
plt.show()
X, y = load_data()
plot_KPCA_ploy(X, y)

def plot_KPCA_rbf(*data):
X, y = data
fig = plt.figure()
gammas = [0.5,1,4,10]
for i,gamma in enumerate(gammas):
kpca = decomposition.KernelPCA(n_components=2,kernel='rbf',gamma=gamma)
kpca.fit(X)
X_r = kpca.transform(X)
ax = fig.add_subplot(2,2,i+1)
for label in np.unique(y):
position = y == label
ax.scatter(X_r[position,0],X_r[position,1],label='target=%d'%label)
ax.set_xlabel('x[0]')
ax.set_xticks([])
ax.set_yticks([])
ax.set_ylabel('x[1]')
ax.legend(loc='best')
ax.set_title(r'$\exp(-%s||x-z||^2)$'%gamma)
plt.suptitle('KPCA-RBF')
plt.show()
X, y = load_data()
plot_KPCA_rbf(X, y)

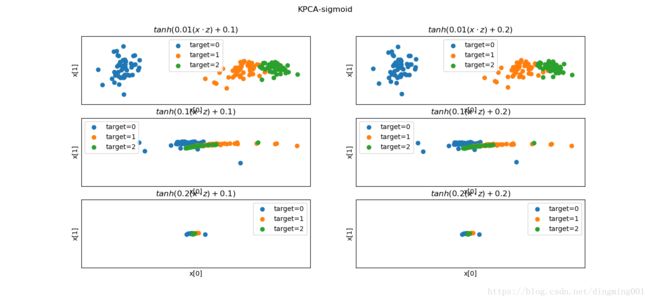
def plot_KPCA_sigmod(*data):
X,y = data
fig = plt.figure()
params = [(0.01,0.1),(0.01,0.2),(0.1,0.1),(0.1,0.2),(0.2,0.1),(0.2,0.2)]
for i,(gamma,r) in enumerate(params):
kpca = decomposition.KernelPCA(n_components=2,kernel='sigmoid',gamma=gamma,coef0=r)
kpca.fit(X)
X_r = kpca.transform(X)
ax = fig.add_subplot(3,2,i+1)
for label in np.unique(y):
position = y == label
ax.scatter(X_r[position,0],X_r[position,1],label='target=%d'%label)
ax.set_xlabel('x[0]')
ax.set_xticks([])
ax.set_yticks([])
ax.set_ylabel('x[1]')
ax.legend(loc='best')
ax.set_title(r'$tanh(%s(x\cdot z)+%s)$'%(gamma,r))
plt.suptitle('KPCA-sigmoid')
plt.show()
X, y = load_data()
plot_KPCA_sigmod(X, y)


