Pandas 知识点补充
01. pandas CheatSheet
import pandas as pd
import numpy as np
DataFrame:
就是一个SQL的表格Table
** 一个张量(有时是一个矩阵),就是一个容器。**
** 有序的容器包容后结果 **
** 一个DataFrame可以被表示成一个JSON,也可以被表示成一个CSV **
** 可以被JSON初始化 **
data0 = {
    'a':[1,2,3],
    'b':[4,5,6],
    'c':['Bob','Alice','Jack']
}
pd.DataFrame(data0)
data = {
    'name': ['Alice', 'Bob', 'Charles', 'David', 'Eric'],
    'year': [2017, 2017, 2017, 2017,2017],#2017
    'salary': [40000, 24000, 31000, 20000, 30000],
    'pair':[{'a':1},{'a':2},{'a':3},{'a':4},{'a':5}]
}
d = pd.DataFrame(data)
d
访问列
d['pair']
0    {'a': 1}
1    {'a': 2}
2    {'a': 3}
3    {'a': 4}
4    {'a': 5}
Name: pair, dtype: object
d.pair
0    {'a': 1}
1    {'a': 2}
2    {'a': 3}
3    {'a': 4}
4    {'a': 5}
Name: pair, dtype: object
type(d.pair)
pandas.core.series.Series
d.pair.tolist()
[{'a': 1}, {'a': 2}, {'a': 3}, {'a': 4}, {'a': 5}]
d.pair[0]
{'a': 1}
薪水大于20000的人都有谁?
d.query('salary>20000')
d[d.salary>20000]
d.salary > 20000
0     True
1     True
2     True
3    False
4     True
Name: salary, dtype: bool
Eric的信息时什么
### Pandas如何进行查询?
d[d.name == 'Eric']
d.query("name == 'Eric'")
d[d.name == 'Eric']
d.loc[d.name == "Eric"]
联合查找 明叫Bob 且薪水大于20000
d.query("name == 'Bob' and salary>20000")
data2 = d[d.name == 'Eric']
data2
列操作
在SQL经常使用的 SELECT name,year,salary from T where salary > 20000 and name == 'Eric'
事实上是对二阶张量的行和列的筛选
  File "", line 1
    在SQL经常使用的 SELECT name,year,salary from T where salary > 20000 and name == 'Eric'
                   ^
SyntaxError: invalid syntax
d.filter(items = ['name','year','salary'])
#简化方法
d[['name','year']]
## 模糊查找
d.filter(like = '2',axis = 0) # 模糊查找行
d.filter(like = 'ea',axis = 1)# 模糊查找列
分组
df1 = pd.DataFrame( { "Name" : ["Alice", "Ada", "Mallory", "Mallory", "Billy" , "Mallory"] , "City" : ["Sydney", "Sydney", "Paris", "Sydney", "Sydney", "Paris"]} )
df1
### 各个城市都有那些人?
df1.groupby(['City']).count()
统计量分析
Numerical变量分析
d.describe()
统计函数
df2 = pd.DataFrame({'key1':['a', 'a', 'b', 'b', 'a'],'key2':['one', 'two', 'one', 'two', 'one'],'data1':np.random.randn(5),'data2':np.random.randn(5)})
df2
基于属性key1的类型a b 各自的平局值是多少(包括data1和data2但是不包括key2)
df2.groupby(['key1']).mean()
联合group'a-one','a-two','b-one','b-two'
df2.groupby(['key1','key2']).mean()
df2.count()
key1     5
key2     5
data1    5
data2    5
dtype: int64
df2.groupby(['key1']).count()
df2.groupby(['key1','key2']).count()
排序
df2
df2.data2.sort_values() # 对列进行排序
4   -0.909664
1    0.148519
0    0.566564
2    0.691091
3    0.841190
Name: data2, dtype: float64
df2.sort_values(by='key2')#按照指定列进行排序
#多属性的排序
df2.sort_values(by = ['key1','data1','data2'])
降序
df2.sort_values(by=['key1'],ascending=False)
import xgboost as xgb
# DataFrame 增删改查
df2
df2.iloc[0]["key1"]
'a'
df2.iloc[0].key1
'a'
df2.loc[0]
key1            a
key2          one
data1   -0.971655
data2    0.566564
Name: 0, dtype: object
df2.groupby(['key1']).count().iloc[0]
key2     3
data1    3
data2    3
Name: a, dtype: int64
df2.groupby(['key1']).count().loc['a']
key2     3
data1    3
data2    3
Name: a, dtype: int64
使用 iloc 获取dataFrame的某行某列
loc 在index的标签(具体的index的值:cat,dog,pig,4,s....)上进行索引,范围包括start和end.
*iloc 在index的位置(具体的位置0,1,2.。。)上进行索引,不包括end. *
df2.iloc[0,0]
'a'
df2.iloc[:,0]
0    a
1    a
2    b
3    b
4    a
Name: key1, dtype: object
df2.iloc[0:2]
df2.iloc[0:-1]
打印前两行和后两列
df2.iloc[:2,2:]
数据的修改
.at[]
df2
df2.at[1,'data1'] = 2
df2
iat[]
df2.iat[1,3] = 2.0
df2
增加行
.append()
对于dataframe 每一行事实上代表着一个对象/向量,对于对象的表示,用json表示
df3 = df2.append({'data1':1.2,'data2':1.4,'key1':'b','key2':'two'},ignore_index = True)
df2
df2.loc[5]=['c','three',2,1]
df2
增加列
.assign()
df3.assign(key3 = [1,2,3,4,5,6])
df4 = df3.assign(key=[1,2,3,4,5,6])
df3.loc[:,'key4'] = [6,5,4,3,2,1]
df3
Dataframe 自带绘图
data3 = {'name': ['Jason', 'Molly', 'Tina', 'Jake', 'Amy'],
         'year': [2012, 2012, 2013, 2014, 2014],
         'reports': [4, 24, 31, 2, 3]}
df3 = pd.DataFrame(data3, index = ['Cochice', 'Pima', 'Santa Cruz', 'Maricopa', 'Yuma'])
df3
df3['reports']
Cochice        4
Pima          24
Santa Cruz    31
Maricopa       2
Yuma           3
Name: reports, dtype: int64
df3['reports'].plot.bar()#柱状图
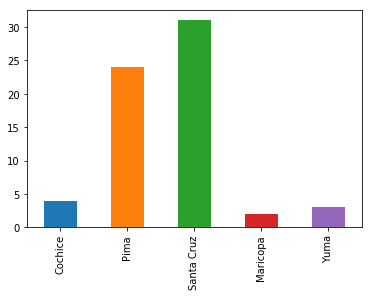
output_101_1.png
import matplotlib.pyplot as plt
plt.show()
%matplotlib inline #可以省略plt.show()
df3.plot.bar(color=['r','b'])#只显示数值类型
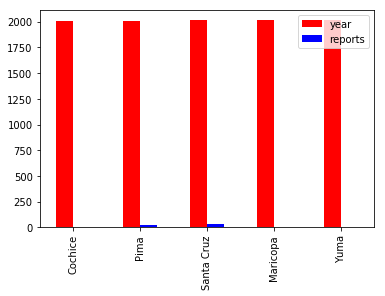
output_105_1.png
核密度估计(kernel Density Estimation)(KDE)
df2
import seaborn as sns
sns.kdeplot(df2['data1'])
/anaconda3/lib/python3.7/site-packages/scipy/stats/stats.py:1713: FutureWarning: Using a non-tuple sequence for multidimensional indexing is deprecated; use `arr[tuple(seq)]` instead of `arr[seq]`. In the future this will be interpreted as an array index, `arr[np.array(seq)]`, which will result either in an error or a different result.
  return np.add.reduce(sorted[indexer] * weights, axis=axis) / sumval
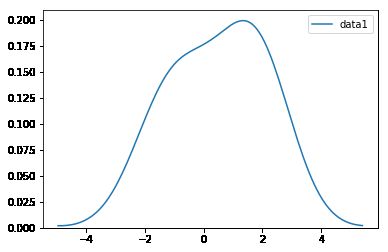
output_109_2.png
sns.kdeplot(df2['data1'],shade = True,color='r')
sns.kdeplot(df2['data2'],shade = True,color='g')
/anaconda3/lib/python3.7/site-packages/scipy/stats/stats.py:1713: FutureWarning: Using a non-tuple sequence for multidimensional indexing is deprecated; use `arr[tuple(seq)]` instead of `arr[seq]`. In the future this will be interpreted as an array index, `arr[np.array(seq)]`, which will result either in an error or a different result.
  return np.add.reduce(sorted[indexer] * weights, axis=axis) / sumval
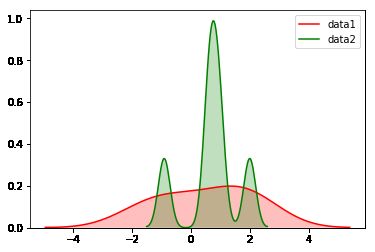
output_110_2.png
生成一段数据,并进行核密度估计
np.random.rand(50)#生成0-1之间五十个数
array([0.68181479, 0.3690832 , 0.35463866, 0.53580876, 0.90808807,
       0.81728958, 0.45994927, 0.85711772, 0.17451421, 0.84877934,
       0.81652505, 0.29345216, 0.54783368, 0.27237449, 0.52830713,
       0.62087327, 0.79453093, 0.38776286, 0.26893063, 0.76210532,
       0.9783125 , 0.49008837, 0.52586307, 0.85701882, 0.58862554,
       0.59155749, 0.63935365, 0.91440319, 0.95201363, 0.00616439,
       0.54549222, 0.9929021 , 0.29379443, 0.89699079, 0.29893343,
       0.92532077, 0.17440894, 0.26857451, 0.53569504, 0.39183358,
       0.96314764, 0.88013045, 0.85781511, 0.96542436, 0.19936221,
       0.31499401, 0.77999836, 0.89925742, 0.39472706, 0.53870852])
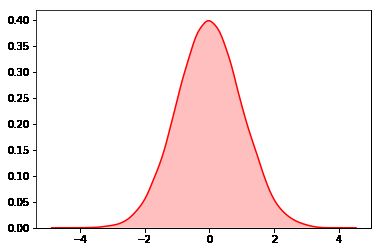
x=np.random.rand(50000) #随机分布
#x=np.random.randn(50000) #正太分布
x
array([ 0.99501115, -0.94985232,  0.12039263, ...,  1.08075921,
       -2.01710338,  0.96293241])
sns.kdeplot(x,shade=True,color='r')
/anaconda3/lib/python3.7/site-packages/scipy/stats/stats.py:1713: FutureWarning: Using a non-tuple sequence for multidimensional indexing is deprecated; use `arr[tuple(seq)]` instead of `arr[seq]`. In the future this will be interpreted as an array index, `arr[np.array(seq)]`, which will result either in an error or a different result.
  return np.add.reduce(sorted[indexer] * weights, axis=axis) / sumval
output_114_2.png
sns.kdeplot(x,shade=True,color='g')
/anaconda3/lib/python3.7/site-packages/scipy/stats/stats.py:1713: FutureWarning: Using a non-tuple sequence for multidimensional indexing is deprecated; use `arr[tuple(seq)]` instead of `arr[seq]`. In the future this will be interpreted as an array index, `arr[np.array(seq)]`, which will result either in an error or a different result.
  return np.add.reduce(sorted[indexer] * weights, axis=axis) / sumval

output_115_2.png
type(x)
numpy.ndarray