无人驾驶算法学习(三):扩展卡尔曼滤波器Extended Kalman Filter
文章目录
- 1.引言
- 2. 扩展卡尔曼滤波数学理论
- 3. 代码实战
- 3.1 python实现
- 3.2结果分析
1.引言
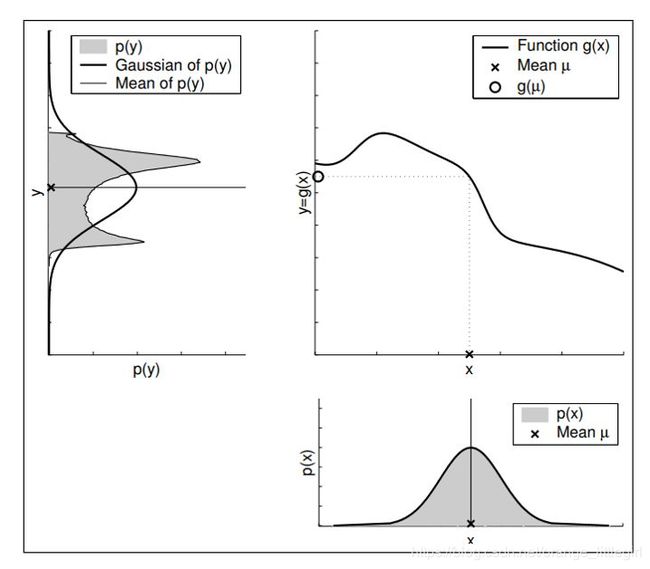
当系统状态方程不符合线性假设时,采用卡尔曼滤波无法获得理想的最优估计。高斯分布在非线性系统中的传递结果将不再是高斯分布,参见下图所示。这里x符合高斯分布,y=g(x)为非线性函数,所得结果y的分布已经严重“变形”(这里y的分布通过蒙特卡洛采样获得),统计y的均值和方差也可以画出图中的高斯函数曲线,但已经与实际分布严重不符。

在描述机器人状态时常常不满足卡尔曼滤波的假设,为了仍然能够使用卡尔曼滤波,我们采用对非线性系统进行线性化等方法来扩大卡尔曼滤波的使用范围。扩展卡尔曼滤波与卡尔曼滤波主要区别在于:对状态方程和观测方程泰勒展开。
2. 扩展卡尔曼滤波数学理论
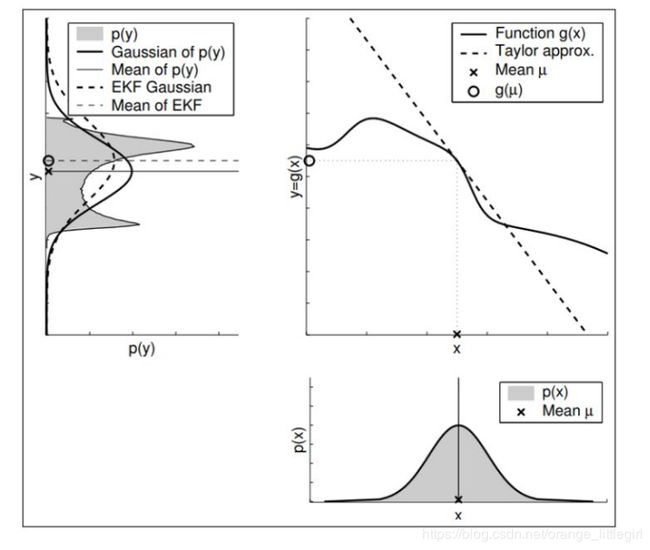
卡尔曼滤波的思想其实很简单,既然系统是非线性的,不是“直线”了,那就用“切线”近似嘛。但是用哪里的切线呢?很明显应该用原分布中可能值最大的那一点处的切线,也就是均值处的切线,如下图所示。所得结果(虚线)与实际结果的均值方差较为接近。

因此我们要将非线性的运动方程和观测方程进行以切线代替的方式来线性化。其实就是在均值处进行一阶泰勒展开。
- 运动方程线性化

- 观测方程线性化

该方程近似为自变量 x t x_{t} xt 的线性方程
现在我们只需要用这两个线性化后的方程带入卡尔曼滤波中即可得到扩展卡尔曼滤波。

于是对比卡尔曼滤波,扩展卡尔曼滤波公式为:
由于卡尔曼滤波是基于高斯分布的,所以预测状态量,也就是高斯分布的均值(使得后验概率最大) x t = μ t x^{t}=\mu_t xt=μt

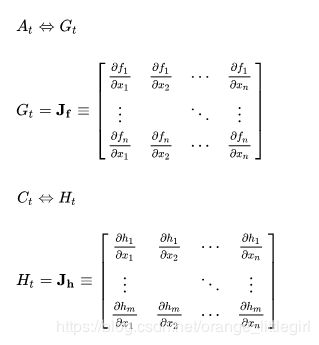
- 通过对比EKF和KF的公式会发现,主要区别在于:

对于计算雅克比矩阵,假设状态向量为 X t = [ x i , y i , v x , i , v y , i ] X_t=[x_i,y_i,v_{x,i},v_{y,i}] Xt=[xi,yi,vx,i,vy,i],观测向量为 z t = [ R i , θ i ] b z_t=[R_i,\theta_i]^{b} zt=[Ri,θi]b。根据 z t = h ( x t ) z_t=h(x_t) zt=h(xt)。


3. 代码实战
3.1 python实现
"""

Extended kalman filter (EKF) localization sample

author: jiangcheng

"""

import numpy as np
import math
import matplotlib.pyplot as plt

# Estimation parameter of EKF
Q = np.diag([0.1, 0.1, math.radians(1.0), 1.0])**2
R = np.diag([1.0, math.radians(40.0)])**2

#  Simulation parameter
Qsim = np.diag([0.5, 0.5])**2
Rsim = np.diag([1.0, math.radians(30.0)])**2

DT = 0.1  # time tick [s]
SIM_TIME = 50.0  # simulation time [s]

show_animation = True


def calc_input():
    v = 1.0  # [m/s]
    yawrate = 0.1  # [rad/s]
    u = np.matrix([v, yawrate]).T
    return u


def observation(xTrue, xd, u):

    xTrue = motion_model(xTrue, u)

    # add noise to gps x-y
    zx = xTrue[0, 0] + np.random.randn() * Qsim[0, 0]
    zy = xTrue[1, 0] + np.random.randn() * Qsim[1, 1]
    z = np.matrix([zx, zy])

    # add noise to input
    ud1 = u[0, 0] + np.random.randn() * Rsim[0, 0]
    ud2 = u[1, 0] + np.random.randn() * Rsim[1, 1]
    ud = np.matrix([ud1, ud2]).T

    xd = motion_model(xd, ud)

    return xTrue, z, xd, ud


def motion_model(x, u):

    F = np.matrix([[1.0, 0, 0, 0],
                   [0, 1.0, 0, 0],
                   [0, 0, 1.0, 0],
                   [0, 0, 0, 0]])

    B = np.matrix([[DT * math.cos(x[2, 0]), 0],
                   [DT * math.sin(x[2, 0]), 0],
                   [0.0, DT],
                   [1.0, 0.0]])

    x = F * x + B * u

    return x


def observation_model(x):
    #  Observation Model
    H = np.matrix([
        [1, 0, 0, 0],
        [0, 1, 0, 0]
    ])

    z = H * x

    return z


def jacobF(x, u):
    """
    Jacobian of Motion Model

    motion model
    x_{t+1} = x_t+v*dt*cos(yaw)
    y_{t+1} = y_t+v*dt*sin(yaw)
    yaw_{t+1} = yaw_t+omega*dt
    v_{t+1} = v{t}
    so
    dx/dyaw = -v*dt*sin(yaw)
    dx/dv = dt*cos(yaw)
    dy/dyaw = v*dt*cos(yaw)
    dy/dv = dt*sin(yaw)
    """
    yaw = x[2, 0]
    v = u[0, 0]
    jF = np.matrix([
        [1.0, 0.0, -DT * v * math.sin(yaw), DT * math.cos(yaw)],
        [0.0, 1.0, DT * v * math.cos(yaw), DT * math.sin(yaw)],
        [0.0, 0.0, 1.0, 0.0],
        [0.0, 0.0, 0.0, 1.0]])

    return jF


def jacobH(x):
    # Jacobian of Observation Model
    jH = np.matrix([
        [1, 0, 0, 0],
        [0, 1, 0, 0]
    ])

    return jH


def ekf_estimation(xEst, PEst, z, u):

    #  Predict
    xPred = motion_model(xEst, u)
    jF = jacobF(xPred, u)
    PPred = jF * PEst * jF.T + Q

    #  Update
    jH = jacobH(xPred)
    zPred = observation_model(xPred)
    y = z.T - zPred
    S = jH * PPred * jH.T + R
    K = PPred * jH.T * np.linalg.inv(S)
    xEst = xPred + K * y
    PEst = (np.eye(len(xEst)) - K * jH) * PPred

    return xEst, PEst


def plot_covariance_ellipse(xEst, PEst):
    Pxy = PEst[0:2, 0:2]
    eigval, eigvec = np.linalg.eig(Pxy)

    if eigval[0] >= eigval[1]:
        bigind = 0
        smallind = 1
    else:
        bigind = 1
        smallind = 0

    t = np.arange(0, 2 * math.pi + 0.1, 0.1)
    a = math.sqrt(eigval[bigind])
    b = math.sqrt(eigval[smallind])
    x = [a * math.cos(it) for it in t]
    y = [b * math.sin(it) for it in t]
    angle = math.atan2(eigvec[bigind, 1], eigvec[bigind, 0])
    R = np.matrix([[math.cos(angle), math.sin(angle)],
                   [-math.sin(angle), math.cos(angle)]])
    fx = R * np.matrix([x, y])
    px = np.array(fx[0, :] + xEst[0, 0]).flatten()
    py = np.array(fx[1, :] + xEst[1, 0]).flatten()
    plt.plot(px, py, "--r")


def main():
    print(__file__ + " start!!")

    time = 0.0

    # State Vector [x y yaw v]'
    xEst = np.matrix(np.zeros((4, 1)))
    xTrue = np.matrix(np.zeros((4, 1)))
    PEst = np.eye(4)

    xDR = np.matrix(np.zeros((4, 1)))  # Dead reckoning

    # history
    hxEst = xEst
    hxTrue = xTrue
    hxDR = xTrue
    hz = np.zeros((1, 2))

    while SIM_TIME >= time:
        time += DT
        u = calc_input()

        xTrue, z, xDR, ud = observation(xTrue, xDR, u)

        xEst, PEst = ekf_estimation(xEst, PEst, z, ud)

        # store data history
        hxEst = np.hstack((hxEst, xEst))
        hxDR = np.hstack((hxDR, xDR))
        hxTrue = np.hstack((hxTrue, xTrue))
        hz = np.vstack((hz, z))

        if show_animation:
            plt.cla()
            plt.plot(hz[:, 0], hz[:, 1], ".g")
            plt.plot(np.array(hxTrue[0, :]).flatten(),
                     np.array(hxTrue[1, :]).flatten(), "-b")
            plt.plot(np.array(hxDR[0, :]).flatten(),
                     np.array(hxDR[1, :]).flatten(), "-k")
            plt.plot(np.array(hxEst[0, :]).flatten(),
                     np.array(hxEst[1, :]).flatten(), "-r")
            plot_covariance_ellipse(xEst, PEst)
            plt.axis("equal")
            plt.grid(True)
            plt.pause(0.001)


if __name__ == '__main__':
    main()
3.2结果分析
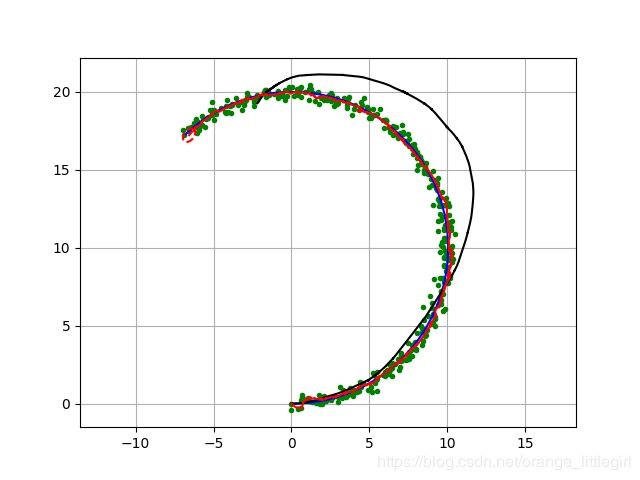
这是一个传感器融合定位与扩展卡尔曼滤波器(EKF)。
蓝线是正确的轨迹,黑线是航迹推算轨迹,绿点定位观察(GPS),红线与EKF估计轨迹。红色的椭圆与EKF估计协方差椭圆。
