刘小泽写于19.11.12
ShinyDashboard为shiny提供了更方便的框架
这个包需要Shiny 0.11以上
0-1 安装
install.packages("shinydashboard")
0-2 新建一个空的ui.R
library(shinydashboard)

dashboardPage(
  dashboardHeader(),
  dashboardSidebar(),
  dashboardBody()
)
0-3 空的serve.R
server <- function(input, output) { }
0-4 案例一:根据滑动条调整数据的数量,然后画直方图
## ui.R ##
library(shinydashboard)

dashboardPage(
  dashboardHeader(title = strong("Basic dashboard")),
  dashboardSidebar(),
  dashboardBody(
    # 按行放置组件
    fluidRow(
      box(plotOutput("plot1", height = 250)),

      box(
        title = "Controls",
        sliderInput("slider", "Number of observations:", 1, 100, 50)
      )
    )
  )
)
## server.R ##
server <- function(input, output) {
  set.seed(122)
  histdata <- rnorm(500)

  output$plot1 <- renderPlot({
    data <- histdata[seq_len(input$slider)]
    hist(data)
  })
  }
0-5 案例二:在sidebar中添加内容
这个过程很像shiny的tabPanel ,点击其中的某个按钮,会打开不一样的主界面
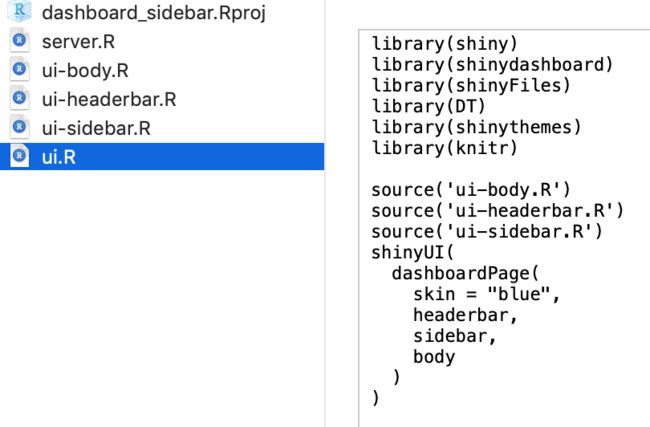
由于ui中包含了header、sidebar、body信息,写在一起太繁琐,因此可以分成3个不同脚本存放相关的设置,最后在ui.R中进行调用
0-5.1 首先是ui-headerbar.R
## 标题加粗,设置宽度
headerbar <- dashboardHeader(
  title = strong("Basic dashboard"),
  titleWidth = 270
)
0-5.2 然后是ui-sidebar.R
## 定义了两个按钮,第一个参数是在界面中的显示,第二个是与body中信息关联的名称
sidebar <- dashboardSidebar(
  sidebarMenu(
    menuItem("Dashboard", tabName = "dashboard", icon = icon("dashboard")),
    menuItem("Widgets", tabName = "widgets", icon = icon("th"))
  )
)
0-5.3 接着是ui-body.R
## 指定两个tab分别显示什么信息
body <- dashboardBody(
  tabItems(
    # First tab content
    tabItem(tabName = "dashboard",
            fluidRow(
              box(plotOutput("plot1", height = 250)),

              box(
                title = "Controls",
                sliderInput("slider", "Number of observations:", 1, 100, 50)
              )
            )
    ),

    # Second tab content
    tabItem(tabName = "widgets",
            h2("Widgets tab content")
    )
  )
)
0-5.4 最后是ui.R
source('ui-body.R')
source('ui-headerbar.R')
source('ui-sidebar.R')
shinyUI(
  dashboardPage(
    skin = "blue",
    headerbar,
    sidebar,
    body
  )
)
1 ShinyDashboard的基础之Shiny与HTML
官网链接:https://rstudio.github.io/shinydashboard/structure.html
为了理解dashboard的各个部件是如何组合的,首先需要了解Shiny 的UI是怎么构建的,也就是需要知道一点HTML网页的知识
之前学到Shiny中的div()、p()函数实际上就是生成了HTML的
例如:
# 在shiny中
div(class = "my-class", "Div content")
# HTML中
## Div content

# 在shiny中
div(class = "my-class", p("Paragraph text"))
# HTML中
##
##   Paragraph text
##
还有更复杂的:
sidebarPanel(
div("First div"),
div("Second div")
)
##
##
##
其实以上说明了,shiny之所以方便做网页,正式它把HTML语言给我们包装好了,只需要调取函数就行,不需要过多干预底层代码
2 UI结构总览
总共就是三大块:
header <- dashboardHeader()

sidebar <- dashboardSidebar()

body <- dashboardBody()

dashboardPage(header, sidebar, body)
2-1 首先是Header
总体上是这样效果:
2-1.1 设置标题
dashboardHeader(title = "My Dashboard")
另外看到右边有三个通知栏,它们是通过
dropdownMenu()设置的;总共有三种:messages, notifications, and tasks
2-1.2 设置messages => dropdownMenu + messageItem
它属于dropdownMenu下的messageItem ,比如这里看到的Sales、New User、Support属于三个不同的messageItem,只是用不同的图标(icon)来显示。默认情况下,icon是第一个这种人影轮廓;还可以设置时间
dropdownMenu(type = "messages",
  messageItem(
    from = "Sales Dept",
    message = "Sales are steady this month."
  ),
  messageItem(
    from = "New User",
    message = "How do I register?",
    icon = icon("question"),
    time = "13:45"
  ),
  messageItem(
    from = "Support",
    message = "The new server is ready.",
    icon = icon("life-ring"),
    time = "2019-11-12"
  )
)
不过这种生成的样式是静态的。如果想让它动态变化,那么就要在server.R中进行设置
2-1.3 设置信息通知 notification => dropdownMenu + notificationItem
dropdownMenu(type = "notifications",
  notificationItem(
    text = "5 new users today",
    icon("users")
  ),
  notificationItem(
    text = "12 items delivered",
    icon("truck"),
    status = "success"
  ),
  notificationItem(
    text = "Server load at 86%",
    icon = icon("exclamation-triangle"),
    status = "warning"
  )
)
2-1.4 设置任务提醒 task => dropdownMenu + taskItem
dropdownMenu(type = "tasks", badgeStatus = "success",
  taskItem(value = 90, color = "green",
    "Documentation"
  ),
  taskItem(value = 17, color = "aqua",
    "Project X"
  ),
  taskItem(value = 75, color = "yellow",
    "Server deployment"
  ),
  taskItem(value = 80, color = "red",
    "Overall project"
  )
)
2-1.5 如果不想要header => dashboardHeader(disable = TRUE)
2-2 然后是Sidebar部分
侧边栏一般是用于快速检索,可以包含文字、滑块等,选择其中一项就会在主界面出现变化
2-2.1 添加badge => sidebarMenu + menuItem + badgeLabel
sidebar <- dashboardSidebar(
  sidebarMenu(
    menuItem("Dashboard", tabName = "dashboard", icon = icon("dashboard")),
    menuItem("Widgets", tabName = "widgets", icon = icon("th"),
             badgeLabel = "new", badgeColor = "green")
  )
)
2-2.2- menuItem的其他用途
除了添加一些tabs,它还可以添加外部链接,用href参数;另外使用newtab控制是否打开一个新窗口
menuItem("Source code", icon = icon("file-code-o"),
             href = "https://github.com/rstudio/shinydashboard/",
             newtab = F)
2-2.3 sidebar的ui与server交互 => renderMenu+ sidebarMenuOutput
# ui.R sidebarMenuOutput
ui <- dashboardPage(
  dashboardHeader(title = "Dynamic sidebar"),
  dashboardSidebar(
    sidebarMenuOutput("menu")
  ),
  dashboardBody()
)
# server.R renderMenu
server <- function(input, output) {
  output$menu <- renderMenu({
    sidebarMenu(
      menuItem("Menu item", icon = icon("calendar"))
    )
  })
}
2.2-4 在sidebar中输入 => sliderInput / textInput/ dateRangeInput ...
这些和shiny的一样
# 滑块
sliderInput("range",
                  label = "Range of interest:",
                  min = 0, max = 100, value = c(0, 100))
# 输入文字
textInput("text", label = h3("Text input"),
                     value = "Enter text...")
# 日期范围
dateRangeInput("dates", label = h3("Date range"))
除了shiny有的以外,它还有一个搜索框:sidebarSearchForm
sidebarSearchForm(textId = "searchText", buttonId = "searchButton",
                      label = "Search...")
与搜索功能对应的server函数是:input$searchText和input$searchButton
2.2-5 如果要取消使用sidebar => dashboardSidebar(disable = TRUE)
2-3 最后是Boby部分
2-3.1 这一部分可以包含任何的shiny内容,就是装在以box为基础的架构中 => fluidRow + box
例如:
body <- dashboardBody(
  fluidRow(
    box(
      title = "Histogram",
      status = "primary", # 设置标题框颜色
      solidHeader = TRUE, # 标题是否设置字体背景
      collapsible = TRUE, # box可折叠
      plotOutput("plot1", height = 250)
    ),
    G
    box(
      title = "Inputs",
      status = "warning", solidHeader = TRUE,
      "Box content here", br(), "More box content",
      sliderInput("slider", "Slider input:", 1, 100, 50),
      textInput("text", "Text input:")
    )

  )
)
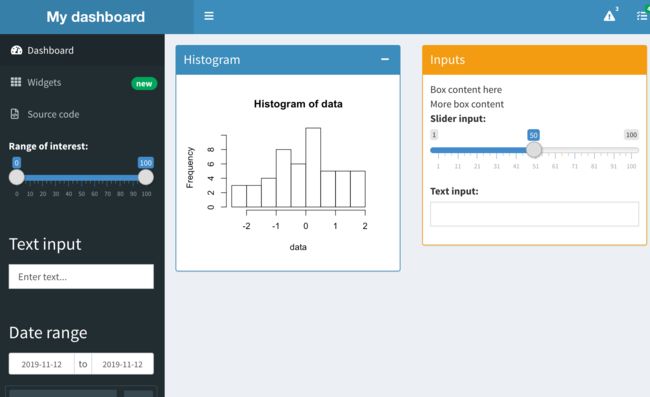
得到的效果就是:
2-3.2 还支持背景颜色: => background
box(
  title = "Histogram", background = "maroon", solidHeader = TRUE,
  plotOutput("plot4", height = 250)
),

box(
  title = "Inputs", background = "black",
  "Box content here", br(), "More box content",
  sliderInput("slider", "Slider input:", 1, 100, 50),
  textInput("text", "Text input:")
)
当然,除了一般的box ,还有包含多种标签的tabBox、显示统计信息的infoBox、主要显示数值的valueBox
2-3.3 设置含有多个标签的tabBox => fluidRow + tabBox + tabPanel
tabBox很像shiny中的tabsetPanel ,其中可以包含多个tab,如果给tab赋予id,那么就可以通过server.R对它进行调整;另外tabBox与上面介绍的box也有共同之处,比如可以设置height, width, and title ,另外通过side = "right"可以设置tab逆序显示【下面都会有介绍】
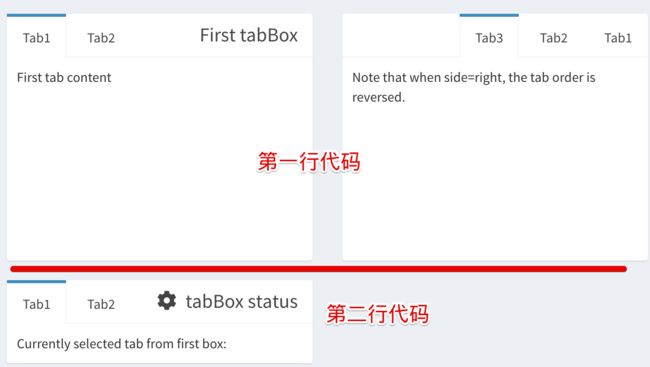
设置第一行的两个并列的tabBox:
# first row
fluidRow(
    tabBox(
      title = "First tabBox",
      id = "tabset1", height = "250px",
      tabPanel("Tab1", "First tab content"),
      tabPanel("Tab2", "Tab content 2")
    ),
    tabBox(
      side = "right", height = "250px",
      selected = "Tab3",
      tabPanel("Tab1", "Tab content 1"),
      tabPanel("Tab2", "Tab content 2"),
      tabPanel("Tab3", "Note that when side=right, the tab order is reversed.")
    )
  )
再设置一行:
# second row
fluidRow(
    tabBox(
      # Title can include an icon
      title = tagList(shiny::icon("gear"), "tabBox status"),
      tabPanel("Tab1",
               "Currently selected tab from first box:",
               verbatimTextOutput("tabset1Selected")
      ),
      tabPanel("Tab2", "Tab content 2")
    )
  )
2-3.4 设置显示数值和简略信息的infoBox
注意参数fill的设置是关于填充色的;
因为这个信息是变化的,所以server.R端提供了:renderInfoBox函数;ui.R端提供了:infoBoxOutput函数;
颜色的设置参考:https://rstudio.github.io/shinydashboard/appearance.html#statuses-and-colors
#####################
# 一个静态的infoBox
#####################
fluidRow(
    # A static infoBox
    infoBox("New Orders", 10 * 2, icon = icon("credit-card"),
            fill = T))

#####################
# 一个动态的infoBox,需要与server.R交互
#####################
# ui.R
fluidRow(
        infoBoxOutput("progressBox"),
    infoBoxOutput("approvalBox")
)
# server.R
function(input, output) {
  # 针对ui的progressBox
  output$progressBox <- renderInfoBox({
    infoBox(
      "Progress", paste0(25 + input$count, "%"), icon = icon("list"),
      color = "purple"
    )
  })
  # 针对ui的approvalBox
  output$approvalBox <- renderInfoBox({
    infoBox(
      "Approval", "80%", icon = icon("thumbs-up", lib = "glyphicon"),
      color = "yellow"
    )
  })
}
2-3.5 valueBox
和infoBox很像,但它着重体现数据。基本的设置和上面差不多,只是几个函数需要注意:
交互时的server端使用renderValueBox ,ui端使用valueBoxOutput
3 布局
Body部分就像一块画板,可以横着画也可以竖着,不同的小组件就是一幅幅简笔画,任务就是将它们排列到一起。画板的总宽度是12,于是可以横着排列3个width=4的组件
3-1 按行排列
所有的box必须包含在fluidRow(),而且一个fluidRow()函数就是一行的内容
# 第一行
fluidRow(
    box(title = "Box title", "Box content"),
    box(status = "warning", "Box content")
  ),

# 第二行
fluidRow(
    box(
      title = "Title 1", width = 4, solidHeader = TRUE,
      status = "primary","Box content"),
    box(
      title = "Title 2", width = 4, solidHeader = TRUE,
      "Box content"),
    box(
      title = "Title 1", width = 4, solidHeader = TRUE,
      status = "warning", "Box content")
  )
如果看到一行中生成的box 不一样高,那么可以使用height设置成一般高
box(title = "Box title", height = 300, "Box content")
3-2 按列排列
可以用fluidRow + column + box (参数 width = NULL)
例如:
fluidRow(
    column(width = 4,
      box(
        title = "Box title", width = NULL, status = "primary",
        "Box content"
      ))
3-3 行列混合
比如首先是按行排列,然后剩余的按列排列
# 首先是按行排1行
fluidRow(
    box(
      title = "Box title", width = 6, status = "primary",
      "Box content"
    ),
    box(
      status = "warning", width = 6,
      "Box content"
    )
  ),
# 剩余的按列排成3列
fluidRow(
  # 第1列
    column(width = 4,
      box(
        title = "Title 1", width = NULL, solidHeader = TRUE, # 标题框实心
        status = "primary", # 设置标题框颜色
        "Box content"
      ),
      box(
        width = NULL, background = "black", #没有标题框,只有字体背景颜色
        "A box with a solid black background"
      )
    ),
        # 第2列
    column(width = 4,
      box(
        title = "Title 3", width = NULL, solidHeader = TRUE, status = "warning",
        "Box content"
      ),
      box(
        title = "Title 5", width = NULL, background = "light-blue",
        "A box with a solid light-blue background"
      )
   ),
  # 第3列
  column(width = 4,
      box(
        title = "Title 2", width = NULL, solidHeader = TRUE,
        "Box content"
      ),
      box(
        title = "Title 6", width = NULL, background = "maroon",
        "A box with a solid maroon background"
      )
    )
)
4 外观设置
4-1 皮肤/主题
默认是蓝色,还有Black、Purple、Green、Red、Yellow
shinyUI(
  dashboardPage(
    skin = "blue",
    headerbar,
    sidebar,
    body
  )
)
4-2 长标题
如果标题很长的话,默认的设置不会匹配。可以用titleWidth进行设置
dashboardHeader(
      title = "Example of a long title that needs more space",
      titleWidth = 450
    )
另外如果想让标题和标题栏的颜色一致的话:
dashboardBody(
      # Also add some custom CSS to make the title background area the same
      # color as the rest of the header.
      tags$head(tags$style(HTML('
        .skin-blue .main-header .logo {
          background-color: #3c8dbc;
        }
        .skin-blue .main-header .logo:hover {
          background-color: #3c8dbc;
        }
      ')))
4-3 设置sidebar的宽度
可以调整成和标题等宽的
dashboardHeader(
      title = "Title and sidebar 350 pixels wide",
      titleWidth = 350
    )

dashboardSidebar(
      width = 350,
      sidebarMenu(
        menuItem("Menu Item")
      )
    )
4-4 设置图标icon
icon来自:Font-Awesome【默认】 and Glyphicons
- http://fontawesome.io/icons/
- http://getbootstrap.com/components/#glyphicons
4-5 可用的颜色
通过?validStatuses可以查看一个box的标题框颜色
更直接的方法是:?validColors设置color信息
欢迎关注我们的公众号~_~
我们是两个农转生信的小硕,打造生信星球,想让它成为一个不拽术语、通俗易懂的生信知识平台。需要帮助或提出意见请后台留言或发送邮件到[email protected]


