from sklearn impor tdatasets# 导入数据集模块
import matplotlib.pyplot as plt# 导入绘图模块
# 载入数据集
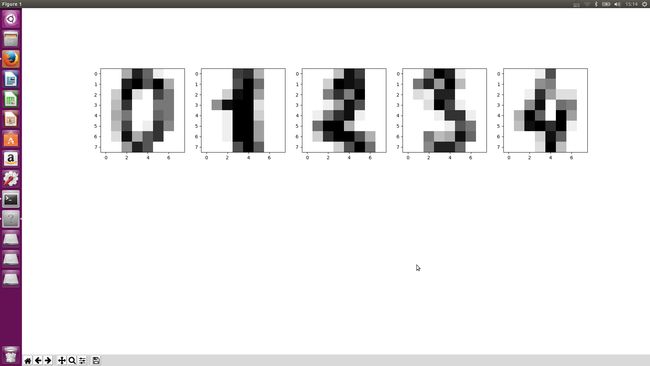
digits_data = datasets.load_digits()# 绘制数据集前 5 个手写数字的灰度图
for index, image in enumerate(digits_data.images[:5]):
plt.subplot(2,5, index+1)
plt.imshow(image, cmap=plt.cm.gray_r, interpolation='nearest')
plt.show()
from sklearn import datasets
from matplotlib import pyplot as plt
from sklearn import decomposition
from sklearn.cluster import KMeans
import numpy as np
digits_data = datasets.load_digits()
x = digits_data.data
y = digits_data.target
estimator = decomposition.PCA(n_components=2)
reduce_data = estimator.fit_transform(x)
model = KMeans(n_clusters=10)
model.fit(reduce_data)
x_min, x_max = reduce_data[:, 0].min() - 1, reduce_data[:, 0].max() + 1
y_min, y_max = reduce_data[:, 1].min() - 1, reduce_data[:, 1].max() + 1
xx, yy = np.meshgrid(np.arange(x_min, x_max, .05), np.arange(y_min, y_max, .05))
result = model.predict(np.c_[xx.ravel(), yy.ravel()])
result = result.reshape(xx.shape)
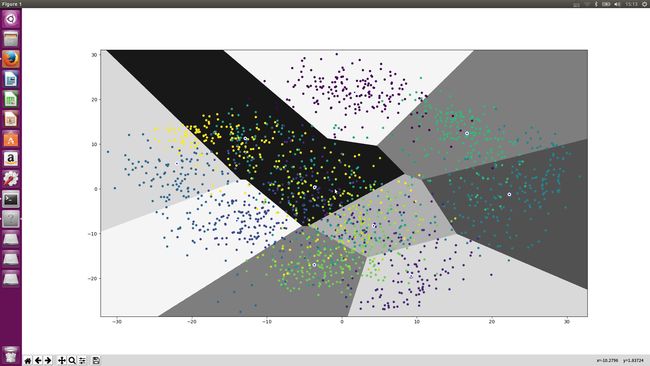
plt.contourf(xx, yy, result, cmap=plt.cm.Greys)
plt.scatter(reduce_data[:, 0], reduce_data[:, 1], c=y, s=15)
center = model.cluster_centers_
plt.scatter(center[:, 0], center[:, 1], marker='p', linewidths=2, color='b', edgecolors='w', zorder=20)
plt.xlim(x_min, x_max)
plt.ylim(y_min, y_max)
plt.show()