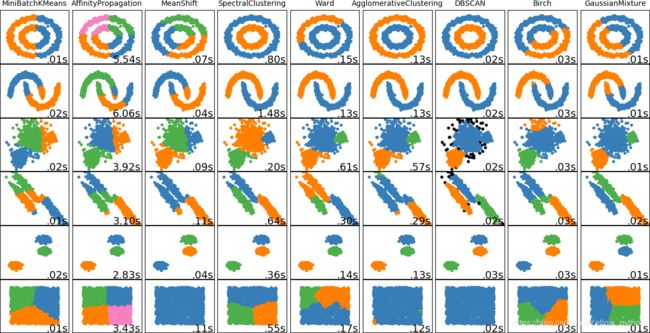
sklearn各聚类算法比较
文章目录
- 1、各聚类算法的比较
- 2、聚类评估
- 2.1、轮廓系数(Silhouette Coefficient)
- 2.2、DBSCAN
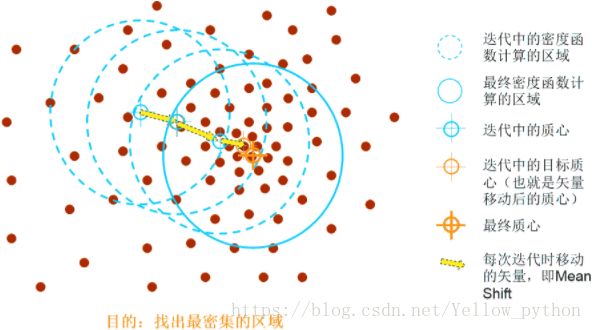
- 2.3、MeanShift
- 2.4、GMM
- 3、附录
1、各聚类算法的比较
from time import time
import numpy as np, matplotlib.pyplot as mp

from sklearn import cluster, datasets, mixture
from sklearn.neighbors import kneighbors_graph
from sklearn.preprocessing import StandardScaler  # 数据标准化
from itertools import cycle, islice

"""生成随机样本集"""
np.random.seed(0)  # 设定相同的随机环境,使每次生成的随机数相同

n_samples = 1500

noisy_circles = datasets.make_circles(n_samples=n_samples, factor=.5, noise=.05)
noisy_moons = datasets.make_moons(n_samples=n_samples, noise=.05)
blobs = datasets.make_blobs(n_samples=n_samples, random_state=8)
no_structure = np.random.rand(n_samples, 2), None

# 非均质分散的数据
random_state = 170
X, y = datasets.make_blobs(n_samples=n_samples, random_state=random_state)
transformation = [[0.6, -0.6], [-0.4, 0.8]]
X_aniso = np.dot(X, transformation)
aniso = (X_aniso, y)

# 方差各异的团
varied = datasets.make_blobs(n_samples=n_samples,
                             cluster_std=[1.0, 2.5, 0.5],
                             random_state=random_state)

"""设置聚类和绘图参数"""
mp.figure(figsize=(9 * 2 + 3, 12.5))
mp.subplots_adjust(left=.02, right=.98, bottom=.001, top=.96, wspace=.05, hspace=.01)
plot_num = 1

default_base = {'quantile': .3,  # 分位数
                'eps': .3,  # DBSCAN同类样本间最大距离
                'damping': .9,  # 近邻传播的阻尼因数
                'preference': -200,
                'n_neighbors': 10,
                'n_clusters': 3}

datasets = [
    (noisy_circles, {'damping': .77, 'preference': -240, 'quantile': .2, 'n_clusters': 2}),
    (noisy_moons, {'damping': .75, 'preference': -220, 'n_clusters': 2}),
    (varied, {'eps': .18, 'n_neighbors': 2}),
    (aniso, {'eps': .15, 'n_neighbors': 2}),
    (blobs, {}),
    (no_structure, {})]

for i_dataset, (dataset, algo_params) in enumerate(datasets):
    # 更新样本集特征对应的参数
    params = default_base.copy()
    params.update(algo_params)

    X, y = dataset

    # 数据标准化
    X = StandardScaler().fit_transform(X)

    # 估计均值漂移的带宽
    bandwidth = cluster.estimate_bandwidth(X, quantile=params['quantile'])

    # 层次聚类参数
    connectivity = kneighbors_graph(
        X, n_neighbors=params['n_neighbors'], include_self=False)  # 连接矩阵
    connectivity = 0.5 * (connectivity + connectivity.T)  # 使其对称化

    """创建各个聚类对象"""
    # 均值偏移
    ms = cluster.MeanShift(bandwidth=bandwidth, bin_seeding=True)
    # 小批Kmeans
    two_means = cluster.MiniBatchKMeans(n_clusters=params['n_clusters'])
    # 【ward linkage】层次聚类(离差平方和)
    ward = cluster.AgglomerativeClustering(
        n_clusters=params['n_clusters'], linkage='ward', connectivity=connectivity)
    # 谱聚类
    spectral = cluster.SpectralClustering(
        n_clusters=params['n_clusters'], eigen_solver='arpack', affinity="nearest_neighbors")
    # 基于密度
    dbscan = cluster.DBSCAN(eps=params['eps'])
    # 近邻传播
    affinity_propagation = cluster.AffinityPropagation(
        damping=params['damping'], preference=params['preference'])
    # 【average linkage】层次聚类(组间距离等于两组对象之间的平均距离)
    average_linkage = cluster.AgglomerativeClustering(
        linkage="average", affinity="cityblock",
        n_clusters=params['n_clusters'], connectivity=connectivity)
    # Balanced Iterative Reducing and Clustering Using Hierarchies
    birch = cluster.Birch(n_clusters=params['n_clusters'])
    # 高斯混合模型
    gmm = mixture.GaussianMixture(
        n_components=params['n_clusters'], covariance_type='full')

    clustering_algorithms = (
        ('MiniBatchKMeans', two_means),
        ('AffinityPropagation', affinity_propagation),
        ('MeanShift', ms),
        ('SpectralClustering', spectral),
        ('Ward', ward),
        ('AgglomerativeClustering', average_linkage),
        ('DBSCAN', dbscan),
        ('Birch', birch),
        ('GaussianMixture', gmm)
    )

    """绘图"""
    for name, algorithm in clustering_algorithms:
        t0 = time()
        algorithm.fit(X)
        t1 = time()

        if hasattr(algorithm, 'labels_'):
            y_pred = algorithm.labels_.astype(np.int)
        else:
            y_pred = algorithm.predict(X)

        mp.subplot(len(datasets), len(clustering_algorithms), plot_num)
        if i_dataset == 0:  # 第0行打印标题
            mp.title(name, size=10)
        colors = np.array(list(islice(cycle(['#377eb8', '#ff7f00', '#4daf4a',
                                             '#f781bf', '#a65628', '#984ea3',
                                             '#999999', '#e41a1c', '#dede00']),
                                      int(max(y_pred) + 1))))
        colors = np.append(colors, ["#000000"])  # 离群点(若有的话)设为黑色
        mp.scatter(X[:, 0], X[:, 1], s=10, color=colors[y_pred])

        mp.xlim(-2.5, 2.5)
        mp.ylim(-2.5, 2.5)
        mp.xticks(())
        mp.yticks(())
        mp.text(.99, .01, ('%.2fs' % (t1 - t0)).lstrip('0'),
                transform=mp.gca().transAxes, size=14, horizontalalignment='right')
        plot_num += 1
mp.show()
2、聚类评估
2.1、轮廓系数(Silhouette Coefficient)

a ( i ) a(i) a(i):样本 i i i到同簇其他样本的平均距离
b ( i ) b(i) b(i):样本 i i i的簇间不相似度
s ( i ) s(i) s(i)接近1:样本 i i i聚类合理
s ( i ) s(i) s(i)接近-1:样本 i i i更适合分到别的簇
s ( i ) s(i) s(i)接近0:样本 i i i在两个簇的边界上
from
sklearn.metricsimportsilhouette_score
2.2、DBSCAN
- Density-Based Spatial Clustering of Applications with Noise
- 优点:
-
1、不需要事先知道要形成的簇类的数量
2、可发现任意形状的簇类
3、可识别出 噪声点 - 缺点:
-
1、面对高维数据,距离参数难以调节
2、较耗计算资源
3、各簇密度差别较大时,聚类质量较差
from sklearn.cluster import DBSCAN
from sklearn import metrics  # 聚类评估
import numpy as np, matplotlib.pyplot as mp
# 创建数据
X = np.array([[1, 4], [6, 8], [1, 2], [6, 7], [5, 3], [5, 8], [2, 3], [8, 7], [2, 2], [4, 2], [8, 6], [7, 8], [5, 1]])
radii = [1.414, 1.415, 2]
for i in range(3):
    # DBSCAN:基于密度的聚类方法
    labels = DBSCAN(eps=radii[i], min_samples=2).fit(X).labels_
    # 可视化
    mp.subplot(1, 3, i + 1)
    colors = ['red', 'blue', 'green', 'purple', 'orange', 'black']
    for x, l in zip(X, labels):
        mp.scatter(x[0], x[1], c=colors[l])
    # 轮廓系数(Silhouette Coefficient)
    score = metrics.silhouette_score(X, labels)
    print('eps = %.3f 的聚类得分是:' % radii[i], score)
mp.tight_layout()
mp.show()
- 打印结果
-
eps = 1.414 的聚类得分是: 0.36739772676132704
eps = 1.415 的聚类得分是: 0.6018738849706604
eps = 2.000 的聚类得分是: 0.6431136276704154
2.3、MeanShift
# 创建数据 -------------------------------------------------------------------------------------------------------------
from sklearn.datasets.samples_generator import make_blobs
centers = [[0, 0, 0], [6, 4, 1], [9, 9, 9]]
X, _ = make_blobs(n_samples=100, centers=centers, cluster_std=2, random_state=0)
# 均值偏移 -------------------------------------------------------------------------------------------------------------
from sklearn.cluster import MeanShift, estimate_bandwidth
bandwidth = estimate_bandwidth(X, quantile=0.2, n_samples=50)  # 带宽(分位点、样本数)
ms = MeanShift(bandwidth=bandwidth, bin_seeding=True).fit(X)
# 聚类标签
labels = ms.labels_
# 簇的中心
centers = ms.cluster_centers_
print(centers)
# 聚类评估 ---------------------------------------------------------------------------------------------------------
from sklearn import metrics
score = metrics.silhouette_score(X, labels)
print('聚类得分是:%.2f' % score)
# 可视化 -----------------------------------------------------------------------------------------------------------
import matplotlib.pyplot as mp
from mpl_toolkits import mplot3d
fig = mp.figure()
ax = mplot3d.Axes3D(fig)
colors = ['red', 'blue', 'green', 'purple', 'orange', 'cyan', 'gray', 'brown', 'yellow', 'pink', 'black']
# 样本集聚类结果
for x, l in zip(X, labels):
    ax.scatter(x[0], x[1], x[2], c=colors[l], s=120, alpha=0.2)
# 簇的中心
for i in range(len(centers)):
    ax.scatter(centers[i][0], centers[i][1], centers[i][2], c=colors[i], s=200, marker='x')
mp.show()
2.4、GMM
- 高斯混合模型
- 将事物分解为若干的基于高斯概率密度函数形成的模型
import numpy as np, matplotlib.pyplot as mp
from sklearn.cluster import KMeans  # K-means
from sklearn.mixture import GaussianMixture  # 高斯混合模型
from sklearn.datasets import make_blobs
np.random.seed(8)  # 设定随机环境

# 创建随机样本
X, _ = make_blobs(centers=[[0, 0]])
X1 = np.dot(X, [[4, 1], [1, 1]])
X2 = np.dot(X[:50], [[1, 1], [1, -5]]) - 2
X = np.concatenate((X1, X2))
y = [0] * 100 + [1] * 50

# KMeans
kmeans = KMeans(n_clusters=2)
y_kmeans = kmeans.fit(X).predict(X)
# GMM
gmm = GaussianMixture(n_components=2)
y_gmm = gmm.fit(X).predict(X)

# 绘图
for e, labels in enumerate([y, y_kmeans, y_gmm], 1):
    mp.subplot(1, 3, e)
    mp.scatter(X[:, 0], X[:, 1], c=labels, s=40, alpha=0.6)
    mp.xticks(())
    mp.yticks(())
mp.show()
3、附录
| En | Cn |
|---|---|
| cluster | n. 簇;v 群聚 |
| radius | 半径(复数:radii) |
| cyan | 蓝绿色 |
| density | 密度 |
| spatial | 空间的 |
| distance | 距离 |
| silhouette | 轮廓 |
| coefficient | 系数;合作的 |
| shift | n. 移动;vi. 转换;vt. 转移 |
| bandwidth | 带宽 |
| quantile | n. [计] 分位数;分位点 |
| hierarchy | 层级 |


