小波分析与去噪
基础知识和小波简介
平稳信号和非平稳信号
- 平稳信号是指信号的方差等特征与时间无关,非平稳信号则相反。
- 自然界中大多是非平稳信号
傅立叶变换的局限性
- 傅立叶变换是将时域信号转化为频域信号,进行分析,对于信号 x(t) ,其傅立叶变换形式为
X(ω)=∫∞−∞f(t)e−iwtdt
* 对信号的傅立叶变换相当于将信号转化为很多具有特定权值的正弦波的和,它只能表征信号的频域特征,无法同时表达信号的时频特征
* 傅立叶变化无法对非平稳信号做准确的描述。短时傅立叶变换可以做到,即对傅立叶变换进行加窗,但是窗口大小确定,局限性很大。
* 对于信号来说,低频段往往能够表征信号的整体特征,高频段能够表征信号的突变特征(对于图像来说就是边缘),我们希望在低频段能够更高的频率分辨率,在高频段可以有较低的频率分辨率,对于这些,短时傅立叶变换无法做到,小波变换可以做到。
小波变换
- 小波是小区域、长度有限、均值为0的波形。小波分析就是选取一个基小波或者母小波(小波核),对其进行平移和伸缩等变换,这套小波可以构成嵌套的空间,再将信号投影到这些空间中,以观察在不同子空间中的特性。
- 小波核具有以下特性
- 可分离性、尺度可变性和平移性
- 多分辨率的一致性
- 正交性
- 目前有很多种小波核函数可以使用
小波去噪的主要种类
参考链接:http://www.cnblogs.com/linkr/articles/2299707.html
小波去噪的方法主要分为三类
- 小波变换模极大值去噪法:根据信号和噪声在小波在小波变换各尺度上的不同传播特性,剔除由噪声产生的模极大值点,保留信号对应的模极大值点,然后利用所余模极大值点重构小波系数,进而恢复信号。
- 小波系数相关性去噪法:对含噪信号作小波变换之后,计算相邻尺度间小波系数的相关性,根据相关性的大小区别小波系数的类型,从而进行取舍,然后直接重构信号。
- 小波变换阈值去噪法:信号对应的小波系数包含有信号的重要信息,其幅值比较大,但是数目较少,而噪声对应的小波系数是一致分布的,个数较多,但是幅值较小。通过这种方法进行去噪的方法比较经典,阈值的选取有软、硬阈值等,这种方法已经做得相当全了,主要步骤有三步
- 计算含噪声信号的小波变换,选择合适的小波基和小波分解层数 J ,将图像进行小波分解,得到相应的小波分解系数。
- 对分解后的高频系数进行阈值量化,对于从1到 J 的每一层,选择一个适当的阈值和合适的阈值函数,将分解得到的高频系数进行阈值量化,得到估计小波系数。
- 进行小波逆变换,根据小波分解后的第 J 层的低频系数(尺度系数)和经过阈值量化处理的各层高频系数(小波系数)。再利用重构算法进行小波重构,得到去噪后信号。
代码与结果
代码
%%
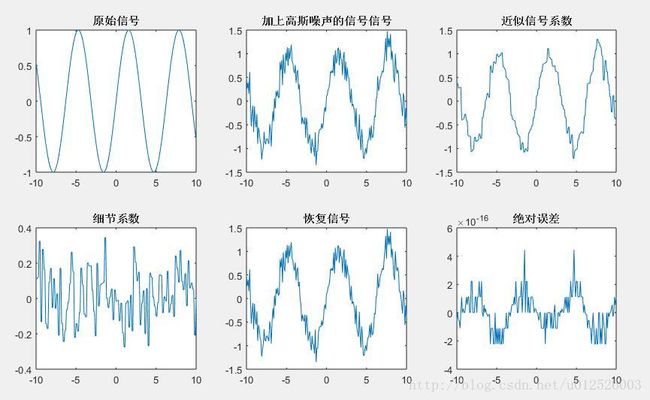
% 一阶小波去噪分解
% reference : http://blog.csdn.net/cai2016/article/details/52982397
clc,clear,close all

t = -10:.1:10;
% 干净的信号
ori_sig = sin(t);
% 加上噪声之后的信号
signal = ori_sig + 0.2 * randn( size(t) );
% 信号长度

% 1层小波分解
sigLen = length( signal );
[cA1, cD1] = dwt( signal, 'db1' );
% 系数构建
% A1 是信号的近似系数
% D1 是信号的细节系数
% 在这里 A1就可以近似地被视为信号去噪后结果,而D1可以被视为噪声信号
A1 = idwt( cA1, [], 'db1', sigLen );
D1 = idwt( cD1, [], 'db1', sigLen );
% 用近似系数和细节系数进行重建
A0 = idwt( cA1, cD1, 'db1', sigLen );
% 信号误差
sigErr = signal - A0;

figure
subplot(231),plot(t, ori_sig),title('原始信号')
subplot(232),plot(t, signal),title('加上高斯噪声的信号信号')
subplot(233),plot(t, A1),title('近似信号系数')
subplot(234),plot(t, D1),title('细节系数')
subplot(235),plot(t, A0),title('恢复信号')
subplot(236),plot(t, sigErr),title('绝对误差')

%% wnoise去噪分解
% reference : http://blog.sina.com.cn/s/blog_506122ec0100817o.html
sqrt_snr = 3;
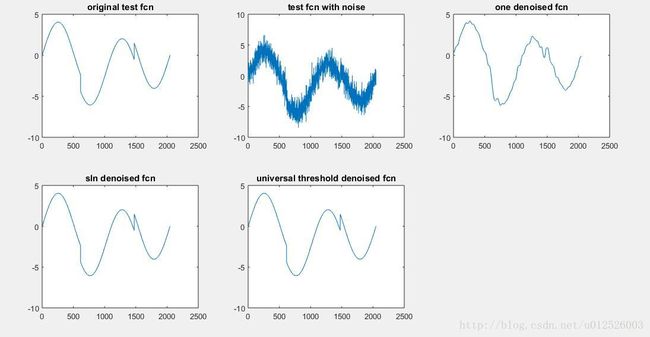
[x, xn] = wnoise( 3, 11, sqrt_snr );

lev = 5;
% 利用sym8小波信号对信号进行分解,在第5层上,利用启发式sure阈值选择法对信号去噪
xdOne = wden( xn, 'heursure', 's', 'one', lev, 'sym8' );
% 利用sym8对信号分解,但是使用软sure阈值选择选择算法对信号去噪
xdSln = wden(x, 'heursure', 's', 'sln', lev, 'sym8');
% sym8小波对信号分解条件,但用固定域值选择算法去噪
xdSqt = wden( x, 'sqtwolog', 's', 'sln', lev, 'sym8' );

figure
subplot(231),plot(x), title('original test fcn')
subplot(232),plot(xn), title('test fcn with noise')
subplot(233),plot(xdOne), title('one denoised fcn')
subplot(234),plot(xdSln), title('sln denoised fcn')
subplot(235),plot(xdSqt), title('universal threshold denoised fcn')

%% 图像小波去噪
% reference : http://blog.csdn.net/mingtian715/article/details/60873875
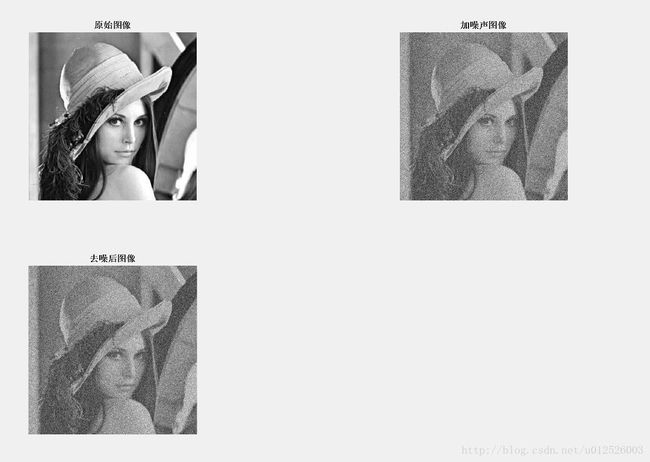
img = imread( 'lena.bmp' );
if size(img, 3) > 1
    img = rgb2gray( img );
end
img = double( img ) ;

imgN = img + 50*randn( size(img) );
% 利用小波函数coif2对图像XX进行2层分解
[c, l] = wavedec2( imgN, 2, 'coif2' );
% 重构第2层图像的近似系数
A2 = wrcoef( 'a', c, l, 'coif2', 2 );

% 设置尺度向量
n = [1, 2];
% 设置阈值向量
p = [ 10.28, 24.08 ]  ;
nc = wthcoef2( 'h', c, l, n, p, 's' );
X1=waverec2(nc,l,'coif2');    %图像的二维小波重构

figure
subplot(221),imshow(img, []), title('原始图像')
subplot(222),imshow( imgN, [] ), title('加噪声图像')
subplot(223),imshow( X1, [] ), title('去噪后图像')


