python机器学习手写算法系列——决策树
本系列另一篇文章《线性回归》
https://blog.csdn.net/juwikuang/article/details/78420337
本文源代码地址:
https://github.com/juwikuang/machine_learning_step_by_step
你也可以直接看源代码,我用了jupyter notebook,源代码中有详细的说明。
数据集
数据来源于我的Github项目。 Data from here:
https://github.com/juwikuang/china_job_survey
我爬了全国的招聘信息,然后以上海为例子,选择了收入最高的25%和最低的25%,以他们作为两类。通过机器学习的分类模型,找出程序员如何成功(成为收入最高的25%)的秘诀。
最近正好朋友介绍了一本书,成功的公式。它也是通过大量数据,找出成功的公式的。我决心好好分析数据,找出程序员成功的Formula。
数据集已经通过GitHub共享。
字段说明
dataset 说明,
low=工资是否低,low=0表示高工资,low=1表示低工资。这是我们的label,或者说y,或者叫应变量。其他的叫features,或者叫X,或者叫自变量。
注意我这里y是小写,X是大写,因为y是vector,X是matrix
ageism=是否有年龄歧视,我检查招聘信息里面,是否有【岁】字,是则是年龄歧视。
career_algorithm, career_architect, career_software_engineer=这里对职业(career),进行了one-hot-encoding。
其他100多个feature就不一一解释了。这里并不是写论文,等他们出现了再说。
为了简单起见,所有的feature都是bool型的
决策树
决策树其实很容易理解,我们先看看相亲决策树吧。
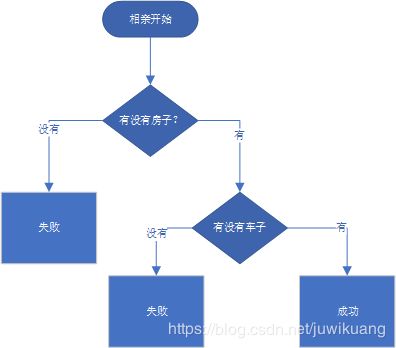
对,这就是决策树。现在你有了感性认识了。
决策树Decision Tree(DT),是通过某种选择机制(entropy或者gini),找到能够把数据分成正负两组的特征。往往需要多次划分,才能得到满意的结果,所以,最后得到的模型,看起来就像一颗树。所以叫决策树。
这个算法,概括的来说,就是不断的寻找一个最优解(最优特征+最优分割点),把数据集一分为二,使集合纯度最高(label为true的和false尽量分开),直到分了n层。
具体来说,就是:
加载数据,遍历每个特征,用每个特征去划分数据集。
这里的特征,可能是bool型的,那就最好了,true的一组,false的一组,直接分成了两组。
也可能是数值型的,那就要把数据从小到大排序,不断的增大切割点的数值,只到找到最优的解。
如果特征是字典型的(categorical,如天气分为晴天,阴天,下雨)的,现在一般是用one-hot-encoding转化成几个bool型。
每个特征的最优解,都是用entropy或者gini表示的,等遍历完了所有的特征,就比较他们的entrop或者gini,选出最优的。
用最优解把数据集一分为二,再对子数据集运用上面的步骤,直到决策树已经达到了一定深度。
决策树的flow chart

集合纯度
集合纯度是决策树的难点重点,我们需要找到一种数学方法,去计算集合的纯度。常用的有熵(entropy)和基尼(gini)。
Entropy
根据维基百科,信息熵(Information Entropy)的数学定义为:
The function from wikipedia:
![]()
def information_entropy(counts):
    percentages = counts/np.sum(counts)
    S=0
    for p in percentages:
        if p==0:
            continue
        S=S-(p*np.log2(p))
    return S
这里p表示百分比,S表示信息熵。S越小,数据集的纯度越高。以我们的数据集为例,假如所有人都是高收入,则S等于0,这时S最小,数据集最纯。
information_entropy([0,1])
返回值0.0
information_entropy([1/2,1/2])
返回值1.0
我们的数据集呢?我们算一下
n_high=2244 #有2244人拿高工资
n_low=2647 #有2647人拿低工资
information_entropy([n_low, n_high])
返回值0.995
可见,信息熵接近于1,说明我们数据集的纯度非常低。 The information entropy is close to one, indicating it is very impure.
假如我们用会不会python,把数据集切开。
data_python=data[data.pl_python==1]
data_not_python=data[~data.pl_python==1]
def data_entropy(data):
    n_rows=data.shape[0]
    n_low=data[data.low==1].shape[0]
    n_high=n_rows-n_low
    return information_entropy([n_low, n_high])
entropy_python=data_entropy(data_python)
entropy_python
返回值0.889729694070529
entropy_not_python=data_entropy(data_not_python)
entropy_not_python
返回值0.9810034249081002
我们把上面的两个组的熵,按照他们占原数据集的比例,计算出新平均的信息熵如下:
S_new = data_python.shape[0]/data.shape[0] * entropy_python + data_not_python.shape[0]/data.shape[0] * entropy_not_python
S_new
返回值0.9677537113741245
我们把上面的计算,总结一个公式:
def data_entropy2(data1, data2):
    entrop1=data_entropy(data1)
    entrop2=data_entropy(data2)
    n1=data1.shape[0]
    n2=data2.shape[0]
    n=n1+n2
    return n1/n*entrop1+n2/n*entrop2
data_entropy2(data_python, data_not_python)
返回值0.9677537113741245
可见,我们用python去划分数据集以后,信息熵变小了,既数据集更纯了。而变小的程度可以用两者的差值表示,既:
Gain=S-S_new
Gain
返回值0.027343402749915202
我们把这个差值叫做信息增益。我们每次切割数据集,就是要找出这样一个特征,以它划分数据集,得到的信息增益Gain最大。
现在我们可以去遍历所有的特征,看看谁的Gain最大。
def find_best_feature(data, label):
    X=data.drop(label, axis=1)
    min_entropy=1
    col_selected=''
    data_positive_found=None
    data_negative_found=None
    for col in X.columns:
        data_positive=data[data[col]==1]
        data_negative=data[data[col]==0]
        if data_positive.shape[0]==0:
            continue
        if data_negative.shape[0]==0:
            continue
        entropy=data_entropy2(data_positive, data_negative)
        #print(gain,entropy,entropy_new)
        if entropy<min_entropy:
            min_entropy=entropy
            col_selected=col
            data_positive_found=data_positive
            data_negative_found=data_negative
    return col_selected, min_entropy, data_positive_found, data_negative_found
这里,我们得到了,获得高薪的最主要因素,学历!既然这里出现学历了,说明一下我们的数据集包含四种学历(大专,本科,硕士,博士)。associate这个单词表示大专。
经过计算,大专学历,拿到高薪的比例为23%,而非本科及以上为55%。所以,学历很重要。
基尼系数 Gini Impurity
我们也可以用Gini Impurity来判断。这里只给出公式。假设有两个组,平均分配,则Gini Impurity是1-(1/2)2-(1/2)2=1/2。而如果全部分配到一边1-0-1=0.所以,gini impurity越小,数据纯度越高。所以它不叫purity(纯度),而叫Impurity(不纯度)。
图片来源于Wikipedia

def gini_impurity(counts):
    p_list=counts/np.sum(counts)
    return 1-np.sum(p_list*p_list)
gini_impurity([0,100])
返回值0.0
gini_impurity([50,50])
返回值0.5
基尼系数简单介绍到这里。
决策树算法
有了上面的基础,我们就可以写决策树算法了。
获得训练集和测试数据集
msk = np.random.rand(len(data)) < 0.8
data_train=data[msk]
data_test=data[~msk]
X_train=data_train.drop('low', axis=1)
y_train=data_train.low
X_test=data_test.drop('low', axis=1)
y_test=data_test.low
class Branch:
    no=0
    depth=1
    column=''
    entropy=0
    samples=0
    value=[]

    branch_positive=None
    branch_negative=None
    no_positive=0
    no_negative=0

number=0

def decision_tree_inner(data, label, depth, max_depth=3):
    global number
    branch = Branch()
    branch.no=number
    number=number+1
    branch.depth=depth

    branch.samples=data.shape[0]
    n_positive=data[data[label]==1].shape[0]
    branch.value=[branch.samples-n_positive,n_positive]
    branch.entropy=information_entropy(branch.value)
    best_feature = find_best_feature(data, label)
    branch.column=best_feature[0]
    new_entropy=best_feature[1]
    if depth==max_depth or branch.column=='':
        branch.no_positive=number
        number=number+1
        branch.no_negative=number
        number=number+1
        return branch
    else:
        data_negative=best_feature[3]
        branch.branch_negative=decision_tree_inner(data_negative, label, depth+1, max_depth=max_depth)
        data_positive=best_feature[2]
        branch.branch_positive=decision_tree_inner(data_positive, label, depth+1, max_depth=max_depth)

        return branch

def decision_tree(data, label, max_depth=3):
    number=0
    entropy=data_entropy(data)
    tree=decision_tree_inner(data, label, 0, max_depth=3)
    return tree
my_dt = decision_tree(data_train, 'low', max_depth=2)
Visualization 可视化
此处代码省略,有兴趣的看Github源代码
用Scikit-Learn里面的决策树
训练模型
from sklearn.tree import DecisionTreeClassifier
dt = DecisionTreeClassifier(criterion='entropy', max_depth=3)
model=dt.fit(X_train, y_train)
测试模型
分类模型的评分evaluate比较简单,分类正确的,除以所有的数据,得到正确率accuracy,既模型分数。
model.score(X_train, y_train)
返回值0.64
model.score(X_test, y_test)
返回值0.66
可视化
决策树最大的优点,就是可以打出一张图来。
from sklearn import tree
import graphviz
dot_data = tree.export_graphviz(model, out_file=None,
                      feature_names=X_train.columns,
                      class_names=['high','low'],
                      filled=True, rounded=True,
                      special_characters=True)
new_dot_data=dot_data.replace('True','no').replace('False','yes').replace(' ≤ 0.5','?')
graph = graphviz.Source(new_dot_data)
graph.render('./data/dt_sklearn', format='png')
graph
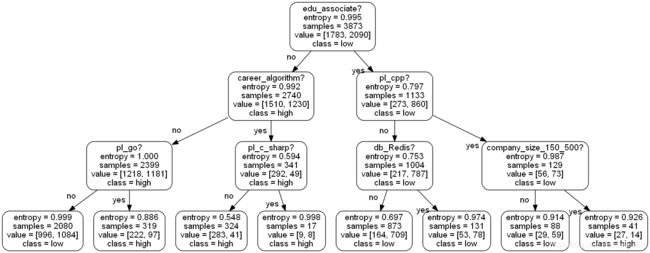
输出图片如下:
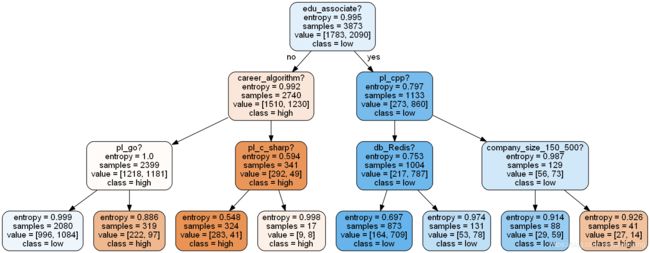
比较与验证
比较scikit-learn和我打出的图,两者数据完全一致。不信,你们看,左下角都是996!
结果解释
我们在学校里,做完模型以后,需要对结果给与说明的。目的是用非专业人士听得懂的语言,去解释我们的研究结果。
用模型可见,学历是获得高薪(前25%)最重要的前提。如果你的学历是专科,你获得高薪的机会就会小很多。如果你的学历是本科,硕士,甚至博士,那么你获得高薪的机会就会大得多。
如果,你是算法工程师,那么你拿高薪的机会也会大大增加。
大专毕业生,如果去大公司,搞C++,也能拿到高薪。
你对照一下决策树图,看看是不是这么回事。
决策树优缺点
决策树虽然简单易懂,还能形成一张图。但是它测准确率不是太高。实际工作中,很多时候我们的分类模型都是用Gradient Boosting Tree或者Extreme Gradient Boosting Tree(XGBT)训练出来的。尤其大家都把XGBT叫做神器。
当然,千万别因为我说了这句话,你做项目的时候就直接用XGBT,而忽略其他的分类算法。可能会被老板骂哦。。。要知道,不同的算法对于不同的数据集,他们的表现(performance)是不同的。
不过,无论是XGBT,还是随机森林,他们的基础都是决策树,都是用gini或者entropy来判断数据集的纯度。建议你看完本文以后,自己去试着写一下entropy函数。
参考 Reference
Decision Tree:
https://en.wikipedia.org/wiki/Decision_tree
Gini Impurity:
https://en.wikipedia.org/wiki/Decision_tree_learning#Gini_impurity
Entropy:
https://en.wikipedia.org/wiki/Entropy_(information_theory)
python机器学习手写算法系列
完整源代码:
https://github.com/juwikuang/machine_learning_step_by_step
欢迎阅读本系列其他文章:
《python机器学习手写算法系列——线性回归》
《python机器学习手写算法系列——逻辑回归》
《python机器学习手写算法系列——决策树》
《python机器学习手写算法系列——kmeans聚类》