Feature Engineering for Machine Learning 机器学习中的特征工程(二)
第二章是Fancy Tricks with Simple Numbers
目录如下:
(1) Scalars, vectors, and Spaces
(2) Dealing with Counts
(3) Log Transformation
(4) Feature Scaling or Normalization
(5) Interaction Features
(6) Feature Selection
本章介绍的是对于数值的处理技巧。数值型的数据首先可以观察数据的正负,跨度(scale),对于采用欧式距离的模型,对数据进行标准化(normalize)可以使输出在期望的跨度。
逻辑表达式对输入数据的跨度不敏感。决策树模型包含输入特征的阶跃函数,因此,基于空间分割的树模型(决策树,梯度提升树,随机森林)是对输入数据的跨度不敏感,唯一例外的是输入的跨度会随时间增大。
考虑数值的分布也很重要。比如,线性回归模型的训练过程假设预测误差是高斯分布的,但是当预测目标扩展到几个数量级就不好了。解决这个问题的一种方式是做对数变换或指数变换。
另外,还可以对多个特征组合成更复杂的特征,从而使得模型更简单,易于训练,同时使得输出结果更好。复杂特征是统计模型的输出,这叫作“model stacking”。
(1) Scalars, vectors, and Spaces
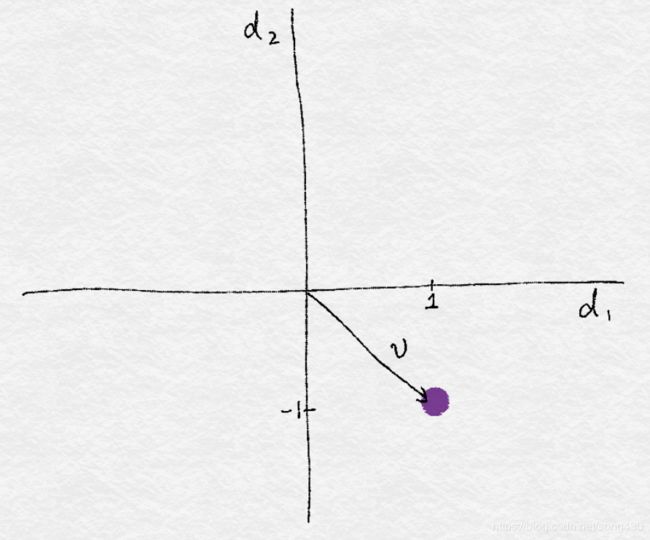
一个单个的数字被称为标量(scalars),一个标量列表被称为向量(vector)。一个向量通常可以可视化成空间中的一个点,比如向量 v = [ 1 , − 1 ] v=[1, -1] v=[1,−1] ,可以表示成下图。
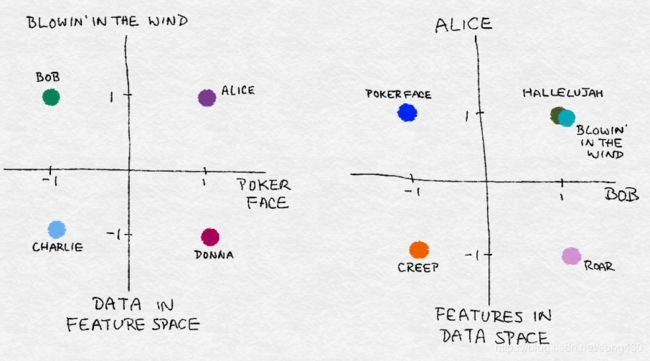
在数据的世界中,抽象的向量和特征维度都是具有实际意义的,每一首歌都是一个特征,1表示喜欢,-1表示不喜欢,收集的数据就可以可视化成特征空间中的点云。
下面左边的图是2个特征,4个样本。右边是4个特征,2个样本(Alice, Bob)。
(2) Dealing with Counts
在现今这个大数据时代,数据可以快速增长而不受约束,可能就会包含一些极值,最好检查并确定是否将数据保留为原始数字,或者转换成二进制来指示它们的存在,或者分成更粗的粒度。
Binarization(二值化)
Echo Nest Taste Profile subset包含百万用户的数据,包括用户在Echo Nest上的听歌历史,这份数据集的统计特征包括有超过48万的用户ID,歌曲ID,和听歌次数,包含1019318个用户和384546首歌。假设我们的任务是设计一个推荐系统,遇到的首要问题就是预测一个用户对某首歌的喜爱程度。如果一个用户听某首歌听了很多遍,就意味着用户喜欢这首歌。然而,数据表明,尽管99%的听歌次数在24次以下,但仍然有歌曲被听上千次,最大值是9667次。如果我们预测实际的听歌次数,模型可能就会偏离。
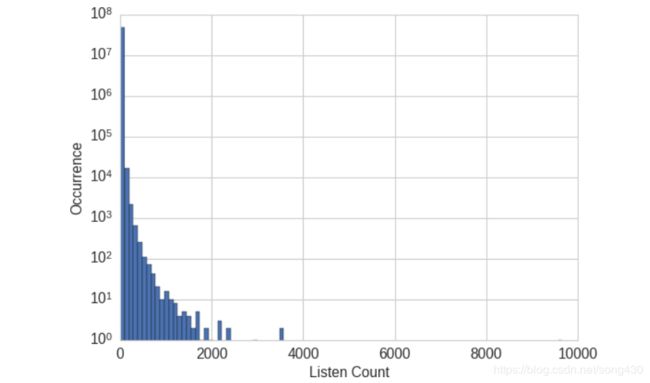
在这么大的数据集中,原始的收听计数并不是用户品位的鲁棒的衡量标准,因为用户具有不同的收听习惯,有人可能会把喜欢的歌放在无限循环上,有人可能只在特殊时刻欣赏歌曲。我们不能说一个听了20次歌曲的人要比听了10次的人,喜爱程度变成了2倍。
更鲁棒的表示是对计数进行二值化,大于等于1的所有计数都表示成喜欢,换句话说,如果用户听某首歌至少听过一次,就表示成喜欢,这样,模型就不需要花费时间来预测原始计数之间的差异。
import pandas as pd
listen_count = pd.read_csv('millionsong/train_triplets.txt.zip', header=None, delimiter='\t')
# The table contains user-song-count triplets. Only nonzero counts are
# included. Hence, to binarize the count, we just need to set the entire
# count column to 1.
listen_count[2] = 1
Quantization or Binning(量化或分箱)
我们选取了Yelp dataset challenge round 6的数据,做一个小的分类数据集,Yelp数据集包含北美和欧洲10多个城市的企业用户评论。每一个企业都标有0个或多个类别。
Yelp评论数据集 (round6)
##782个企业分类
##数据集包含1569264个评论和61184个公司
##餐饮(990627个评论)和住宿(210028个评论)是最大的分类
##没有企业同时属于餐饮和住宿
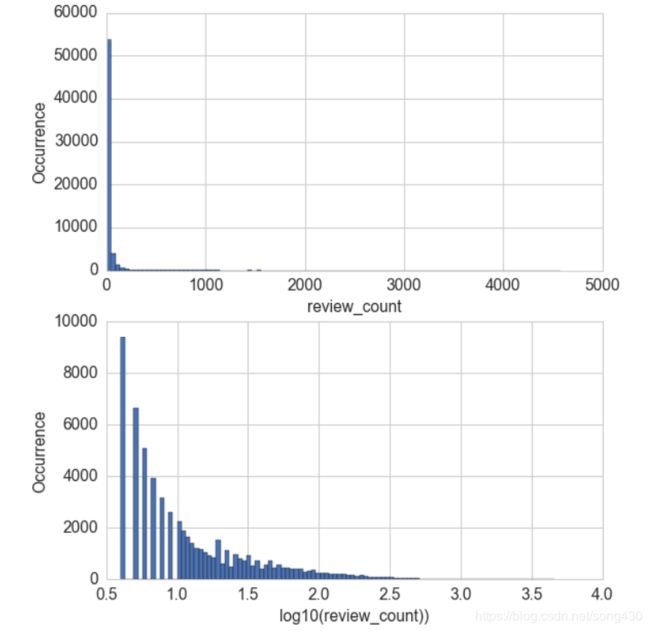
每个公司都有一个评论数,假设我们的任务是预测一个用户给企业的评级,评论数可能是一个有用的输入,现在的问题是,我们应该使用原始数据还是进一步处理?下面的代码产生了所有公司评论数的直方图,我们看到,和上面相似,大多数公司评论数都很少,但有些企业有上千个评论。
import pandas as pd
import json
# Load the data about businesses
biz_file = open('yelp_academic_dataset_business.json')
biz_df = pd.DataFrame([json.loads(x) for x in biz_file.readlines()])
biz_file.close()
import matplotlib.pyplot as plt
import seaborn as sns
# Plot the histogram of the review counts
sns.set_style('whitegrid')
fig, ax = plt.subplots()
biz_df['review_count'].hist(ax=ax, bins=100)
ax.set_yscale('log')
ax.tick_params(labelsize=14)
ax.set_xlabel('Review Count', fontsize=14)
ax.set_ylabel('Occurrence', fontsize=14)

对许多模型而言,横跨几个数量级的数据输入是有问题的,在线性模型中,相同的线性系数必须适用于所有可能的数据输入,大数也可能对无监督学习造成破坏,如k均值聚类,其使用欧式距离作为相似函数来测量数据点之间的相似性,输入向量中的一个元素中的大数将超过所有其他元素中的相似性,这可能会导致整个相似性度量的丢失。
一种解决方案是通过量化计数来包含比例。 换句话说,我们将计数分组到箱中,并除去实际的计数值。 量化将连续数字映射到离散数字。 我们可以将离散化的数字看作是一个有序的二进制序列,代表一种强度的度量。
为了量化数据,我们必须决定每组有多宽,有两种分组方式,固定宽度和自动宽度。
使用固定宽度,每一组(bin)就包含特定的数字范围,范围可以自定义设计或自动分段,并且可以线性缩放或按指数缩放。例如:我们可以把年龄十年为一组,第一组0-9岁,第二组10-19岁。
import numpy as np
# Generate 20 random integers uniformly between 0 and 99
small_counts = np.random.randint(0, 100, 20)
small_counts
array([30, 64, 49, 26, 69, 23, 56, 7, 69, 67, 87, 14, 67, 33, 88, 77, 75,
47, 44, 93])
# Map to evenly spaced bins 0-9 by division
np.floor_divide(small_counts, 10)
array([3, 6, 4, 2, 6, 2, 5, 0, 6, 6, 8, 1, 6, 3, 8, 7, 7, 4, 4, 9], dtype=int32)
# An array of counts that span several magnitudes
large_counts = [296, 8286, 64011, 80, 3, 725, 867, 2215, 7689, 11495, 91897,
... 44, 28, 7971, 926, 122, 22222]
# Map to exponential-width bins via the log function
np.floor(np.log10(large_counts))
array([ 2., 3., 4., 1., 0., 2., 2., 3., 3., 4., 4., 1., 1.,
3., 2., 2., 4.])
分位数分箱(quantile binning)
固定宽度很容易计算,但有时候可能会有空箱的存在,这可以基于数据的分布自适应的定位箱来解决。可以使用分布的分位数来完成。
分位数是将数据分成相等部分的值。 例如,中位数将数据分成两半; 一半的数据比中位数小。 四分位数将数据分为四分之一,十分位数分为十分之一等。下面的代码演示了如何计算Yelp计数的十分位数,图将十分位数叠加在直方图上。 这样可以更清晰地了解偏向较小计数的偏差。
deciles = biz_df['review_count'].quantile([.1, .2, .3, .4, .5, .6, .7, .8, .9])
deciles
0.1 3.0
0.2 4.0
0.3 5.0
0.4 6.0
0.5 8.0
0.6 12.0
0.7 17.0
0.8 28.0
0.9 58.0
Name: review_count, dtype: float64
# Visualize the deciles on the histogram
sns.set_style('whitegrid')
fig, ax = plt.subplots()
biz_df['review_count'].hist(ax=ax, bins=100)
for pos in deciles:
    handle = plt.axvline(pos, color='r')
ax.legend([handle], ['deciles'], fontsize=14)
ax.set_yscale('log')
ax.set_xscale('log')
ax.tick_params(labelsize=14)
ax.set_xlabel('Review Count', fontsize=14)
ax.set_ylabel('Occurrence', fontsize=14)
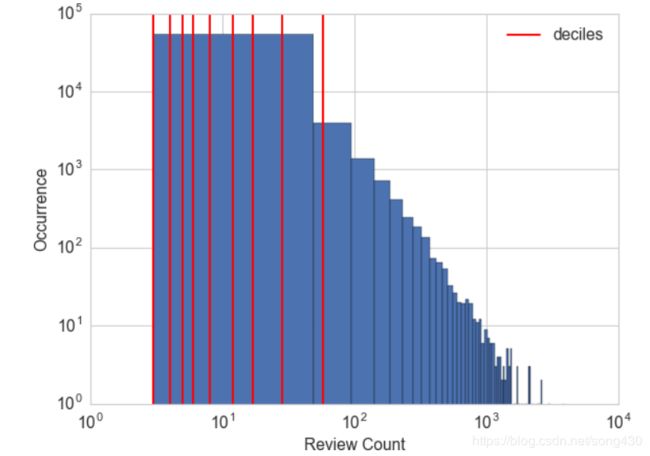
要计算分位数并将数据映射到分位数区,我们可以使用Pandas库,如下面所示。 pandas.DataFrame.quantile和pandas.Series.quantile计算分位数。 pandas.qcut将数据映射到所需数量的分位数。
# Continue example 2-3 with large_counts
import pandas as pd
# Map the counts to quartiles
pd.qcut(large_counts, 4, labels=False)
array([1, 2, 3, 0, 0, 1, 1, 2, 2, 3, 3, 0, 0, 2, 1, 0, 3], dtype=int64)
# Compute the quantiles themselves
large_counts_series = pd.Series(large_counts)
large_counts_series.quantile([0.25, 0.5, 0.75])
0.25 122.0
0.50 926.0
0.75 8286.0
dtype: float64
(3)Log Transformation(对数变换)
log函数会压缩数据,比如100-1000会压缩成2-3,下面的图是log变换后评论的分布。
fig, (ax1, ax2) = plt.subplots(2,1)
biz_df['review_count'].hist(ax=ax1, bins=100)
ax1.tick_params(labelsize=14)
ax1.set_xlabel('review_count', fontsize=14)
ax1.set_ylabel('Occurrence', fontsize=14)
biz_df['log_review_count'].hist(ax=ax2, bins=100)
ax2.tick_params(labelsize=14)
ax2.set_xlabel('log10(review_count))', fontsize=14)
ax2.set_ylabel('Occurrence', fontsize=14)
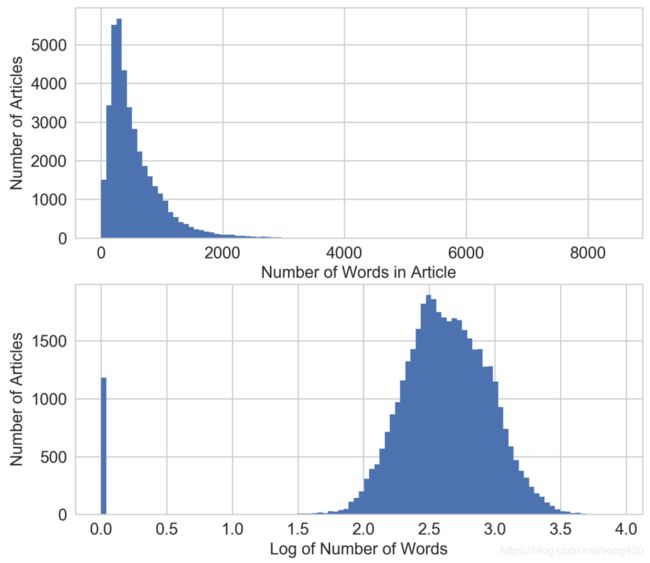
还有一个例子,Online News Popularity dataset是一个新闻的数据集,包含有60个特征,39797篇新闻,我们的目标是用这些特征来预测文章在社交媒体上的分享数。这个例子中,我们只关注一个特征,文章中单词的数量,下面的图展示了log变换后的柱状图,在变换之后,数据分布更像高斯分布了,除了位置0。
fig, (ax1, ax2) = plt.subplots(2,1)
df['n_tokens_content'].hist(ax=ax1, bins=100)
ax1.tick_params(labelsize=14)
ax1.set_xlabel('Number of Words in Article', fontsize=14)
ax1.set_ylabel('Number of Articles', fontsize=14)
df['log_n_tokens_content'].hist(ax=ax2, bins=100)
ax2.tick_params(labelsize=14)
ax2.set_xlabel('Log of Number of Words', fontsize=14)
ax2.set_ylabel('Number of Articles', fontsize=14)
Log Transform in Action
让我们看看log变换对监督学习的影响。我们将在这里使用以前的两个数据集。对于Yelp评论数据集,我们将使用评论数量来预测企业的平均评分。对于Mashable新闻文章,我们将使用文章中的单词数来预测其受欢迎程度。
由于输出是连续数,我们将使用简单线性回归作为模型。我们使用scikit-learn在有和没有对数转换的特征上对线性回归进行10倍交叉验证。模型通过R平方值评分进行评估,该评分衡量训练的回归模型预测新数据的程度。好的模型有很高的R平方分数。一个完美的模型获得最高分为1。分数可以是负数,而糟糕的模型可以获得任意低的负分数。使用交叉验证,我们不仅可以获得分数的估计值,还可以获得方差,这有助于我们判断两个模型之间的差异是否有意义。
import pandas as pd
import numpy as np
import json
from sklearn import linear_model
from sklearn.model_selection import cross_val_score
# Using the previously loaded Yelp reviews DataFrame,
# compute the log transform of the Yelp review count.
# Note that we add 1 to the raw count to prevent the logarithm from
# exploding into negative infinity in case the count is zero.
biz_df['log_review_count'] = np.log10(biz_df['review_count'] + 1)
# Train linear regression models to predict the average star rating of a business,
# using the review_count feature with and without log transformation.
# Compare the 10-fold cross validation score of the two models.
m_orig = linear_model.LinearRegression()
scores_orig = cross_val_score(m_orig, biz_df[['review_count']], biz_df['stars'], cv=10)
m_log = linear_model.LinearRegression()
scores_log = cross_val_score(m_log, biz_df[['log_review_count']], biz_df['stars'], cv=10)
print("R-squared score without log transform: %0.5f (+/- %0.5f)" % (scores_orig.mean(), scores_orig.std() * 2))
print("R-squared score with log transform: %0.5f (+/- %0.5f)" % (scores_log.mean(), scores_log.std() * 2))
R-squared score without log transform: -0.03683 (+/- 0.07280)
R-squared score with log transform: -0.03694 (+/- 0.07650)
从实验的输出来看,两个简单模型(有和没有对数变换)在预测目标方面同样不好,对数变换特征表现稍差。 多么令人失望! 它们都不是很好,这并不奇怪,因为它们都只使用一个特征,但人们希望log转换可能表现得更好。
# Download the Online News Popularity dataset from UCI, then use
# Pandas to load the file into a DataFrame.
df = pd.read_csv('OnlineNewsPopularity.csv', delimiter=', ')
# Take the log transform of the 'n_tokens_content' feature, which
# represents the number of words (tokens) in a news article.
df['log_n_tokens_content'] = np.log10(df['n_tokens_content'] + 1)
# Train two linear regression models to predict the number of shares
# of an article, one using the original feature and the other the
# log transformed version.
m_orig = linear_model.LinearRegression()
scores_orig = cross_val_score(m_orig, df[['n_tokens_content']], df['shares'], cv=10)
m_log = linear_model.LinearRegression()
scores_log = cross_val_score(m_log, df[['log_n_tokens_content']], df['shares'], cv=10)
print("R-squared score without log transform: %0.5f (+/- %0.5f)" % (scores_orig.mean(), scores_orig.std() * 2))
print("R-squared score with log transform: %0.5f (+/- %0.5f)" % (scores_log.mean(), scores_log.std() * 2))
R-squared score without log transform: -0.00242 (+/- 0.00509)
R-squared score with log transform: -0.00114 (+/- 0.00418)
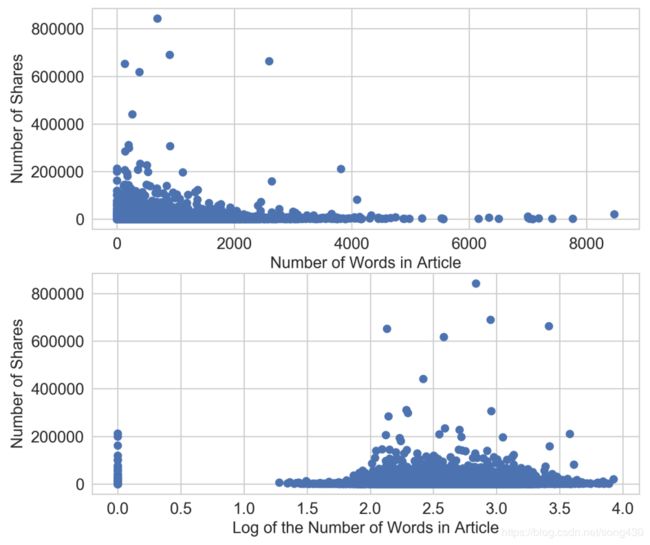
置信区间仍然重叠,但具有对数转换特征的模型比没有转换特征的模型做得更好。 为什么log转换在此数据集上变得如此成功? 我们可以通过查看输入特征和目标值的散点图来获得线索。 从图的下部中可以看出,对数变换重新塑造了x轴,将目标值(> 200,000份)中的大异常值的物品拉向轴的右侧。 这使得线性模型在输入特征空间的低端具有更多“呼吸空间”。 如果没有对数变换(上图),模型会承受更大的压力,以便在输入的非常小的变化下拟合非常不同的目标值。
fig2, (ax1, ax2) = plt.subplots(2,1)
ax1.scatter(df['n_tokens_content'], df['shares'])
ax1.tick_params(labelsize=14)
ax1.set_xlabel('Number of Words in Article', fontsize=14)
ax1.set_ylabel('Number of Shares', fontsize=14)
ax2.scatter(df['log_n_tokens_content'], df['shares'])
ax2.tick_params(labelsize=14)
ax2.set_xlabel('Log of the Number of Words in Article', fontsize=14)
ax2.set_ylabel('Number of Shares', fontsize=14)
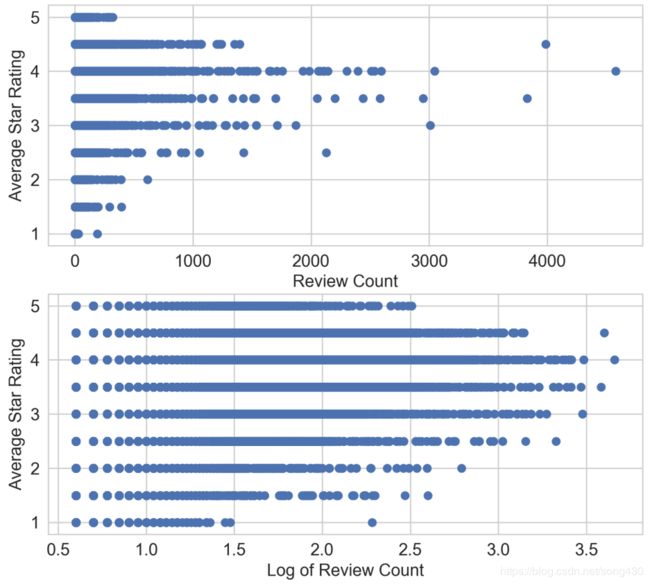
将其与应用于Yelp评论数据集的相同散点图进行比较。 下图上图非常不同。 平均星级评分以半星为单位进行离散化,范围从1到5。高评价计数(大约> 2,500条评论)确实与更高的平均星级评分相关,但这种关系远非线性。 根据任一输入,没有明确的方法来绘制线来预测平均星级。 从本质上讲,该图显示,评论计数及其对数都是平均星级评定的不良线性预测因子。
fig, (ax1, ax2) = plt.subplots(2,1)
ax1.scatter(biz_df['review_count'], biz_df['stars'])
ax1.tick_params(labelsize=14)
ax1.set_xlabel('Review Count', fontsize=14)
ax1.set_ylabel('Average Star Rating', fontsize=14)
ax2.scatter(biz_df['log_review_count'], biz_df['stars'])
ax2.tick_params(labelsize=14)
ax2.set_xlabel('Log of Review Count', fontsize=14)
ax2.set_ylabel('Average Star Rating', fontsize=14)
Power Transform: Generalization of the Log Transform
对数变换是称为幂变换的一系列变换的特定示例。 在统计学术语中,这些是方差稳定变换。 要理解为什么方差稳定性良好,请考虑泊松分布。 这是一个重尾分布,其方差等于其平均值:因此,其质心越大,其方差越大,尾部越重。 指数变换改变变量的分布,使方差不再取决于均值。 例如,假设随机变量 X X X具有泊松分布。 如果我们通过取平方根来变换 X X X,则 X ~ = X \widetilde{X}=\sqrt{X} X =X的方差大致是恒定的,而不是等于平均值。
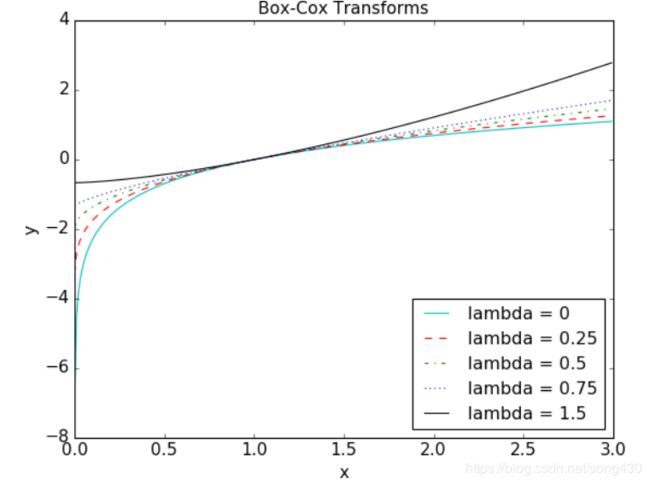
平方根变换和对数变换的简单推广称为Box-Cox变换:
x ^ = { x λ − 1 λ , i f λ ≠ 0 ln ( x ) , i f λ = 0 \hat{x}=\left\{ \begin{array}{lr} \frac{x^{\lambda}-1}{\lambda} , if \lambda \ne 0 & \\ \ln{(x)}, if {\lambda} = 0 \end{array} \right. x^={λxλ−1,ifλ̸=0ln(x),ifλ=0
下面的图显示了 λ = 0 \lambda=0 λ=0(对数变换), λ = 0.25 , 0.5 , 0.75 , 1.5 \lambda=0.25,0.5,0.75,1.5 λ=0.25,0.5,0.75,1.5的变换结果。如果 λ \lambda λ比1小,就会产生压缩的效果,如果比1大,产生相反的效果。
Box-Cox公式只在数据为正数时有效。对于非正的数据,可以通过加一个固定的常数来转换这些值。应用Box-Cox转换或更一般的指数变换时,我们必须确定参数λ的值。这可以通过最大似然(找到 λ \lambda λ使得转换后的信号拥有最大的高斯可能性)和贝叶斯方法找到 λ \lambda λ。本书(Econometric Methods by Johnston and Dinardo,1997)对Box-Cox和通用指数转换的使用进行了全面的讨论。SciPy’s stats package有Box-Cox的实现过程,并且可以找到最优的参数,下面的代码演示了在Yelp数据集上的用法。
from scipy import stats
# Continuing from the previous example, assume biz_df contains
# the Yelp business reviews data.
# The Box-Cox transform assumes that input data is positive.
# Check the min to make sure.
biz_df['review_count'].min()
3
# Setting input parameter lmbda to 0 gives us the log transform (without
# constant offset)
rc_log = stats.boxcox(biz_df['review_count'], lmbda=0)
# By default, the scipy implementation of Box-Cox transform finds the lambda
# parameter that will make the output the closest to a normal distribution
rc_bc, bc_params = stats.boxcox(biz_df['review_count'])
bc_params
-0.4106510862321085
下面的代码是原始数据和转换后数据的分布的可视化的比较。
fig, (ax1, ax2, ax3) = plt.subplots(3,1)
# original review count histogram
biz_df['review_count'].hist(ax=ax1, bins=100)
ax1.set_yscale('log')
ax1.tick_params(labelsize=14)
ax1.set_title('Review Counts Histogram', fontsize=14)
ax1.set_xlabel('')
ax1.set_ylabel('Occurrence', fontsize=14)
# review count after log transform
biz_df['rc_log'].hist(ax=ax2, bins=100)
ax2.set_yscale('log')
ax2.tick_params(labelsize=14)
ax2.set_title('Log Transformed Counts Histogram', fontsize=14)
ax2.set_xlabel('')
ax2.set_ylabel('Occurrence', fontsize=14)
# review count after optimal Box-Cox transform
biz_df['rc_bc'].hist(ax=ax3, bins=100)
ax3.set_yscale('log')
ax3.tick_params(labelsize=14)
ax3.set_title('Box-Cox Transformed Counts Histogram', fontsize=14)
ax3.set_xlabel('')
ax3.set_ylabel('Occurrence', fontsize=14)
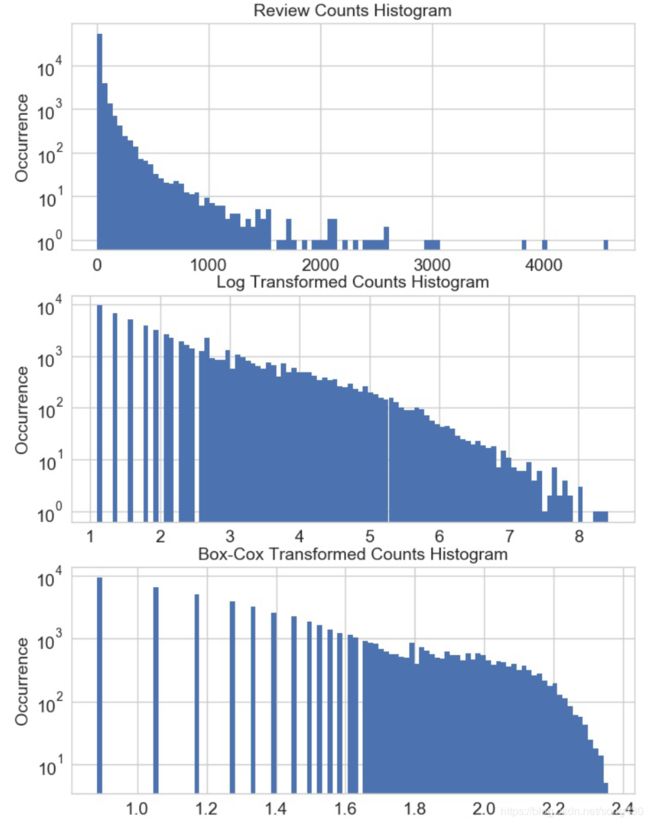
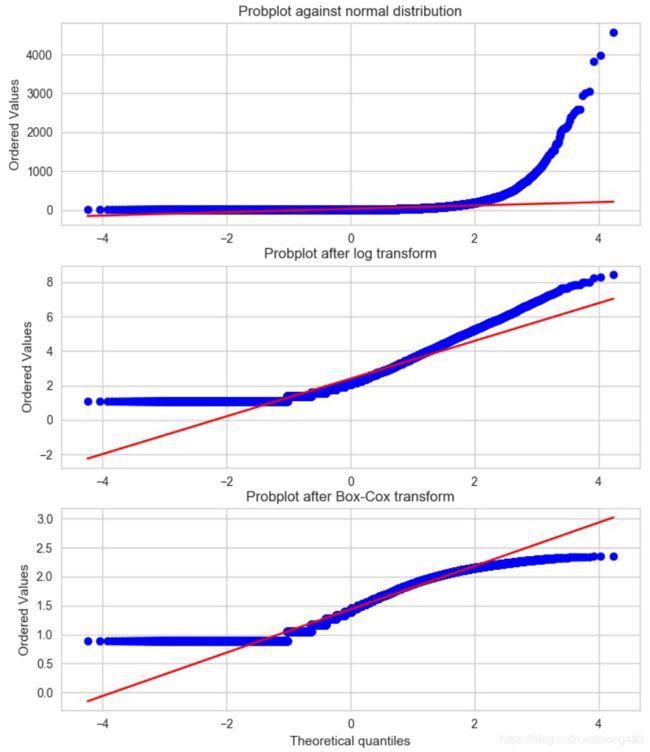
概率图,是一种直观地比较数据的经验分布和理论分布的简单方法。这本质上是观测到的分位数与理论分位数的散点图。下图显示了原始和转换后的Yelp review counts数据相对于正态分布的概率图(参见下面代码)。由于观测数据是严格正的,高斯函数可以是负的,所以在负端分位数永远不可能匹配。因此,我们关注的是正的一面。在这方面,原始计数显然比正态分布有更大的尾部。(有序值可达4000,而理论分位数仅为4)。对数变换和优化Box-Cox变换都使尾部接近正常。最优的Box-Cox变换比对数变换更能减小尾部的压力,这从尾部在红色对角线等值线下变平这一事实可以明显看出。
fig2, (ax1, ax2, ax3) = plt.subplots(3,1)
prob1 = stats.probplot(biz_df['review_count'], dist=stats.norm, plot=ax1)
ax1.set_xlabel('')
ax1.set_title('Probplot against normal distribution')
prob2 = stats.probplot(biz_df['rc_log'], dist=stats.norm, plot=ax2)
ax2.set_xlabel('')
ax2.set_title('Probplot after log transform')
prob3 = stats.probplot(biz_df['rc_bc'], dist=stats.norm, plot=ax3)
ax3.set_xlabel('Theoretical quantiles')
ax3.set_title('Probplot after Box-Cox transform')
(4)Feature Scaling or Normalization(特征缩放或归一化)
一些特征,比如经度和纬度,都是有限的数值,有些数值特征,比如计数,可能会一直增加,没有界限。有着平滑输入值的模型,比如线性回归,逻辑回归,都会被输入数据的尺度所影响。树的模型可能会不在乎。如果你的模型对输入数据的范围敏感,特征缩放或许会帮你,特征缩放也叫归一化,是把数据从某个范围转换到另一个范围,接下来,我们讨论集中缩放方式,观察他们所产生的不同的分布。
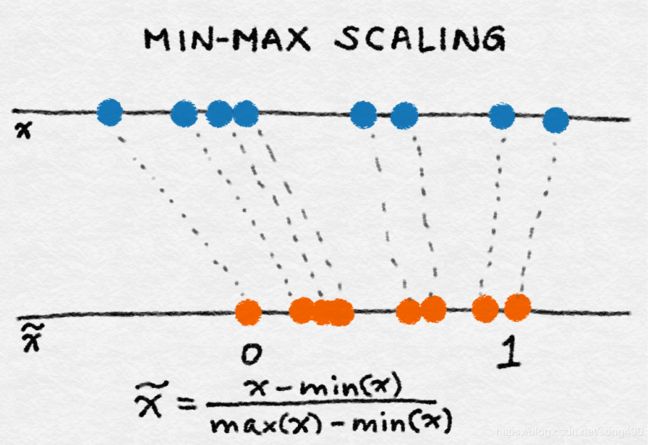
Min-Max Scaling
找到数据的最小值min ( x ) (x) (x)和最大值max ( x ) (x) (x),Min-Max就可以通过下面这种方式把数据限定在 [ 0 , 1 ] [0,1] [0,1]之间了。
x ~ = x − m i n ( x ) m a x ( x ) − m i n ( x ) \tilde{x}=\frac{x-min(x)}{max(x)-min(x)} x~=max(x)−min(x)x−min(x)
Standardization(标准化)
x ~ = x − m e a n ( x ) s q r t ( v a r ( x ) ) \tilde{x}=\frac{x-mean(x)}{sqrt(var(x))} x~=sqrt(var(x))x−mean(x)
它减去特征的平均值(除以所有数据点),然后除以标准差。因此,它也可以称为方差缩放。得到的缩放特征的均值为0,方差为1。如果原始特征具有高斯分布,那么缩放特征也具有高斯分布。
ℓ 2 \ell^2 ℓ2 Normalization( ℓ 2 \ell^2 ℓ2 范数归一化)
x ~ = x ∥ x ∥ 2 \tilde{x}=\frac{x}{\|x\|_2} x~=∥x∥2x
ℓ 2 \ell^2 ℓ2范数是一个坐标系空间中向量的长度,定义如下:
∥ x ∥ 2 = x 1 2 + x 2 2 + . . . + x m 2 \|x\|_2=\sqrt{x^2_1+x^2_2+...+x^2_m} ∥x∥2=x12+x22+...+xm2,
ℓ 2 \ell^2 ℓ2范数对数据点上特征值的平方求和,然后取平方根。归一化后,特征列的范数为1。这有时也被称为 ℓ 2 \ell^2 ℓ2尺度变换。(粗略地说,尺度变换意味着乘以一个常数,而归一化可能涉及许多操作)。
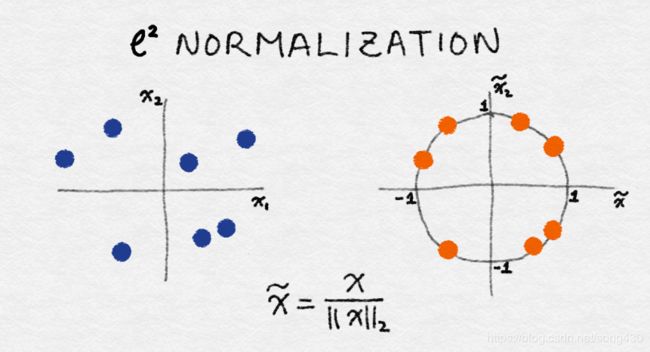
特征变换与对数变换不同,它不改变特征的分布。
import pandas as pd
import sklearn.preprocessing as preproc
# Load the Online News Popularity dataset
df = pd.read_csv('OnlineNewsPopularity.csv', delimiter=', ')
# Look at the original data - the number of words in an article
df['n_tokens_content'].as_matrix()
array([ 219., 255., 211., ..., 442., 682., 157.])
# Min-max scaling
df['minmax'] = preproc.minmax_scale(df[['n_tokens_content']])
df['minmax'].as_matrix()
array([ 0.02584376, 0.03009205, 0.02489969, ..., 0.05215955,
0.08048147, 0.01852726])
# Standardization - note that by definition, some outputs will be negative
df['standardized'] = preproc.StandardScaler().fit_transform(df[['n_tokens_content']])
df['standardized'].as_matrix()
array([-0.69521045, -0.61879381, -0.71219192, ..., -0.2218518 ,
0.28759248, -0.82681689])
# L2-normalization
df['l2_normalized'] = preproc.normalize(df[['n_tokens_content']], axis=0)
df['l2_normalized'].as_matrix()
array([ 0.00152439, 0.00177498, 0.00146871, ..., 0.00307663,
0.0047472 , 0.00109283])
fig, (ax1, ax2, ax3, ax4) = plt.subplots(4,1)
fig.tight_layout()
df['n_tokens_content'].hist(ax=ax1, bins=100)
ax1.tick_params(labelsize=14)
ax1.set_xlabel('Article word count', fontsize=14)
ax1.set_ylabel('Number of articles', fontsize=14)
df['minmax'].hist(ax=ax2, bins=100)
ax2.tick_params(labelsize=14)
ax2.set_xlabel('Min-max scaled word count', fontsize=14)
ax2.set_ylabel('Number of articles', fontsize=14)
df['standardized'].hist(ax=ax3, bins=100)
ax3.tick_params(labelsize=14)
ax3.set_xlabel('Standardized word count', fontsize=14)
ax3.set_ylabel('Number of articles', fontsize=14)
df['l2_normalized'].hist(ax=ax4, bins=100)
ax4.tick_params(labelsize=14)
ax4.set_xlabel('L2-normalized word count', fontsize=14)
ax4.set_ylabel('Number of articles', fontsize=14)

当一组输入特征的比例相差很大时,特征缩放非常有用。例如,一个受欢迎的电子商务网站的日访问量可能是10万,而实际销售额可能是数千。如果这两个特性都被放入一个模型中,那么模型将需要在确定要做什么时平衡其规模。输入特征的急剧变化会导致模型训练算法的数值稳定性问题。在这些情况下,标准化特性是一个好主意。第四章会介绍自然语言处理时的特征缩放问题。
(5)Interaction Features(组合特征)
一个简单的组合是两个特征的乘积。类比就是逻辑和。它用成对的条件来表达结果:用户来自邮政编码98121并且用户年龄在18岁到35岁之间。基于决策树的模型可以获得这些信息,但是广义线性模型经常发现组合特征非常有用。
一个线性模型用输入 x 1 , x 2 , . . . x n x_1,x_2,...x_n x1,x2,...xn的线性组合来预测输出 y y y:
y = w 1 x 1 + w 2 x 2 + . . . + w n x n y=w_1x_1+w_2x_2+...+w_nx_n y=w1x1+w2x2+...+wnxn
一种拓展线性模型的方式是包含输入特征的组合,比如:
y = w 1 x 1 + w 2 x 2 + . . . + w n x n + w 1 , 1 x 1 x 1 + w 1 , 2 x 1 x 2 + w 1 , 3 x 1 x 3 + . . . y=w_1x_1+w_2x_2+...+w_nx_n+w_{1,1}x_1x_1+w_{1,2}x_1x_2+w_{1,3}x_1x_3+... y=w1x1+w2x2+...+wnxn+w1,1x1x1+w1,2x1x2+w1,3x1x3+...
这允许我们捕获特征之间的交互,因此这些对称为组合特征。如果 x 1 x_1 x1和 x 2 x_2 x2是二进制的,那么它们的乘积 x 1 x 2 x_1x_2 x1x2就是逻辑函数 x 1 x_1 x1和 x 2 x_2 x2。假设问题是根据客户的个人资料信息预测客户的偏好。在我们的例子中,组合特征不只是基于用户的年龄或位置进行预测,而是允许模型基于特定年龄和特定位置的用户进行预测。
在下面代码中,我们使用UCI Online News Popularity数据集中的成对组合特征来预测每篇新闻文章的共享数量。结果表明,组合特征比单特征预测性要好。
from sklearn import linear_model
from sklearn.model_selection import train_test_split
import sklearn.preprocessing as preproc
# Assume df is a Pandas DataFrame containing the UCI Online News Popularity dataset
df.columns
Index(['url', 'timedelta', 'n_tokens_title', 'n_tokens_content',
'n_unique_tokens', 'n_non_stop_words', 'n_non_stop_unique_tokens',
'num_hrefs', 'num_self_hrefs', 'num_imgs', 'num_videos',
'average_token_length', 'num_keywords', 'data_channel_is_lifestyle',
'data_channel_is_entertainment', 'data_channel_is_bus',
'data_channel_is_socmed', 'data_channel_is_tech',
'data_channel_is_world', 'kw_min_min', 'kw_max_min', 'kw_avg_min',
'kw_min_max', 'kw_max_max', 'kw_avg_max', 'kw_min_avg', 'kw_max_avg',
'kw_avg_avg', 'self_reference_min_shares', 'self_reference_max_shares',
'self_reference_avg_sharess', 'weekday_is_monday', 'weekday_is_tuesday',
'weekday_is_wednesday', 'weekday_is_thursday', 'weekday_is_friday',
'weekday_is_saturday', 'weekday_is_sunday', 'is_weekend', 'LDA_00',
'LDA_01', 'LDA_02', 'LDA_03', 'LDA_04', 'global_subjectivity',
'global_sentiment_polarity', 'global_rate_positive_words',
'global_rate_negative_words', 'rate_positive_words',
'rate_negative_words', 'avg_positive_polarity', 'min_positive_polarity',
'max_positive_polarity', 'avg_negative_polarity',
'min_negative_polarity', 'max_negative_polarity', 'title_subjectivity',
'title_sentiment_polarity', 'abs_title_subjectivity',
'abs_title_sentiment_polarity', 'shares'],
dtype='object')
# Select the content-based features as singleton features in the model,
# skipping over the derived features
features = ['n_tokens_title', 'n_tokens_content', 'n_unique_tokens', 'n_non_stop_words', 'n_non_stop_unique_tokens', 'num_hrefs', 'num_self_hrefs', 'num_imgs', 'num_videos', 'average_token_length', 'num_keywords', 'data_channel_is_lifestyle', 'data_channel_is_entertainment', 'data_channel_is_bus', 'data_channel_is_socmed', 'data_channel_is_tech', 'data_channel_is_world']
X = df[features]
y = df[['shares']]
# Create pairwise interaction features, skipping the constant bias term
X2 = preproc.PolynomialFeatures(include_bias=False).fit_transform(X)
X2.shape
(39644, 170)
# Create train/test sets for both feature sets
X1_train, X1_test, X2_train, X2_test, y_train, y_test = \
... train_test_split(X, X2, y, test_size=0.3, random_state=123)
def evaluate_feature(X_train, X_test, y_train, y_test):
    """Fit a linear regression model on the training set and
    score on the test set"""
    model = linear_model.LinearRegression().fit(X_train, y_train)
    r_score = model.score(X_test, y_test)
    return (model, r_score)
# Train models and compare score on the two feature sets
(m1, r1) = evaluate_feature(X1_train, X1_test, y_train, y_test)
(m2, r2) = evaluate_feature(X2_train, X2_test, y_train, y_test)
print("R-squared score with singleton features: %0.5f" % r1)
print("R-squared score with pairwise features: %0.10f" % r2)
R-squared score with singleton features: 0.00924
R-squared score with pairwise features: 0.0113276523
组合特征很容易,但是训练线性模型的时间从 O ( n ) O(n) O(n)变成了 O ( n 2 ) O(n^2) O(n2),其中 n n n是特征个数。有几种方法可以避免,比如特征选择或者更仔细的创建少量的复杂特征。
利用专家知识制作的复杂特征有足够的表达能力,但是专家知识的计算成本可能很高,在第八章中我们可以看到人工挑选复杂特征的例子,现在让我们看看特征选择技术。
(6)Feature Selection(特征选择)
特征选择技术去除无用的特征,以减低模型的复杂性,最终目标是建立一个计算速度更快,预测精度几乎或完全没有下降的精简模型。换句话说,特征选择并不是减少训练时间,而是减少模型的测试时间。
粗略的来说,特征选择主要分成下面三类:
Filtering(过滤)
过滤技术对特征进行预处理,以删除不太可能对模型有用的特征。例如,可以计算每个特征与响应变量之间的相关性或互信息,并过滤掉低于阈值的特征。第3章讨论了这些用于文本特征的技术的示例。过滤技术比下面描述的包装技术(wrapper methods)通用得多,但是它们没有考虑所使用的模型。因此,他们可能无法为模型选择正确的特征。最好做保守的预过滤。
Wrapper Methods(包装技术)
这些技术是昂贵的,但是它们允许您尝试特性的子集,这意味着您不会意外地删除那些本身不提供信息但组合使用时很有用的特性。包装器方法将模型视为一个黑盒,它提供所提议的特性子集的质量分数。有一个单独的方法可以迭代地细化子集。
Embedded Methods(嵌入技术)
这些方法将特征选择作为模型训练过程的一部分。例如,决策树本质上执行特征选择的,因为它选择在每个训练步骤上分割树的一个特征。另一个例子是 ℓ 1 \ell^1 ℓ1正则化器,它可以添加到任何线性模型的训练目标中。正则化器鼓励使用少量特性而不是大量特性的模型,因此它也被称为模型的稀疏性约束。嵌入式方法将特征选择作为模型训练过程的一部分。它们不像包装器方法那样强大,但也远没有包装器方法那么昂贵。与过滤相比,嵌入式方法选择特定于模型的特性。从这个意义上说,嵌入式方法在计算成本和结果质量之间取得了平衡。
特征选择可以看这本论文(Guyon and Elisseeff,2003)
本章讨论了一些常见的数字特征工程技术,如量化、缩放(即标准化)、对数变换(一种幂变换)和组合特征,并对处理大量组合特征所必需的特征选择技术进行了简要的总结。在统计机器学习中,所有的数据最终都归结为数字特征。因此,各种途径最终都导致了某种数字特征工程技术的产生。让这些工具在特性工程的最后阶段派上用场。