sklearn分类器评估指标(精确率,混淆矩阵,precious-recall-Fmeasur,ROC曲线,损失函数)
1.精确率
accuracy_score函数计算分类准确率:返回被正确分类的样本比例或者数量
当多标签分类任务中,该函数返回子集的准确率,对于给定的样本,如果预测得到的标签集合与该样本真正的标签集合吻合,那么subset accuracy=1否则为零

import numpy as np
from sklearn.metrics import accuracy_score
y_pred=[0,2,1,3]
y_true=[0,1,2,3]
print(accuracy_score(y_true,y_pred,normalize=False))
2
print(accuracy_score(y_true,y_pred))
0.5
2.混淆矩阵(confusion matrix)或叫混淆表(table of confusion)

TP(True Positive):将正类预测为正类数,真实为0,预测也为0
FN(False Negative):将正类预测为负类数,真实为0,预测为1
FP(False Positive):将负类预测为正类数, 真实为1,预测为0
TN(True Negative):将负类预测为负类数,真实为1,预测也为1
from sklearn.metrics import confusion_matrix
y_true=[2,0,2,2,0,1]
y_pred=[0,0,2,2,0,2]
print(confusion_matrix(y_true,y_prednlabels=[]))
3.precious-recall-Fmeasur
常用的指令如下

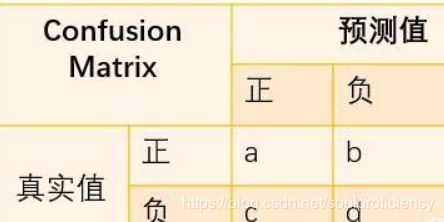
通过混淆矩阵(如下图)
可以很明白看出各个参数的公式

常见的衡量参数的名字及求解方法

精确度是指测试结果与测量点很精确
准确度是指测试结果与真实值接近
参数F=(1+β²)prerecall/(β²prec+recall)
β越小,prec的权重大,反之recall权重大,β==1时代表两者同等重要
from sklearn import metrics

y_pred = [0, 1, 0, 1, 0, 0]
y_true = [1, 0, 0, 1, 0, 0]
print(metrics.precision_score(y_true, y_pred))
#precision_score仅支持二元分类,及0,1分类
print(metrics.recall_score(y_true, y_pred))
print(metrics.fbeta_score(y_true, y_pred,beta=1))
#f参数需要指定β的大小
print(metrics.precision_recall_fscore_support(y_true, y_pred,beta=1))
import numpy as np
from sklearn.metrics import precision_recall_curve
from sklearn.metrics import average_precision_score
y_true = np.array([0, 0, 1, 1])
y_score = np.array((0.1, 0.4, 0.35, 0.8))
prec, recall, threshold = precision_recall_curve(y_true, y_score)
print(prec)
print(recall)
print(threshold)
print(precision_recall_curve(y_true, y_score))ython中为了观测这三个指标,将其封装在一个函数中,及classification_report
from sklearn.metrics import classification_report

y_pred = [0, 1, 0, 1, 0, 0]
y_true = [1, 1, 0, 1, 0, 0]
target = ['class1', 'class2']
print(classification_report(y_true, y_pred, target_names=target))
#上述代码中class的个数取决于数据集的维数,二元分类就只有两个class,三元就3个,无法多设置或少设置,说明report可以操作多元分类
如何将二元分类拓展到多类或者多标签问题 ?
默认情况下只有正标签被用来计算指标,为了将这些指标扩展到多类,我们将多类视为二元分类的集合,并对数据集划分。同时计算这些子分类的二元指标,并将所有子分类问题上的得分平值平均起来,通常使用average。
5种处理权重的方法:macro,weighted,mirco,samples,average
4.ROC曲线 5.损失函数 常见的损失有: square loss(分类器不常用) logistic loss
ROC空间(又叫sensitivityVS1-sensitivity plot)以TPR(又叫sensitivity)作为T轴,
FPR(1-sensitivity)作为X轴,构成的一个二维坐标空间,ROC空间描述了了TP和FP之间做折中权衡的原理。点集在左上方说明情况较好,右下方表示更差
在二元分类问题中,每个样本实例的类别预测通常是基于一个连续的随机变量X做出的,这个从样本实例中计算出的随机变量X被称为score,给定一个阈值参数T,X>T则为positive类服从F1(X),Xsklearn.metrics.roc_curve(y_ture,y_score,pos_label=None,
sample_weight=None,drop_intermediate=True)import numpy as np
from sklearn.metrics import roc_curve
from sklearn.metrics import roc_auc_score
y = np.array([1, 1, 2, 2])
scores = np.array([0.1, 0.4, 0.35, 0.8])
fpr, tpr, thresholds = roc_curve(y, scores, pos_label=2)
print(fpr)
print(tpr)
print(thresholds)
print(roc_auc_score(y,scores))#计算AUC值
对于给定的输入X,学习器模型预测得到对应的结果,这个预测响应与真实响应之间的差距,通过损失函数来描述

zero_one lossfrom sklearn.metrics import zero_one_loss
y_pred = [1,2,3,4]
y_true = [2,2,3,4]
print(zero_one_loss(y_true, y_pred))
hing loss(常用于SVM)
log loss or cross-entropy loss
对数损失函数判断的是预测输出的概率分布是否与真实分布相符,而不是判断标签类是否相等。
![]()
对于类标签Y可取0和1,取不同的类标签他的损失大小与概率P是不相同的。
对于多元分类的时候,同样也有相应的损失函数

from sklearn.metrics import log_loss

y_true = [0, 0, 1, 1]
y_pred = [(0.4, 0.6), (0.2, 0.8), (0.5, 0.5), (0.2, 0.8)]#调用log损失的时候,会默认生成one-hot矩阵,如上图,如果两个标签,那么只能有两个分布概率
print(log_loss(y_true, y_pred))


y_true = [0, 1, 2, 4]
y_pred = [(0.4, 0.2, 0.2, 0.2), (0.2, 0.4, 0.2, 0.2), (0.5, 0.1, 0.1, 0.3), (0.3, 0.3, 0.3, 0.1)]
print(log_loss(y_true, y_pred))
1.6094379124341
from sklearn.metrics import hamming_loss
import numpy as np

y_true = [1, 2, 2, 5]
y_pred = np.array([1, 2, 3, 5])
print(hamming_loss(y_true, y_pred))#只有在3处一个为2一个3,所以是1/4=0.25
0.25

