matlab求解微分方程
如何用matlab来求解简单的微分方程?举例来说明吧。
- 求解三阶常微分方程。我们知道,求解高阶常微分方程可以化为求解一阶常微分方程组。编写函数eq3.m:
%解常微分方程 3*y'''+5*y''+6*sin(t)*y=cost
function ydot = eq3(t,y)
ydot=[y(2);y(3);(cos(t)-5*y(3)-6*sin(t)*y(1))/3];
其中,ydot为一个列向量,值分别表示y‘(1)、y‘(2)、y‘(3)的取值,t自因变量,y为因变量,一个y就可以表示因变量组了。事实上,说白了,这个函数就是申明一下变量使t和y,以及y一阶导的右端项为那三个。
接着,编写主函数如下:
%解常微分方程 3*y'''+5*y''+6*sin(t)*y=cost
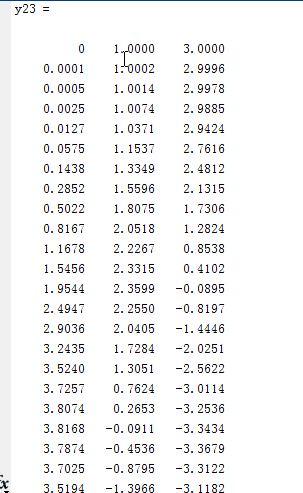
[t23,y23]=ode23(@eq3,[0,5],[0,1,3])
[0,5]表示自变量(这里是t)取值范围,[0,1,3]表示初始条件,也就是 y0,y′0,和y′′0 y 0 , y 0 ′ , 和 y 0 ″ ,计算出来的结果又三列数,分别表示 y,y′,和y′′ y , y ′ , 和 y ″ 在[0,5]中的取值。如图:

- 二阶常微分方程
编写函数eq2.m
function ydot= eq2(t,y)
ydot=[y(2);-3-cos(2*t) + 2*sin(t)+t-3.8];
主函数
clc
clear
[t,y]=ode23('eq2',[0,20],[0,1]);
plot(t,y(:,1),'-',t,y(:,2),'-.')- 求解微分方程,以上matlab内部用的是欧拉折现法,或者是单步法的改进,得不到一个解析解。那么如何求带初值问题的解析解呢?如下:
y=dsolve('D3y-D2y=x','y(1)=8,Dy(1)=7,D2y(1)=4','x') 一目了然,就不多解释了。
- 方程组解析解,以及带初始条件的解析解。
clc,clear
equ1='D2f+3*g=sin(x)';
equ2='Dg+Df=cos(x)';
[general_f,general_g]=dsolve(equ1,equ2,'x')
[f,g]=dsolve(equ1,equ2,'Df(2)=0,f(3)=3,g(5)=1','x') - 非齐次线性方程组:
编写vdp1.m
function dy=vdp1(t,y);
dy=[y(2);(1-y(1)^2)*y(2)-y(1)];
主函数:
[T,Y]=ode45('vdp1',[0 20],[2;0]);
%观察结果。利用plot输出解的结果:
plot(T,Y(:,1),'-',T,Y(:,2),'--')
title('Solution of van der Pol Equation,mu=1');
xlabel('time t');
ylabel('solution y');
legend('y1','y2'); function dy=F(t,y);
dy=[y(2);y(3);3*y(3)+y(2)*y(1)];2、主函数
[T,Y]=ode45('F',[0 1],[0;1;-1]) %求解y'''-3y'-yy'=0 y(0)=0 y'(0)=1 y''(0)=-1- 求无初始条件的微分方程的解析通解各项
clc
clear
syms x y
diff_equ='x^2+y+(x-2*y)*Dy=0';
dsolve(diff_equ,'x')
%求无初始条件的微分方程的解析通解各项- 求线性系统的解析解并画相图
clc,clear
equ1='Dx1 - x2 = 0';
equ2='Dx2 + x1 + 2*x2 =0';
%[general_f,general_g]=dsolve(equ1,equ2,'t')
[x1,x2]=dsolve(equ1,equ2,'x1(0)=1,x2(0)=0','t')
x1_fun = matlabFunction(x1)
x2_fun = matlabFunction(x2)
t = 0:0.01:100
plot(x1_fun(t),x2_fun(t))
plot(t,x1_fun(t))
hold on;
plot(t,x2_fun(t))
hold off;
好吧,就说这么多了。这里介绍的是matlab内置的算法,知道原理自己动手编也是很快的啦。
