matlab 绘图与动画制作
目录
- 一、MATLAB常用绘图函数
- 1、plot() 函数
- 2、surf() 函数
- 3、ezplot() 函数
- 二、动画绘制
- 1、绘制原理
- 2、绘制步骤
- 3、代码模板
- 三、举个栗子
- example 1:绘制一根弹簧
- example 2:做一块曲奇饼
一、MATLAB常用绘图函数
1、plot() 函数
plot() 函数用来绘制二维曲线和三维曲线,调用方法如下:
% 一根二维曲线
plot(x, y)
plot(x, y, 'LineWidth', w, 'color', [1 0 0])

% 一次性画多条曲线
plot(x,y1,'g',x,y2,'b--o',x,y3,'c*')

% plot3 三维曲线
t = 0 : 0.1 : 6*pi;
plot3(cos(t),sin(t),t,'-b','LineWidth',4);
2、surf() 函数
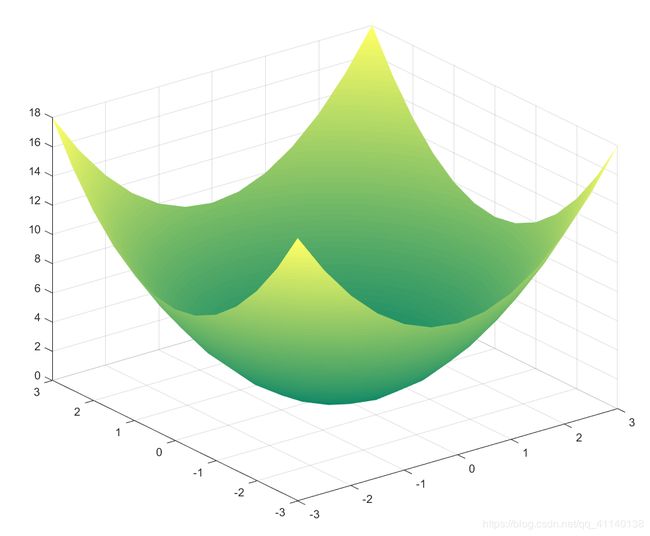
surf() 函数用于绘制三维曲面,并可以使用不同色彩风格渲染图形,使用surf函数绘制步骤如下:
- 设置 x y 坐标
- 使用[X, Y] = meshgrid(x, y)生成坐标网格
- 根据X Y的函数生成Z的值
- 调用surf(X, Y, Z)绘制
举个栗子:
y = -3 : 0.5 : 3;
x = -3 : 0.5 : 3;
[X, Y] = meshgrid(x, y);	% 生成坐标格子

Z = X.^2 + Y.^2;
surf(X, Y, Z)
shading interp	# 隐藏网格
colormap('summer')	# 用 'summer' 风格渲染曲面
set(gcf, 'color', [1 1 1])	# 将坐标框边缘设置为白色(去掉它试试)
绘制结果如下:
colormap 的详细使用方法可以查看文档或者参考博客:MATLAB中colormap函数
3、ezplot() 函数
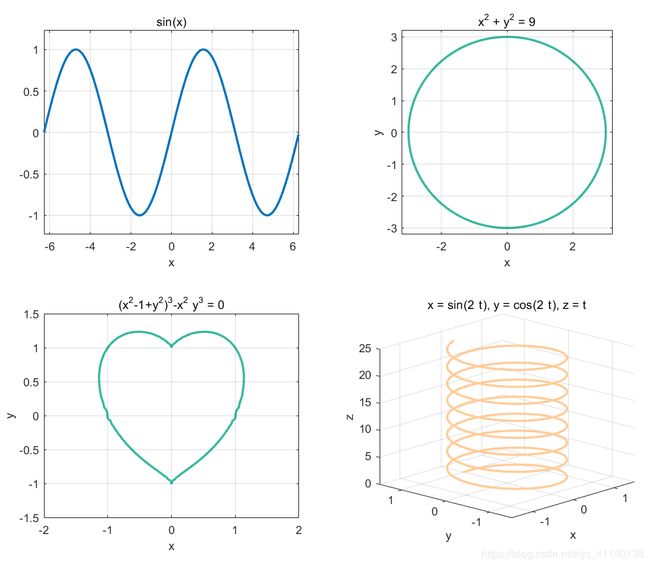
ezplot() 函数可以使用很短的代码绘制各种曲线、曲面、隐函数的图像,使用方法如下:
- syms sym, 声明sym为变量
- ezplot(‘f’, [A, B]), f 是关于x的函数, A
- ezplot(‘f=const’), 隐函数作图
- ezplot(‘x(t)’, ‘y(t)’, ‘z(t)’, range),参数方程作图
clear all
figure
subplot(221)
syms x
ezplot('sin(x)', [-2*pi, 2*pi])

subplot(222)
syms x y
ezplot('x.^2 + y.^2 = 9')
axis equal, axis([-3.2 3.2 -3.2 3.2])

subplot(223)
ezplot('(x^2-1+y^2)^3-x^2*y^3 = 0')
axis([-2 2 -1.5 1.5])

subplot(224)
ezplot3('sin(t)', 'cos(t)', 't', [0, 6*pi])
二、动画绘制
1、绘制原理
动画是通过把人物的表情、动作、变化等分解后画成许多动作瞬间的画幅,再用摄影机连续拍摄成一系列画面,给视觉造成连续变化的图画。
它的基本原理与电影、电视一样,都是视觉暂留原理。
在matlab中,我们可以通过重复绘制来生成动画效果,可以在原图的基础上修改绘制对象的参数并重新绘制,也可以通过反复调用绘图的函数来实现 (●’◡’●)
2、绘制步骤
step1: 绘制静态的图
step2: 重复绘制
- 保存第一次调用绘图函数返回的值,在循环里面使用
set('XData', X, 'YData', Y, 'ZData', Z)
函数设置参数,并调用drawnow;函数在原图上重新绘制,得到动态效果 - 在循环里面反复调用
plot或surf函数,使用getframe;函数获取每一帧图像并显示,实现动画效果
3、代码模板
- 模板1:通过 set - drawnow 实现
X = start : step : end;
Y = f(X);

% 第一次绘制,保存返回值
h = plot(X, Y, 'LineWidth', 1);

while true
    % 改变X、Y的值
    change_value(X);
    change_value(Y);

    % 使用set修改数据
    set(h, 'XData', theta, 'YData', Y);

    drawnow;	% 重新绘制
end
- 模板2:通过 plot - getframe 实现
X = start : step : end;
Y = f(X);

while true
    % 改变X、Y的值
    change_value(X);
    change_value(Y);

	% 重复绘制
	plot(X, Y)

    % 获取帧
    currFrame = getframe;
end
三、举个栗子
example 1:绘制一根弹簧
实现思路:
反复的调整螺旋线的间距,实现压缩伸长的效果
详细代码:
% 弹簧
theta = -16*pi : 0.1 : 16*pi;
X = sin(theta);
Y = cos(theta);
Z = theta;

h = plot3(X, Y, Z, 'LineWidth', 1);
axis([-2 2 -2 2 -50 50]);
set(h, 'color', [0.5 0.25 0.12], 'LineWidth', 2)
axis off, set(gcf, 'color', [1 1 1])

while true
    for i = 1 : 100
        Z = 0.98 * Z;
        set(h, 'XData', X, 'YData', Y, 'ZData', Z);
        drawnow;
    end

    for i = 1 : 100
        Z = Z / 0.98;
        set(h, 'XData', X, 'YData', Y, 'ZData', Z);
        drawnow;
    end
end
看,它在动:
但是上面的弹簧看着不咋地,我们可以用surf函数绘制一个三维的弹簧模型:
% 弹簧
R = 5;
r = 0.8;
rate = 0.4;
th = 0 : pi/100 : 10*pi;
phi = 0 : pi/100 : 2*pi;
[theta, fai] = meshgrid(th, phi);

X = R*cos(theta) + r*cos(fai).*cos(theta);
Y = R*sin(theta) + r*cos(fai).*sin(theta);
Z = rate * theta + r.*sin(fai);

h = surf(X, Y, Z);
shading interp;
% colormap([0.8 0.4 0.25]), camlight;
colormap([0.76 0.5 0.13]), camlight;
set(gcf, 'color', [1 1 1])
axis equal, axis off
set(gcf, 'color', [1 1 1])
axis(1.1*[-(R+r) (R+r) -(R+r) (R+r) min(th)-1 max(th)*rate/(0.985^20)])

while true
    for i = 1 : 20
        rate = rate / 0.985;
        Z = rate * theta + r.*sin(fai);
        set(h, 'XData', X, 'YData', Y, 'ZData', Z);
        drawnow;
    end

    for i = 1 : 20
        rate = rate * 0.985;
        Z = rate * theta + r.*sin(fai);
        set(h, 'XData', X, 'YData', Y, 'ZData', Z);
        drawnow;
    end
end
cool~
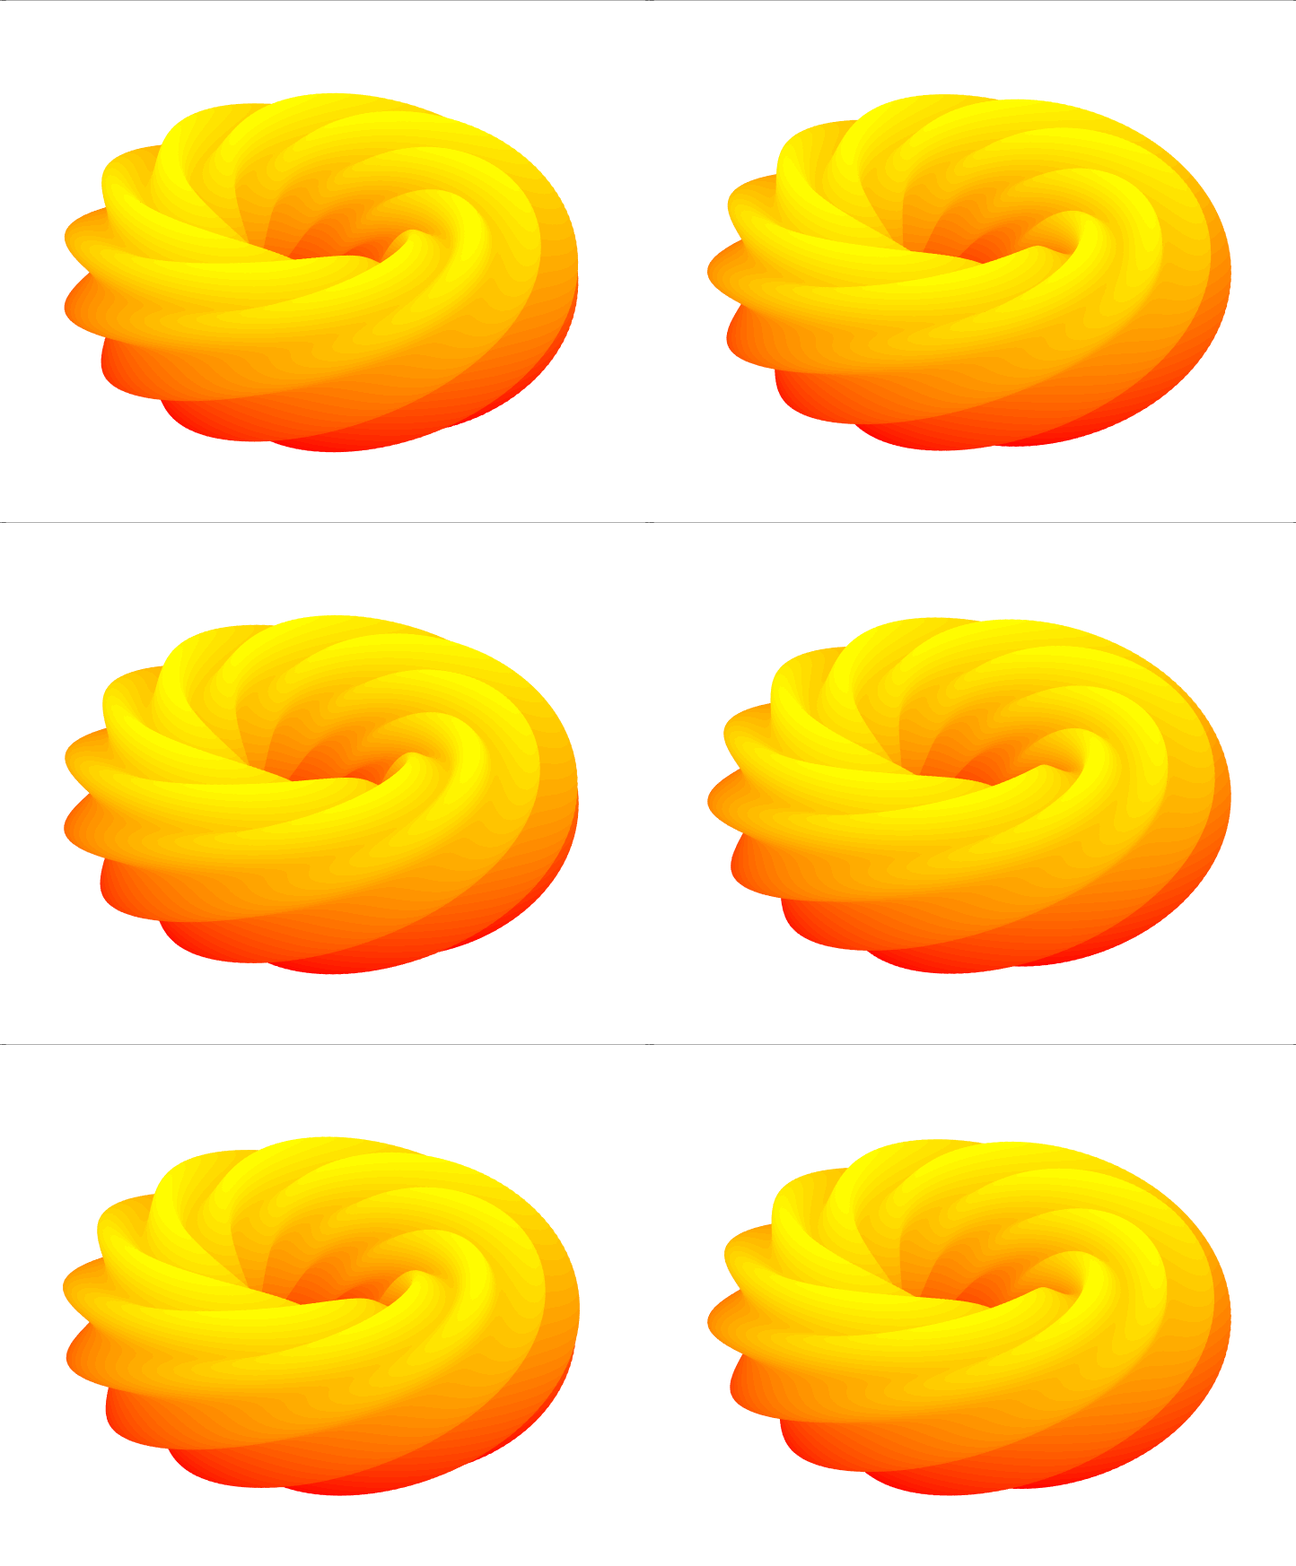
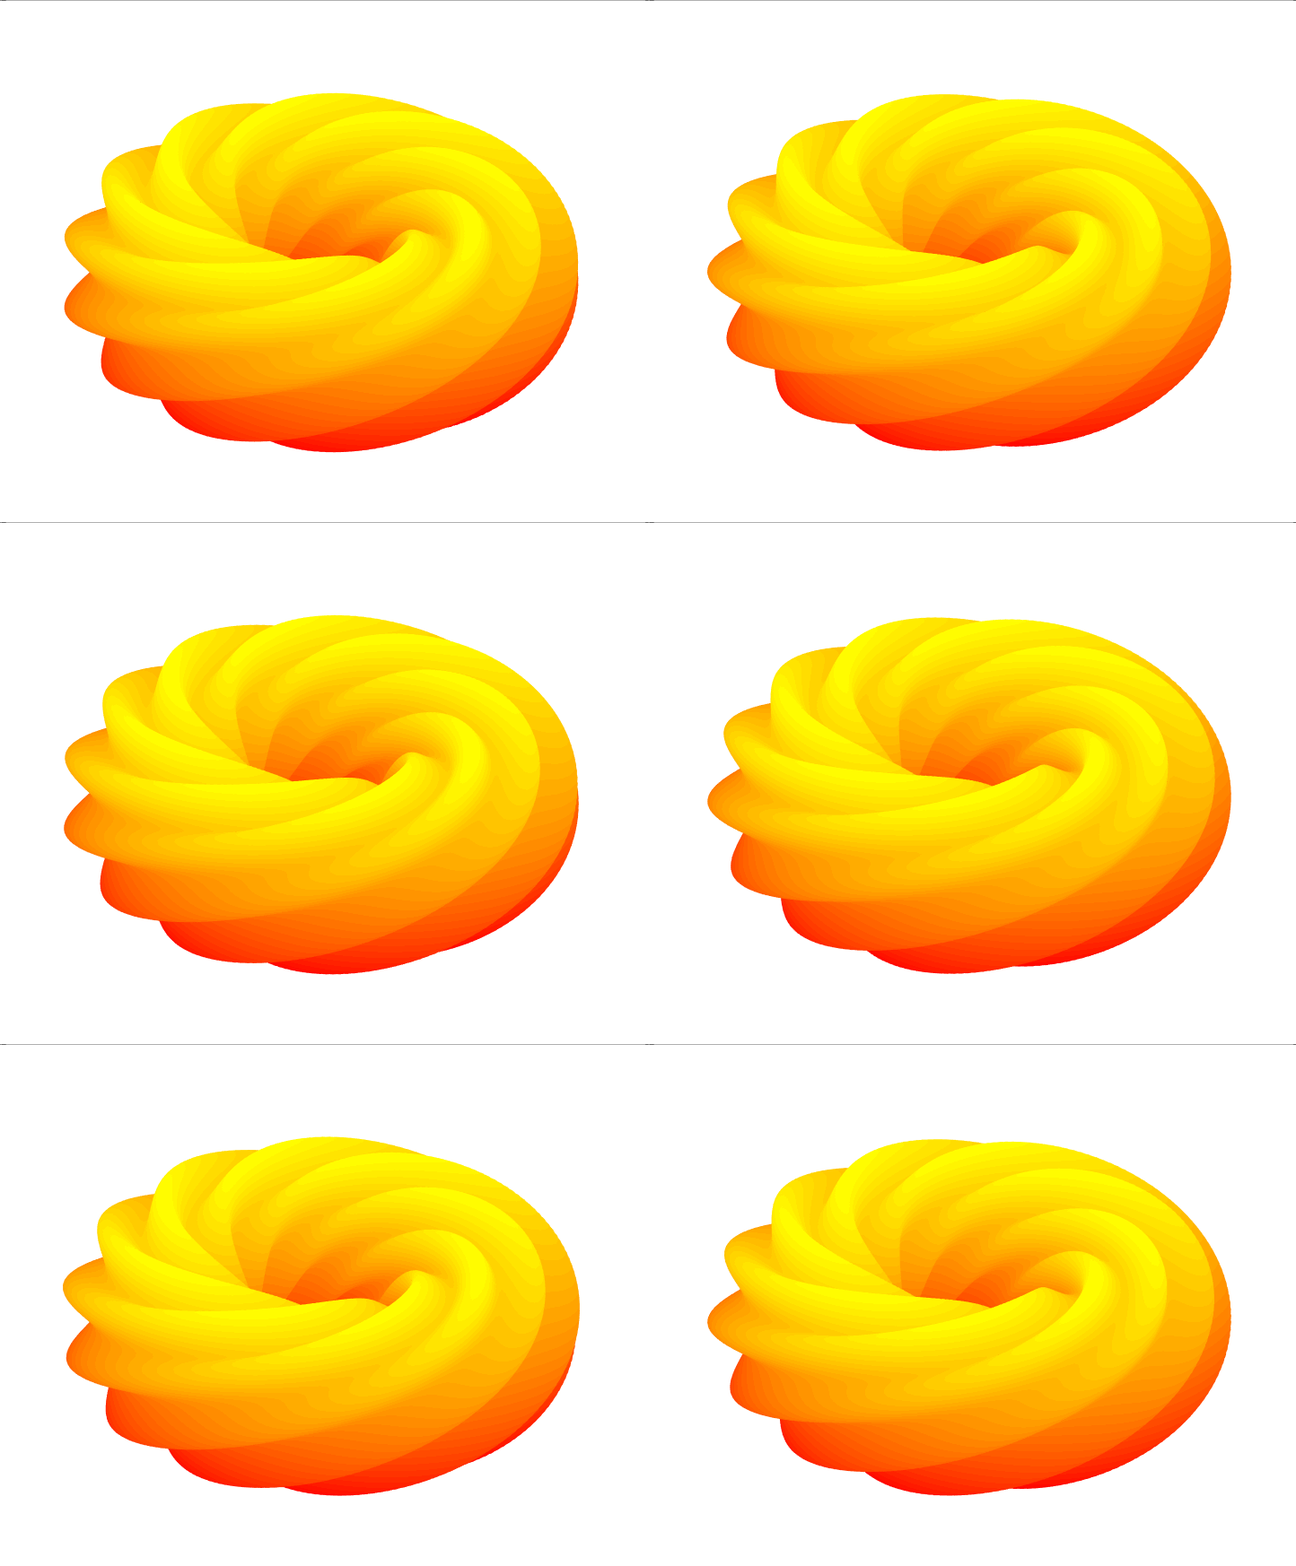
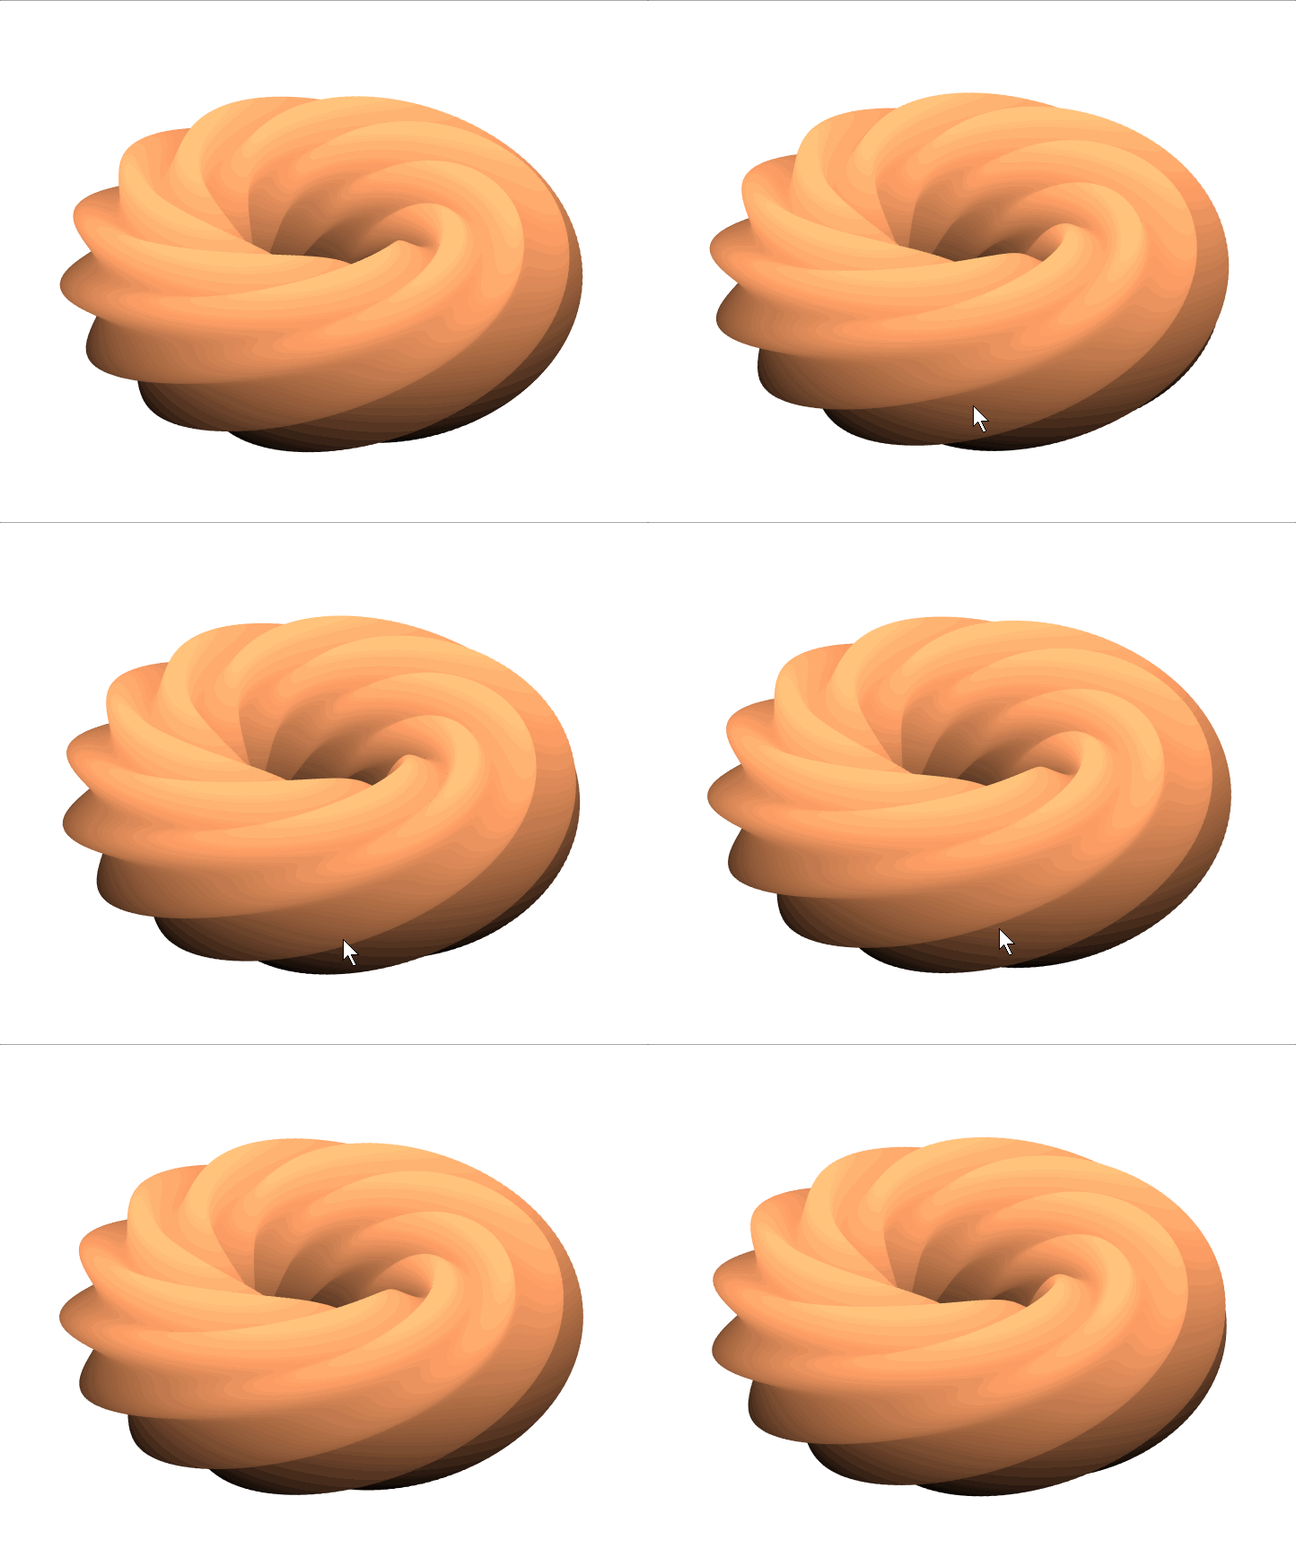
example 2:做一块曲奇饼
实现思路:
- 使用参数方程绘制一个圆环
- 将圆环改为曲奇饼形状
- 在第二步的基础上增加一个变化的时间参量,实现旋转
详细代码:
clear all
R = 2;  %
t = 0 : pi/100 : 2*pi;
p = 0 : pi/100 : 2*pi;
[theta, phi] = meshgrid(t, p);

time = 0 : 0.1 : 100;
for n = 1 : length(time)
    r = 1 + 0.2 * cos(8 * (phi - theta + time(n))); % 内半径
    X = (R + r.*cos(theta)).*cos(phi);
    Y = (R + r.*cos(theta)).*sin(phi);
    Z = r .* sin(theta);

    surf(X, Y, Z);
    shading interp, colormap('autumn')
    axis equal, axis([-3.5 3.5 -3.5 3.5 -2 2])
    axis off, set(gcf, 'color', [1 1 1])

    currFrame = getframe;
end
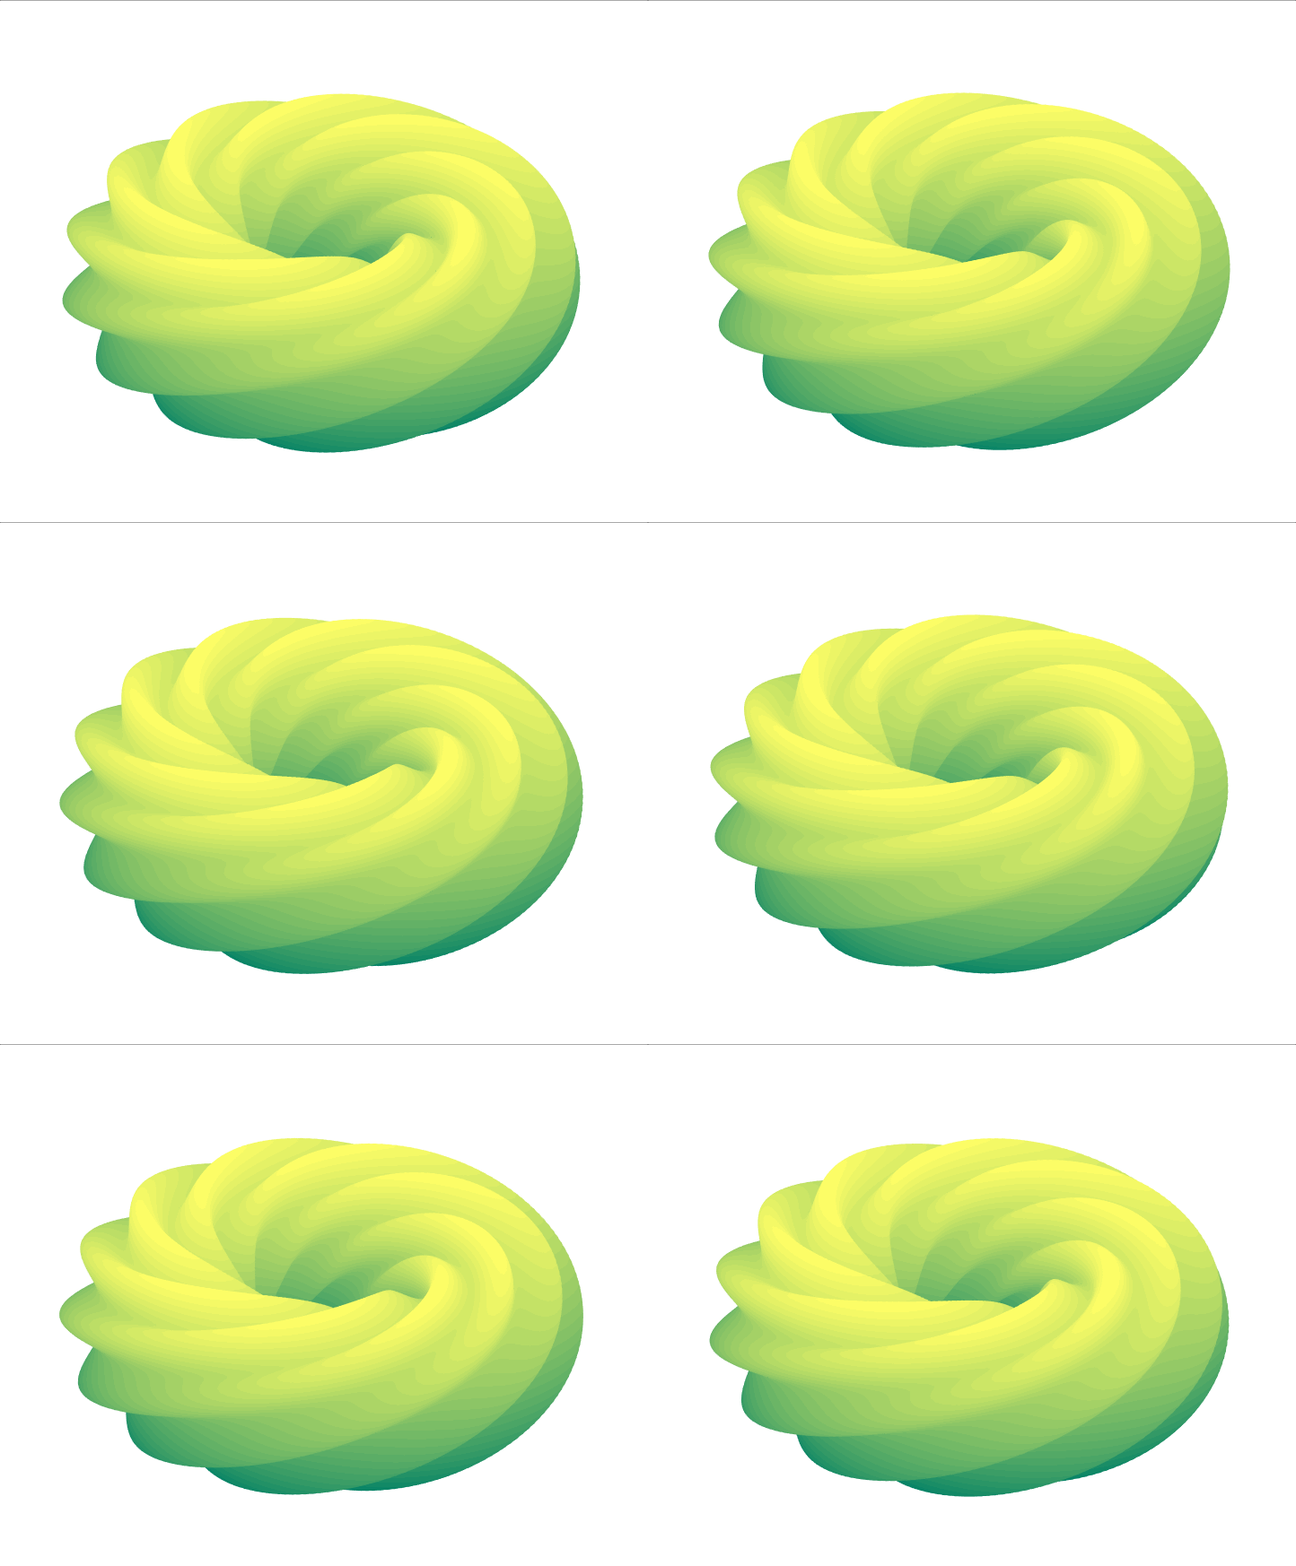
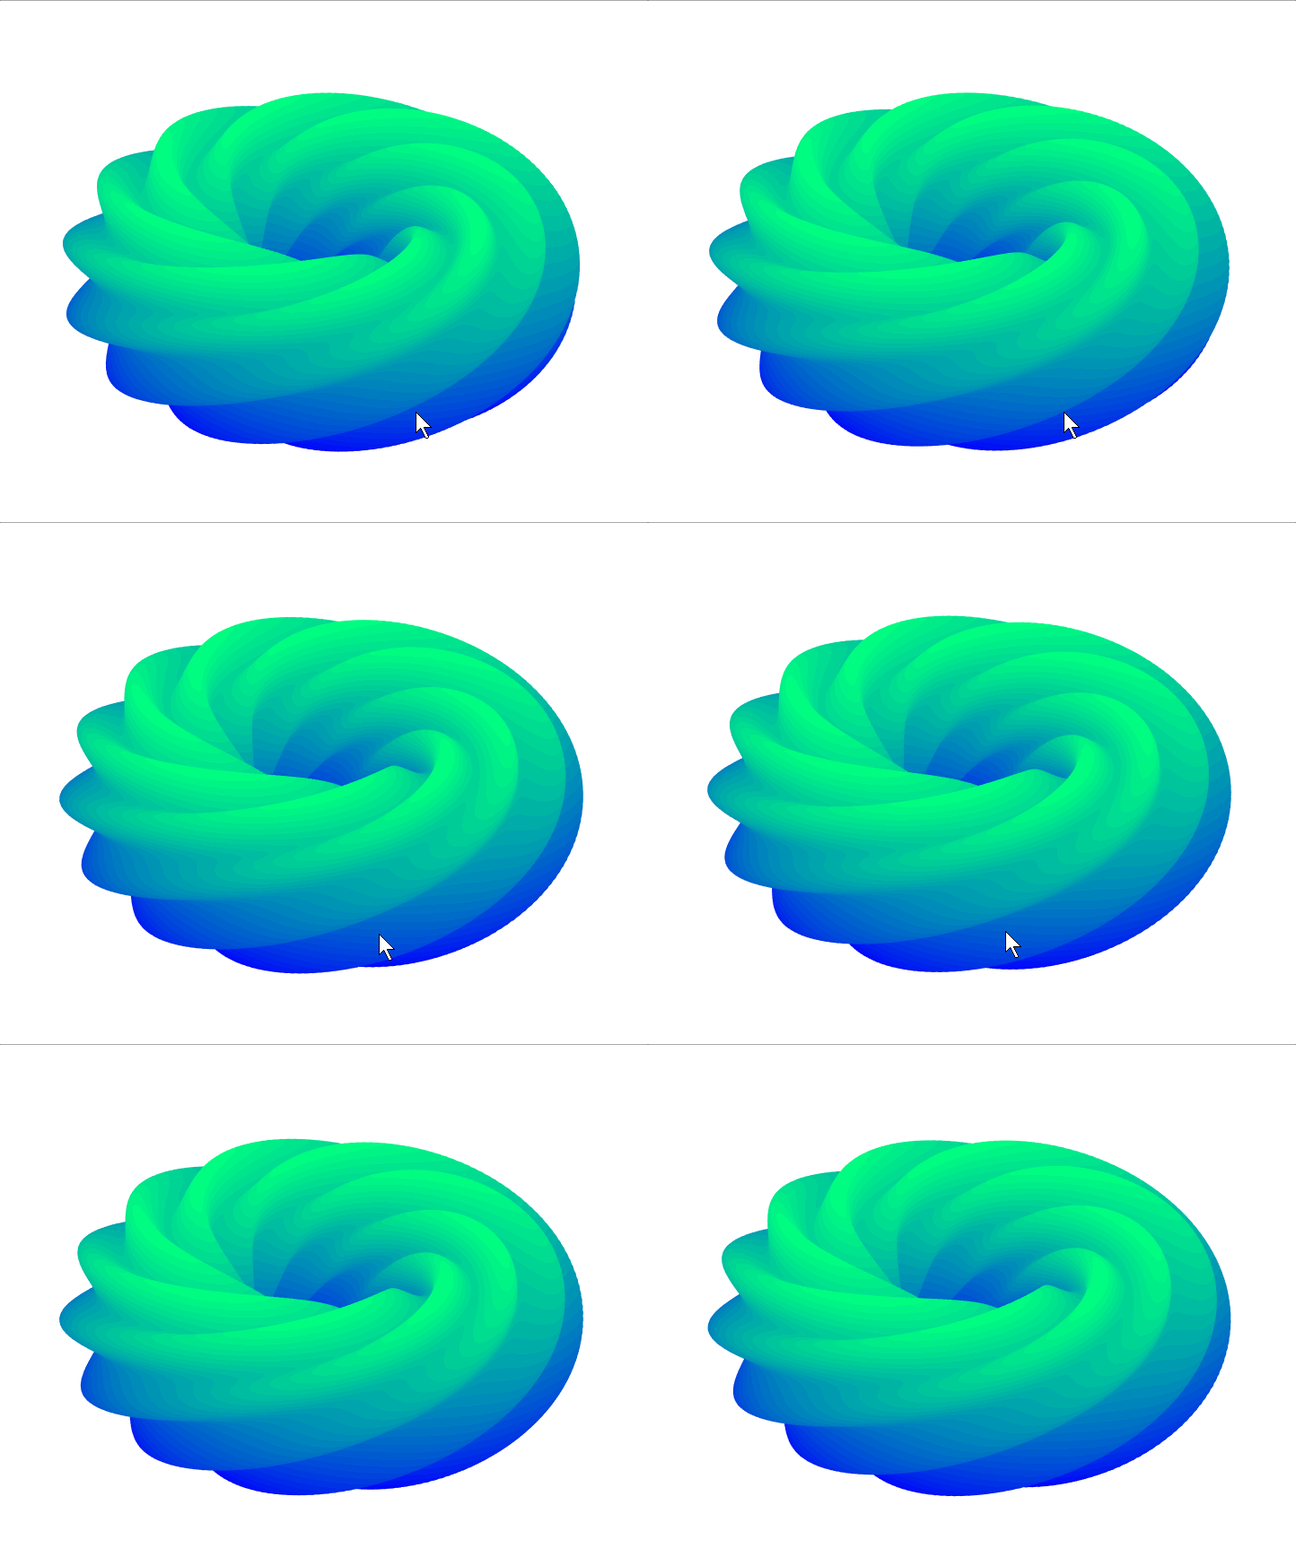
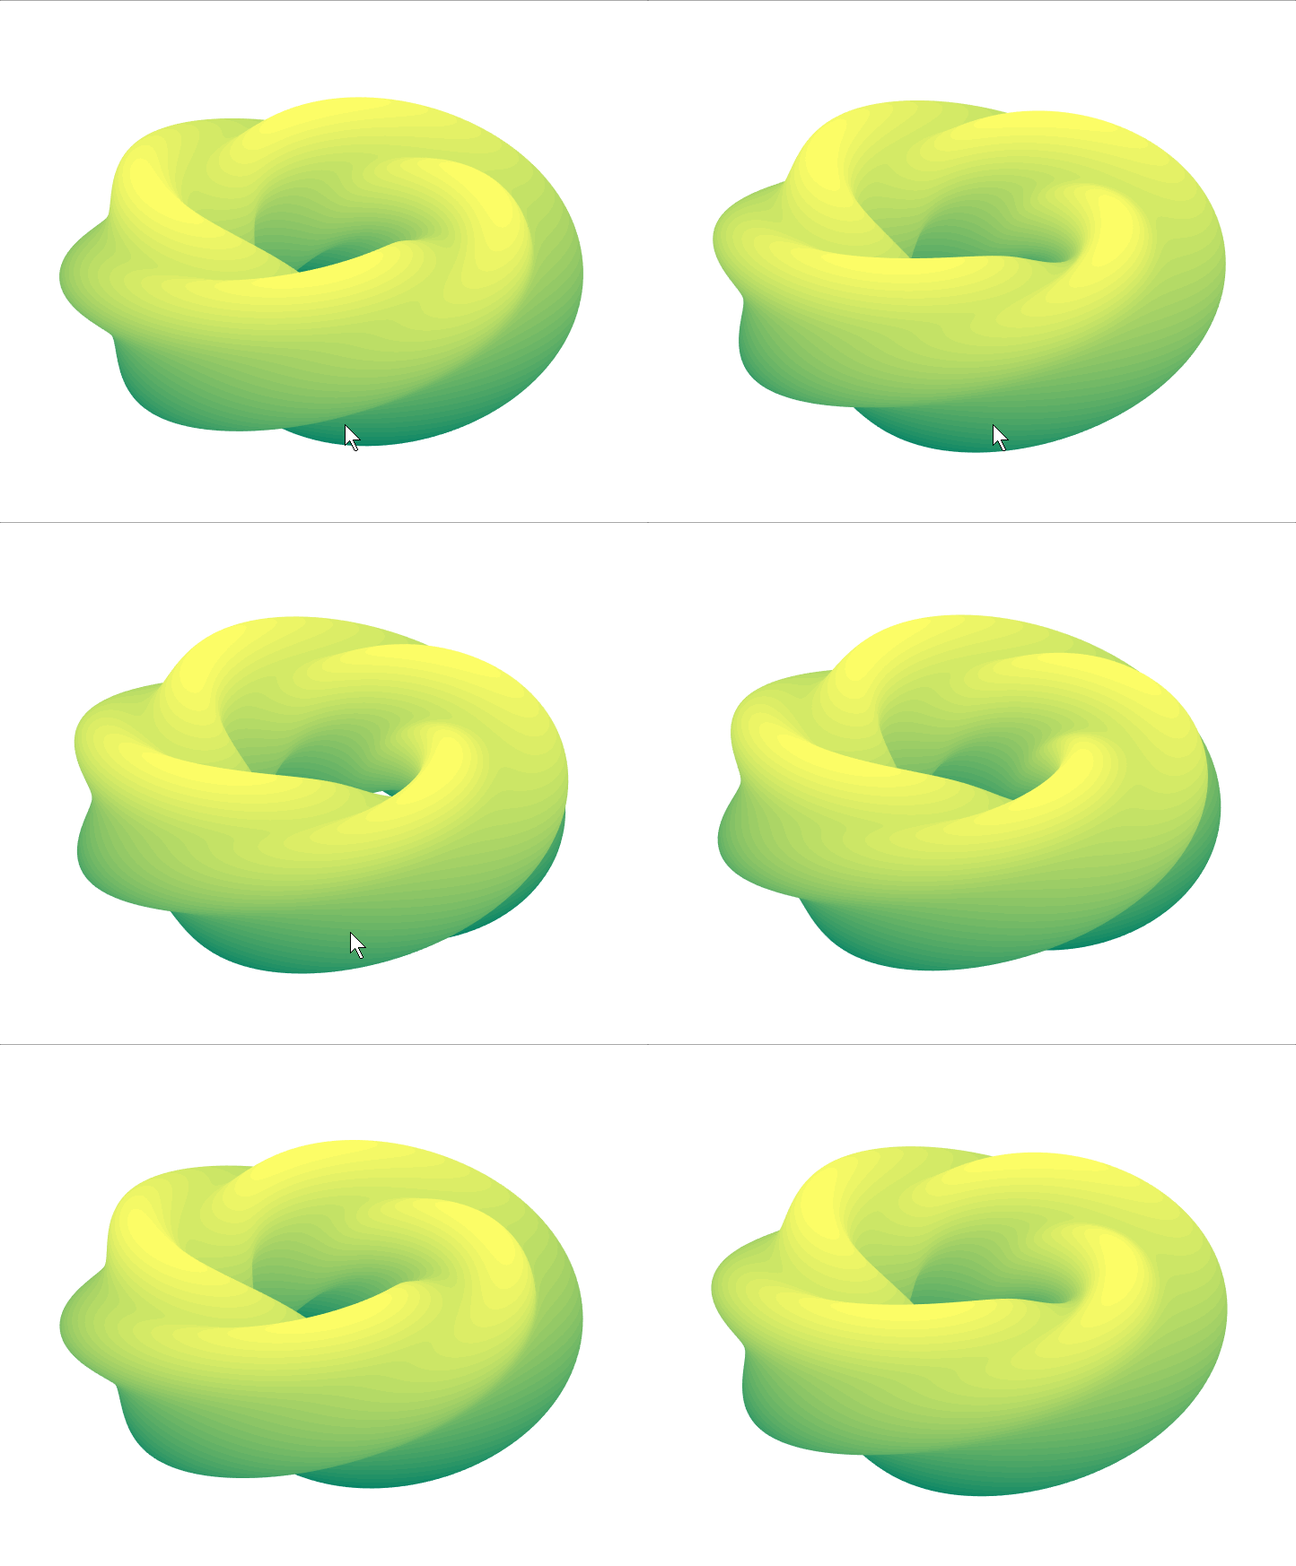
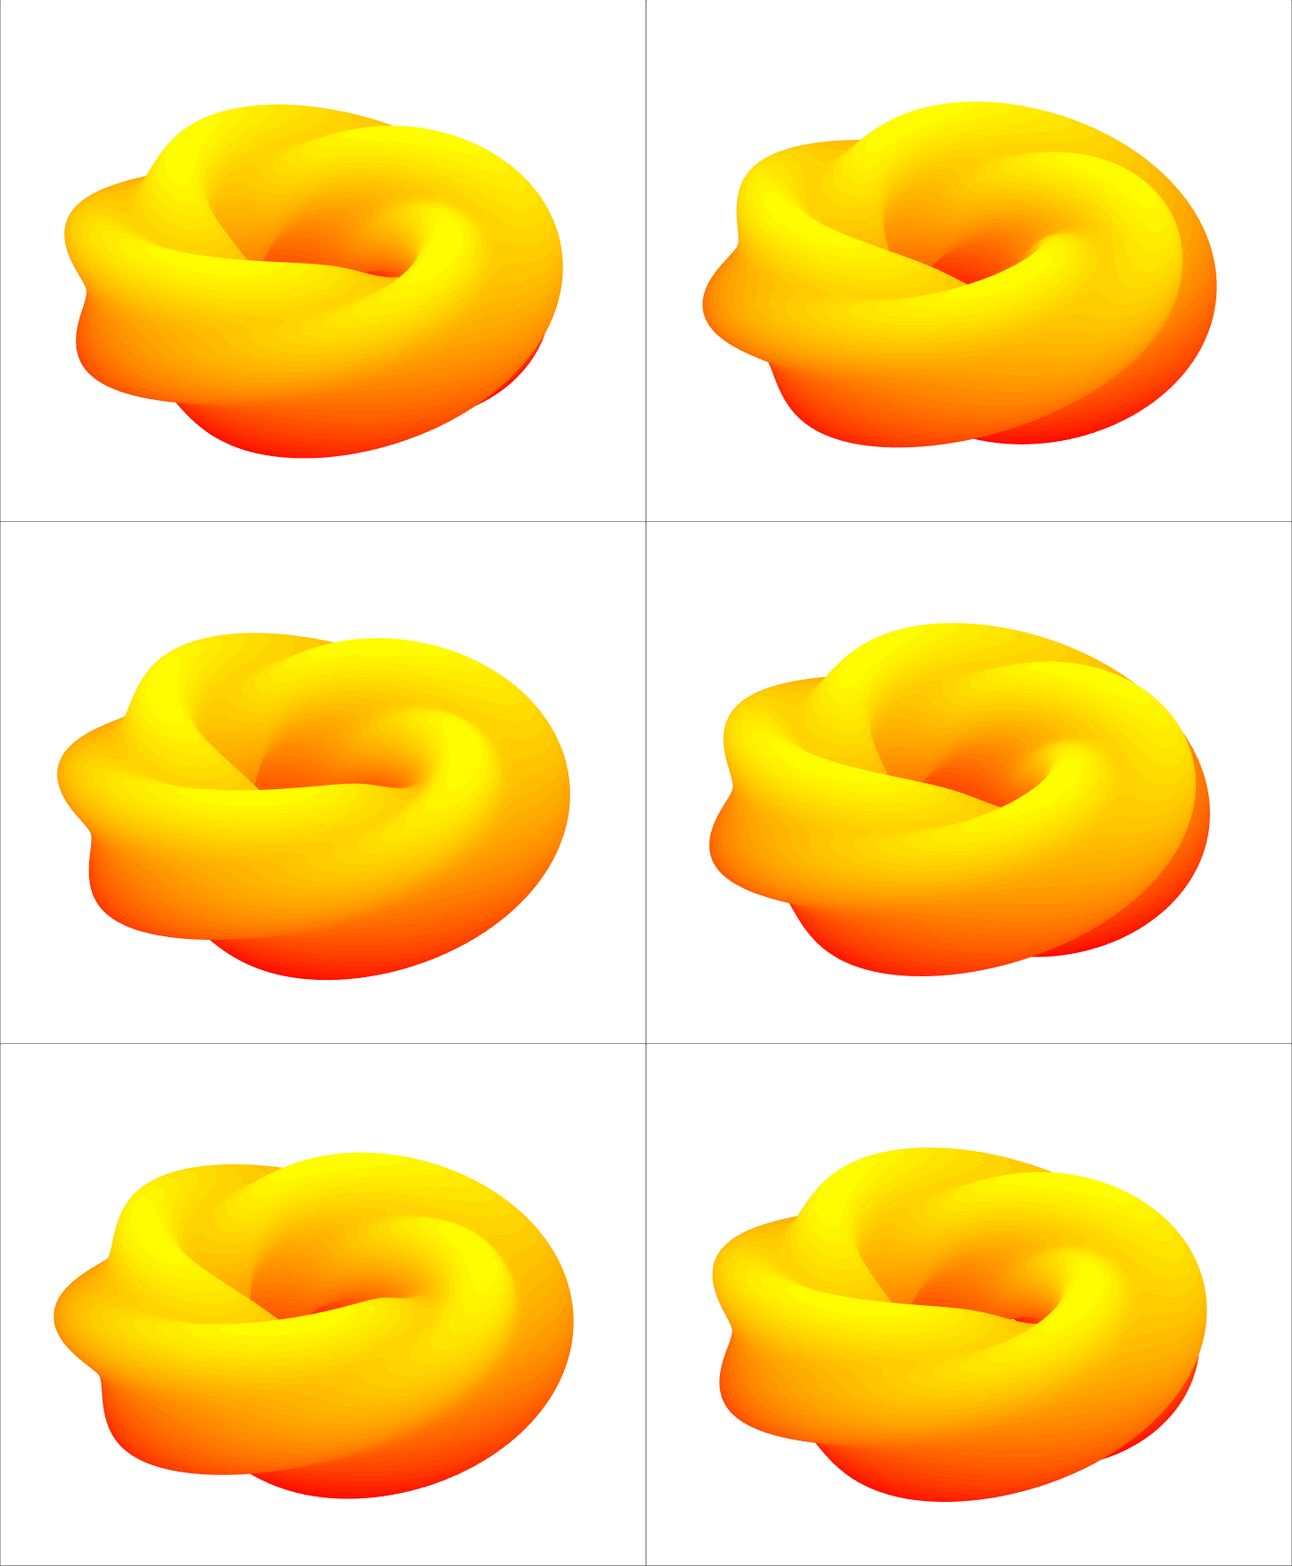
其他口味的曲奇饼也有,现烤现卖,酥脆可口
 5¥ 5¥
|
 6¥ 6¥
|
 6¥ 6¥
|
 5¥ 5¥
|
 10¥ 10¥
|
 8¥ 8¥
|
 5¥ 5¥
|
|
完结 cheers!
参考:
1、matlab入门教程
2、怎样把Matlab制作的动画保存成avi和gif格式
