2019独角兽企业重金招聘Python工程师标准>>> 
Prometheus是什么
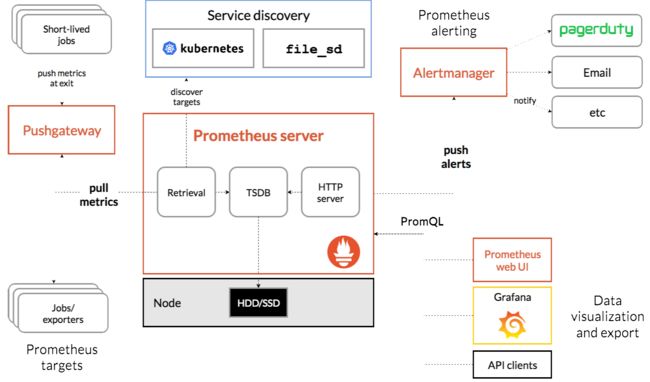
Prometheus(普罗米修斯)非常酷的开源监控系统。它支持多维度的指标数据模型,服务端通过HTTP协议定时拉取数据后,通过灵活的查询语言,实现监控的目的。
客户端记录相关指标数据,对外提供查询接口。Prometheus服务端通过服务器发现机制找到客户端,并定时抓取存储为时间序列数据。最后通过Grafana等图表工具集成展示。
Prometheus可以做什么
-
在业务层用作埋点系统
Prometheus支持各个主流开发语言(Go,java,python,ruby官方提供客户端,其他语言有第三方开源客户端)。我们可以通过客户端方面的对核心业务进行埋点。如下单流程、添加购物车流程。 -
在应用层用作应用监控系统
一些主流应用可以通过官方或第三方的导出器,来对这些应用做核心指标的收集。如redis,mysql。 -
在系统层用作系统监控
除了常用软件, prometheus也有相关系统层和网络层exporter,用以监控服务器或网络。 -
集成其他的监控
prometheus还可以通过各种exporte,集成其他的监控系统,收集监控数据,如AWS CloudWatch,JMX,Pingdom等等。
开始安装 prometheus
1 下载
https://prometheus.io/download/2 解压安装
tar xf prometheus-2.8.0.linux-amd64.tar.gz

mv prometheus-2.8.0.linux-amd64 /usr/local/prometheus

cd /usr/local/prometheus

./prometheus --version
3 启动
./prometheusnode节点安装agent
1 下载
https://prometheus.io/download/#node_exporter2 安装 agent
tar xf node_exporter-0.17.0.linux-amd64.tar.gz
cd node_exporter-0.17.0.linux-amd64
3 启动agent
./node_exporter向prometheus 注册节点
1 编辑配置文件
cd /usr/local/prometheus

# cat prometheus.yml
# my global config
global:
  scrape_interval:     15s # Set the scrape interval to every 15 seconds. Default is every 1 minute.
  evaluation_interval: 15s # Evaluate rules every 15 seconds. The default is every 1 minute.
  # scrape_timeout is set to the global default (10s).

# Alertmanager configuration
alerting:
  alertmanagers:
  - static_configs:
    - targets:
      # - alertmanager:9093

# Load rules once and periodically evaluate them according to the global 'evaluation_interval'.
rule_files:
  # - "first_rules.yml"
  # - "second_rules.yml"

# A scrape configuration containing exactly one endpoint to scrape:
# Here it's Prometheus itself.
scrape_configs:
  # The job name is added as a label `job=` to any timeseries scraped from this config.
  - job_name: 'prometheus'

    # metrics_path defaults to '/metrics'
    # scheme defaults to 'http'.

    static_configs:
    - targets: ['localhost:9090']

  - job_name: 'linux-node'          #添加一个job
    static_configs:
      - targets: ['10.10.25.151:9100']     配置被监控的节点IP
        labels:
          instance: node1

服务端监听 9090端口  prometheus web页面 http://ServerIP:9090
客户端监听 9100端口
2 重新启动 prometheus
./prometheus3 访问web页面
http://10.10.25.110:9090
4 查看节点是否注册
选择 Status 里面的 Target可以看到我们已经注册的节点

5 简单查看我们的监控指标
以内存剩余量为例在输入框输入 node_memory_Cached_bytes

什么是grafana
grafana 是一个开源的时序性统计和监控平台,支持例如 elasticsearch、graphite、influxdb 等众多的数据源,并以功能强大的界面编辑器著称。
安装grafana
1 下载
wget https://dl.grafana.com/oss/release/grafana-6.0.2-1.x86_64.rpm2 安装
yum install  grafana-6.0.2-1.x86_64.rpm
systemctl start grafana-server
systemctl enable grafana-server
grafana-server -v

grafana-server 监听端口为 3000
3 访问 grafana-server
http://ServerIP:3000
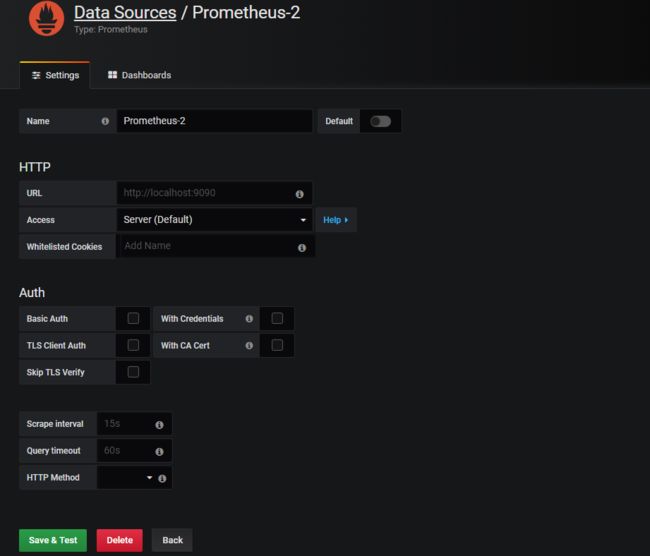
默认用户名密码为: admin admin4 添加数据源选择 Prometheus

设置数据源的server地址和监听端口并保存推出
5 添加Dashboard 也就是给节点添加可视化页面
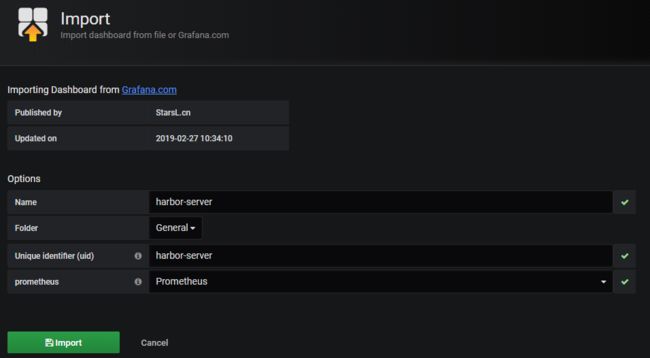
点击‘ + ’ 选择Import 输入模板ID 8919

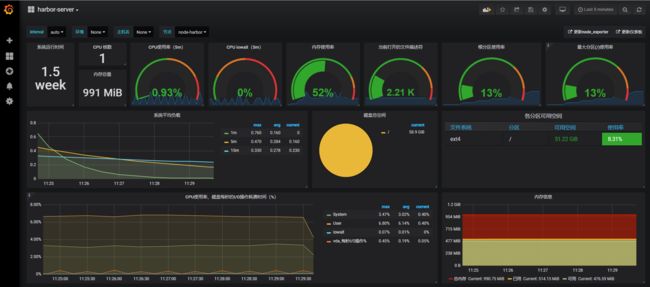
设置模板名称,uid 数据源 保存即可看到监控页面
注意 如果你是新的server会发现饼状图的数据加载不出,这个说明的是饼状图插件没有安装
6 安装饼状图插件
grafana-cli plugins install grafana-piechart-panel
systemctl  restart grafana-server
安装mysql作为grafana 源
1 添加源
rpm -Uvh http://dev.mysql.com/get/mysql-community-release-el7-5.noarch.rpm

yum repolist enabled | grep "mysql.*-community.*"
2 安装 mysql-5.6
yum -y install mysql-community-server3 启动mysql并简单安全设置
systemctl enable mysqld
systemctl start mysqld
systemctl status mysqld

mysql_secure_installation 设置密码一路Y
4 创建grafana 数据库
create database grafana;
create user grafana@'%' IDENTIFIED by 'grafana';
grant all on grafana.* to grafana@'%';
flush privileges;
5 修改配置文件连接mysql
vim /etc/grafana/grafana.ini

[database]
type = mysql
host = 127.0.0.1:3306
name = grafana
user = grafana
password =grafana
url = mysql://grafana:grafana@localhost:3306/grafana

[session]
provider = mysql
provider_config = `grafana:grafana@tcp(127.0.0.1:3306)/grafana`


systemctl restart grafana-server
6 重复grafana安装配置即可
HAproxy指标导出器的安装
1 进入opt目录下载HAproxy节点指标导出器:
wget https://github.com/prometheus/haproxy_exporter/releases/download/v0.9.0/haproxy_exporter-0.9.0.linux-amd64.tar.gz2 解压HAproxy节点指标导出器并删除压缩包:
tar -xvf haproxy_exporter-0.9.0.linux-amd64.tar.gz && rm haproxy_exporter-0.9.0.linux-amd64.tar.gz3 修改文件夹名称
mv haproxy_exporter-0.9.0.linux-amd64/ haproxy_exporter4 追加HAproxy配置文件:
cat << EOF >> /etc/haproxy/haproxy.cfg
listen stats
        mode http
        bind 0.0.0.0:5000
        stats enable
        stats hide-version
        stats uri /stats
        stats realm Haproxy\ Statistics
        stats auth admin:admin123
        stats admin if TRUE #启用管理功能
EOF
5 重启HAproxy:
/etc/init.d/haproxy reload6 进入对应文件夹后后台运行导出器程序:
nohup ./haproxy_exporter --haproxy.scrape-uri="http://admin:admin123@localhost:5000/stats;csv" 2>&1 &7 查看9100端口是否正常运行:
netstat -lntpWindows节点指标导出器的安装
1 下载Windows节点指标导出器:
https://github.com/martinlindhe/wmi_exporter/releases/download/v0.5.0/wmi_exporter-0.5.0-amd64.msi2 打开Prowershell执行一下命令,注意程序所在路径是否正确
msiexec /i C:\Users\Administrator\Downloads\wmi_exporter-0.5.0-amd64.msi ENABLED_COLLECTORS=iis,os,cpu,cs,memory,mssql,netframework_clrjit,netframework_clrinterop,netframework_clrexceptions,netframework_clrloading,netframework_clrlocksandthreads,netframework_clrmemory,net,service,system,tcp,textfile LISTEN_PORT=9182配置grafana + Telegram 告警
1.对接Telegram官方接口@BotFather

2.输入/newbot命令创建你自己的机器人

3.然后根据提示输入机器人的名称和用户名,用户名必须以bot结尾
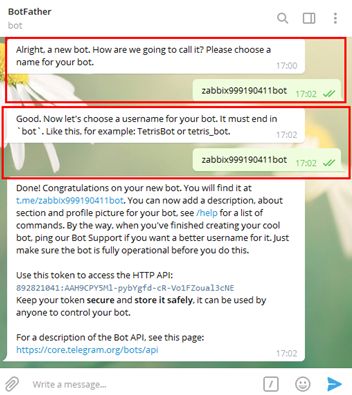
4.这样机器人就创建完成了,返回信息当中的token必须保存好备用
Done! Congratulations on your new bot. You will find it at t.me/zabbix999190411bot. You can now add a description, about section and profile picture for your bot, see /help for a list of commands. By the way, when you've finished creating your cool bot, ping our Bot Support if you want a better username for it. Just make sure the bot is fully operational before you do this.

Use this token to access the HTTP API:
892821041:AAH9CPY5Ml-pybYgfd-cR-Vo1FZoual3cNE
Keep your token secure and store it safely, it can be used by anyone to control your bot.

For a description of the Bot API, see this page: https://core.telegram.org/bots/api
5.接下来使用API/bottoken/API方法getMe获取自己的id
root@alex prometheus-2.8.1.linux-amd64]# curl https://api.telegram.org/bot892821041:AAH9CPY5Ml-pybYgfd-cR-Vo1FZoual3cNE/getMe
{"ok":true,"result":{"id":892821041,"is_bot":true,"first_name":"zabbix999190411bot","username":"zabbix999190411bot"}}
![]()
6.获取群ID
在Telegram新建group,然后添加成员刚创建的机器人,调用API方法getUPdates获取群ID
https://api.telegram.org/bot892821041:AAH9CPY5Ml-pybYgfd-cR-Vo1FZoual3cNE/getUpdates
{"ok":true,"result":[{"update_id":434572998,
"message":{"message_id":5,"from":{"id":787933444,"is_bot":false,"first_name":"Alex","last_name":"Liu","language_code":"zh-hans"},"chat":{"id":-234667255,
"title":"ZABBIX999","type":"group","all_members_are_administrators":true},"date":1554977987,"text":"/getMe","entities":[{"offset":0,"length":6,"type":"bot_command"}]}}]}
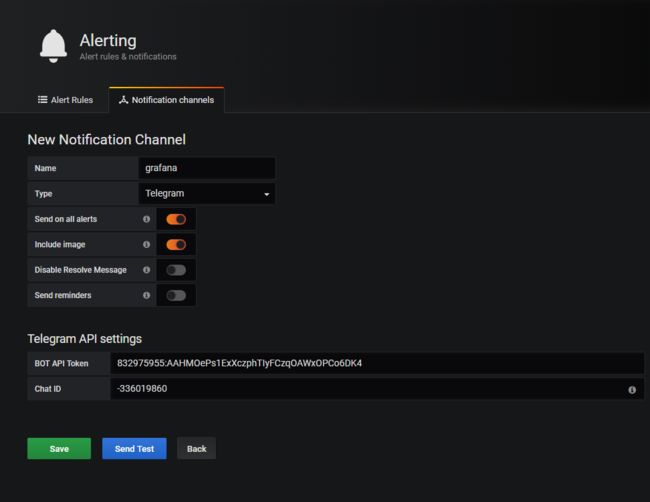
7 配置 grafana Alerting
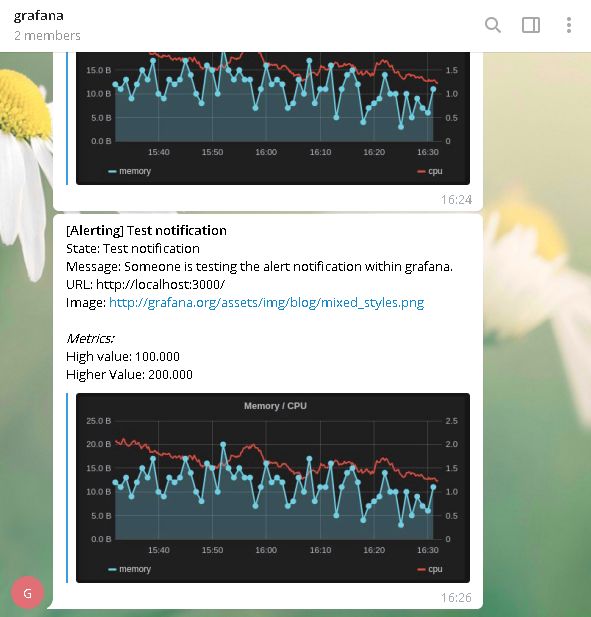
配置完成后 点击send test 测试
收到的测试告警
如果使用微信配置是相同的,只需要获取企业账号的相关ID即可
8 测试服务器报警
测试服务器告警以真实服务器为例,测试内存数据告警
查看正式服务器内存
[root@lb-1 ~]# free -m
              total        used        free      shared  buff/cache   available
Mem:           1839         176        1382           8         281        1494
Swap:          2047           0        2047
添加魔板 8919 这里的配置不做赘述以上面已经讲过
接下来修改模板添加告警json,打开模板设置修改 json
修改json增加告警需要增加段json 块,必须要注意的是配置wean告警必须要替换里面的变量 $node 为prometheus里面配置文件相应的instance标签的名字否则不能告警.
{
"annotations": {
"list": [
{
"builtIn": 1,
"datasource": "-- Grafana --",
"enable": true,
"hide": true,
"iconColor": "rgba(0, 211, 255, 1)",
"name": "Annotations & Alerts",
"type": "dashboard"
}
]
},
"description": "使用 Node Exporter v0.16 0.17,精简优化重要指标展示。包含:CPU 内存 磁盘 IO 网络 温度等监控指标。https://github.com/starsliao/Prometheus",
"editable": true,
"gnetId": 8919,
"graphTooltip": 0,
"id": 11,
"iteration": 1555301097807,
"links": [
{
"icon": "external link",
"tags": [],
"targetBlank": true,
"title": "更新node_exporter",
"tooltip": "",
"type": "link",
"url": "https://github.com/prometheus/node_exporter/releases"
},
{
"icon": "external link",
"tags": [],
"targetBlank": true,
"title": "更新仪表板",
"tooltip": "",
"type": "link",
"url": "https://grafana.com/dashboards/8919"
}
],
"panels": [
{
"content": "",
"editable": true,
"error": false,
"gridPos": {
"h": 1,
"w": 24,
"x": 0,
"y": 0
},
"id": 11,
"links": [],
"maxPerRow": 6,
"mode": "html",
"repeat": "node",
"repeatDirection": "h",
"scopedVars": {
"node": {
"selected": true,
"text": "nginxvlb",
"value": "nginxvlb"
}
},
"style": {},
"title": "nginxvlb",
"type": "text"
},
{
"cacheTimeout": null,
"colorBackground": false,
"colorValue": false,
"colors": [
"rgba(245, 54, 54, 0.9)",
"rgba(237, 129, 40, 0.89)",
"rgba(50, 172, 45, 0.97)"
],
"datasource": "Prometheus",
"decimals": 1,
"description": "",
"format": "s",
"gauge": {
"maxValue": 100,
"minValue": 0,
"show": false,
"thresholdLabels": false,
"thresholdMarkers": true
},
"gridPos": {
"h": 5,
"w": 2,
"x": 0,
"y": 1
},
"hideTimeOverride": true,
"id": 15,
"interval": null,
"links": [],
"mappingType": 1,
"mappingTypes": [
{
"name": "value to text",
"value": 1
},
{
"name": "range to text",
"value": 2
}
],
"maxDataPoints": 100,
"nullPointMode": "null",
"nullText": null,
"postfix": "",
"postfixFontSize": "50%",
"prefix": "",
"prefixFontSize": "50%",
"rangeMaps": [
{
"from": "null",
"text": "N/A",
"to": "null"
}
],
"sparkline": {
"fillColor": "rgba(31, 118, 189, 0.18)",
"full": false,
"lineColor": "rgb(31, 120, 193)",
"show": false
},
"tableColumn": "",
"targets": [
{
"expr": "time() - node_boot_time_seconds{instance=~\"nginxvlb\"}",
"format": "time_series",
"hide": false,
"instant": true,
"intervalFactor": 2,
"refId": "A",
"step": 40
}
],
"thresholds": "",
"title": "系统运行时间",
"type": "singlestat",
"valueFontSize": "100%",
"valueMaps": [
{
"op": "=",
"text": "N/A",
"value": "null"
}
],
"valueName": "current"
},
{
"cacheTimeout": null,
"colorBackground": false,
"colorValue": false,
"colors": [
"rgba(245, 54, 54, 0.9)",
"rgba(237, 129, 40, 0.89)",
"rgba(50, 172, 45, 0.97)"
],
"datasource": "Prometheus",
"description": "",
"format": "short",
"gauge": {
"maxValue": 100,
"minValue": 0,
"show": false,
"thresholdLabels": false,
"thresholdMarkers": true
},
"gridPos": {
"h": 2,
"w": 2,
"x": 2,
"y": 1
},
"id": 14,
"interval": null,
"links": [],
"mappingType": 1,
"mappingTypes": [
{
"name": "value to text",
"value": 1
},
{
"name": "range to text",
"value": 2
}
],
"maxDataPoints": 100,
"maxPerRow": 6,
"nullPointMode": "null",
"nullText": null,
"postfix": "",
"postfixFontSize": "50%",
"prefix": "",
"prefixFontSize": "50%",
"rangeMaps": [
{
"from": "null",
"text": "N/A",
"to": "null"
}
],
"sparkline": {
"fillColor": "rgba(31, 118, 189, 0.18)",
"full": false,
"lineColor": "rgb(31, 120, 193)",
"show": false
},
"tableColumn": "",
"targets": [
{
"expr": "count(count(node_cpu_seconds_total{instance=~\"nginxvlb\", mode='system'}) by (cpu))",
"format": "time_series",
"instant": true,
"intervalFactor": 1,
"legendFormat": "",
"refId": "A",
"step": 20
}
],
"thresholds": "",
"title": "CPU 核数",
"type": "singlestat",
"valueFontSize": "100%",
"valueMaps": [
{
"op": "=",
"text": "N/A",
"value": "null"
}
],
"valueName": "current"
},
{
"cacheTimeout": null,
"colorBackground": false,
"colorValue": true,
"colors": [
"rgba(50, 172, 45, 0.97)",
"rgba(237, 129, 40, 0.89)",
"rgba(245, 54, 54, 0.9)"
],
"datasource": "Prometheus",
"decimals": 2,
"description": "",
"format": "percent",
"gauge": {
"maxValue": 100,
"minValue": 0,
"show": true,
"thresholdLabels": false,
"thresholdMarkers": true
},
"gridPos": {
"h": 5,
"w": 3,
"x": 4,
"y": 1
},
"id": 167,
"interval": null,
"links": [],
"mappingType": 1,
"mappingTypes": [
{
"name": "value to text",
"value": 1
},
{
"name": "range to text",
"value": 2
}
],
"maxDataPoints": 100,
"maxPerRow": 12,
"nullPointMode": "null",
"nullText": null,
"postfix": "",
"postfixFontSize": "50%",
"prefix": "",
"prefixFontSize": "50%",
"rangeMaps": [
{
"from": "null",
"text": "N/A",
"to": "null"
}
],
"sparkline": {
"fillColor": "rgba(31, 118, 189, 0.18)",
"full": false,
"lineColor": "rgb(31, 120, 193)",
"show": true
},
"tableColumn": "",
"targets": [
{
"expr": "100 - (avg(irate(node_cpu_seconds_total{instance=~\"nginxvlb\",mode=\"idle\"}[5m])) * 100)",
"format": "time_series",
"hide": false,
"interval": "",
"intervalFactor": 1,
"legendFormat": "",
"refId": "A",
"step": 20
}
],
"thresholds": "50,80",
"title": "CPU使用率(5m)",
"type": "singlestat",
"valueFontSize": "80%",
"valueMaps": [
{
"op": "=",
"text": "N/A",
"value": "null"
}
],
"valueName": "current"
},
{
"cacheTimeout": null,
"colorBackground": false,
"colorValue": true,
"colors": [
"rgba(50, 172, 45, 0.97)",
"rgba(237, 129, 40, 0.89)",
"rgba(245, 54, 54, 0.9)"
],
"datasource": "Prometheus",
"decimals": 2,
"description": "",
"format": "percent",
"gauge": {
"maxValue": 100,
"minValue": 0,
"show": true,
"thresholdLabels": false,
"thresholdMarkers": true
},
"gridPos": {
"h": 5,
"w": 3,
"x": 7,
"y": 1
},
"id": 20,
"interval": null,
"links": [],
"mappingType": 1,
"mappingTypes": [
{
"name": "value to text",
"value": 1
},
{
"name": "range to text",
"value": 2
}
],
"maxDataPoints": 100,
"maxPerRow": 12,
"nullPointMode": "null",
"nullText": null,
"postfix": "",
"postfixFontSize": "50%",
"prefix": "",
"prefixFontSize": "50%",
"rangeMaps": [
{
"from": "null",
"text": "N/A",
"to": "null"
}
],
"sparkline": {
"fillColor": "rgba(31, 118, 189, 0.18)",
"full": false,
"lineColor": "rgb(31, 120, 193)",
"show": true
},
"tableColumn": "",
"targets": [
{
"expr": "avg(irate(node_cpu_seconds_total{instance=~\"nginxvlb\",mode=\"iowait\"}[5m])) * 100",
"format": "time_series",
"hide": false,
"interval": "",
"intervalFactor": 1,
"legendFormat": "",
"refId": "A",
"step": 20
}
],
"thresholds": "20,50",
"title": "CPU iowait(5m)",
"type": "singlestat",
"valueFontSize": "80%",
"valueMaps": [
{
"op": "=",
"text": "N/A",
"value": "null"
}
],
"valueName": "current"
},
{
"cacheTimeout": null,
"colorBackground": false,
"colorValue": true,
"colors": [
"rgba(50, 172, 45, 0.97)",
"rgba(237, 129, 40, 0.89)",
"rgba(245, 54, 54, 0.9)"
],
"datasource": "Prometheus",
"decimals": 0,
"description": "",
"format": "percent",
"gauge": {
"maxValue": 100,
"minValue": 0,
"show": true,
"thresholdLabels": false,
"thresholdMarkers": true
},
"gridPos": {
"h": 5,
"w": 3,
"x": 10,
"y": 1
},
"hideTimeOverride": false,
"id": 172,
"interval": null,
"links": [],
"mappingType": 1,
"mappingTypes": [
{
"name": "value to text",
"value": 1
},
{
"name": "range to text",
"value": 2
}
],
"maxDataPoints": 100,
"maxPerRow": 6,
"nullPointMode": "null",
"nullText": null,
"postfix": "",
"postfixFontSize": "50%",
"prefix": "",
"prefixFontSize": "50%",
"rangeMaps": [
{
"from": "null",
"text": "N/A",
"to": "null"
}
],
"sparkline": {
"fillColor": "rgba(31, 118, 189, 0.18)",
"full": false,
"lineColor": "rgb(31, 120, 193)",
"show": true
},
"tableColumn": "",
"targets": [
{
"expr": "(1 - (node_memory_MemAvailable_bytes{instance=~\"nginxvlb\"} / (node_memory_MemTotal_bytes{instance=~\"nginxvlb\"})))* 100",
"format": "time_series",
"hide": false,
"interval": "10s",
"intervalFactor": 1,
"refId": "A",
"step": 20
}
],
"thresholds": "80,90",
"title": "内存使用率",
"type": "singlestat",
"valueFontSize": "80%",
"valueMaps": [],
"valueName": "current"
},
{
"cacheTimeout": null,
"colorBackground": false,
"colorPostfix": false,
"colorPrefix": false,
"colorValue": true,
"colors": [
"rgba(50, 172, 45, 0.97)",
"rgba(237, 129, 40, 0.89)",
"rgba(245, 54, 54, 0.9)"
],
"datasource": "Prometheus",
"decimals": 2,
"description": "",
"format": "short",
"gauge": {
"maxValue": 10000,
"minValue": null,
"show": true,
"thresholdLabels": false,
"thresholdMarkers": true
},
"gridPos": {
"h": 5,
"w": 3,
"x": 13,
"y": 1
},
"hideTimeOverride": false,
"id": 16,
"interval": null,
"links": [],
"mappingType": 1,
"mappingTypes": [
{
"name": "value to text",
"value": 1
},
{
"name": "range to text",
"value": 2
}
],
"maxDataPoints": 100,
"maxPerRow": 6,
"nullPointMode": "null",
"nullText": null,
"postfix": "",
"postfixFontSize": "50%",
"prefix": "",
"prefixFontSize": "50%",
"rangeMaps": [
{
"from": "null",
"text": "N/A",
"to": "null"
}
],
"sparkline": {
"fillColor": "rgba(31, 118, 189, 0.18)",
"full": false,
"lineColor": "rgb(31, 120, 193)",
"show": true
},
"tableColumn": "",
"targets": [
{
"expr": "node_filefd_allocated{instance=~\"nginxvlb\"}",
"format": "time_series",
"instant": false,
"interval": "10s",
"intervalFactor": 1,
"refId": "B"
}
],
"thresholds": "7000,9000",
"title": "当前打开的文件描述符",
"type": "singlestat",
"valueFontSize": "70%",
"valueMaps": [],
"valueName": "current"
},
{
"cacheTimeout": null,
"colorBackground": false,
"colorValue": true,
"colors": [
"rgba(50, 172, 45, 0.97)",
"rgba(237, 129, 40, 0.89)",
"rgba(245, 54, 54, 0.9)"
],
"datasource": "Prometheus",
"decimals": null,
"description": "",
"format": "percent",
"gauge": {
"maxValue": 100,
"minValue": 0,
"show": true,
"thresholdLabels": false,
"thresholdMarkers": true
},
"gridPos": {
"h": 5,
"w": 4,
"x": 16,
"y": 1
},
"id": 166,
"interval": null,
"links": [],
"mappingType": 1,
"mappingTypes": [
{
"name": "value to text",
"value": 1
},
{
"name": "range to text",
"value": 2
}
],
"maxDataPoints": 100,
"maxPerRow": 6,
"nullPointMode": "null",
"nullText": null,
"postfix": "",
"postfixFontSize": "50%",
"prefix": "",
"prefixFontSize": "50%",
"rangeMaps": [
{
"from": "null",
"text": "N/A",
"to": "null"
}
],
"repeatDirection": "h",
"sparkline": {
"fillColor": "rgba(31, 118, 189, 0.18)",
"full": false,
"lineColor": "rgb(31, 120, 193)",
"show": true
},
"tableColumn": "",
"targets": [
{
"expr": "100 - ((node_filesystem_avail_bytes{instance=~\"nginxvlb\",mountpoint=\"/\",fstype=~\"ext4|xfs\"} * 100) / node_filesystem_size_bytes {instance=~\"nginxvlb\",mountpoint=\"/\",fstype=~\"ext4|xfs\"})",
"format": "time_series",
"interval": "10s",
"intervalFactor": 1,
"refId": "A",
"step": 20
}
],
"thresholds": "70,90",
"title": "根分区使用率",
"type": "singlestat",
"valueFontSize": "80%",
"valueMaps": [
{
"op": "=",
"text": "N/A",
"value": "null"
}
],
"valueName": "current"
},
{
"cacheTimeout": null,
"colorBackground": false,
"colorValue": true,
"colors": [
"rgba(50, 172, 45, 0.97)",
"rgba(237, 129, 40, 0.89)",
"rgba(245, 54, 54, 0.9)"
],
"datasource": "Prometheus",
"decimals": null,
"description": "通过变量maxmount获取最大的分区。",
"format": "percent",
"gauge": {
"maxValue": 100,
"minValue": 0,
"show": true,
"thresholdLabels": false,
"thresholdMarkers": true
},
"gridPos": {
"h": 5,
"w": 4,
"x": 20,
"y": 1
},
"id": 154,
"interval": null,
"links": [],
"mappingType": 1,
"mappingTypes": [
{
"name": "value to text",
"value": 1
},
{
"name": "range to text",
"value": 2
}
],
"maxDataPoints": 100,
"maxPerRow": 6,
"nullPointMode": "null",
"nullText": null,
"postfix": "",
"postfixFontSize": "50%",
"prefix": "",
"prefixFontSize": "50%",
"rangeMaps": [
{
"from": "null",
"text": "N/A",
"to": "null"
}
],
"repeat": null,
"repeatDirection": "h",
"sparkline": {
"fillColor": "rgba(31, 118, 189, 0.18)",
"full": false,
"lineColor": "rgb(31, 120, 193)",
"show": true
},
"tableColumn": "",
"targets": [
{
"expr": "100 - ((node_filesystem_avail_bytes{instance=~\"nginxvlb\",mountpoint=\"$maxmount\",fstype=~\"ext4|xfs\"} * 100) / node_filesystem_size_bytes {instance=~\"nginxvlb\",mountpoint=\"$maxmount\",fstype=~\"ext4|xfs\"})",
"format": "time_series",
"interval": "10s",
"intervalFactor": 1,
"refId": "A",
"step": 20
}
],
"thresholds": "70,90",
"title": "最大分区($maxmount)使用率",
"type": "singlestat",
"valueFontSize": "80%",
"valueMaps": [
{
"op": "=",
"text": "N/A",
"value": "null"
}
],
"valueName": "current"
},
{
"cacheTimeout": null,
"colorBackground": false,
"colorValue": false,
"colors": [
"rgba(245, 54, 54, 0.9)",
"rgba(237, 129, 40, 0.89)",
"rgba(50, 172, 45, 0.97)"
],
"datasource": "Prometheus",
"decimals": null,
"description": "",
"format": "bytes",
"gauge": {
"maxValue": 100,
"minValue": 0,
"show": false,
"thresholdLabels": false,
"thresholdMarkers": true
},
"gridPos": {
"h": 3,
"w": 2,
"x": 2,
"y": 3
},
"id": 75,
"interval": null,
"links": [],
"mappingType": 1,
"mappingTypes": [
{
"name": "value to text",
"value": 1
},
{
"name": "range to text",
"value": 2
}
],
"maxDataPoints": 100,
"maxPerRow": 6,
"nullPointMode": "null",
"nullText": null,
"postfix": "",
"postfixFontSize": "70%",
"prefix": "",
"prefixFontSize": "50%",
"rangeMaps": [
{
"from": "null",
"text": "N/A",
"to": "null"
}
],
"sparkline": {
"fillColor": "rgba(31, 118, 189, 0.18)",
"full": false,
"lineColor": "rgb(31, 120, 193)",
"show": false
},
"tableColumn": "",
"targets": [
{
"expr": "node_memory_MemTotal_bytes{instance=~\"nginxvlb\"}",
"format": "time_series",
"instant": true,
"intervalFactor": 1,
"legendFormat": "{{instance}}",
"refId": "A",
"step": 20
}
],
"thresholds": "",
"title": "内存总量",
"type": "singlestat",
"valueFontSize": "80%",
"valueMaps": [
{
"op": "=",
"text": "N/A",
"value": "null"
}
],
"valueName": "current"
},
{
"aliasColors": {
"15分钟": "#6ED0E0",
"1分钟": "#BF1B00",
"5分钟": "#CCA300"
},
"bars": false,
"dashLength": 10,
"dashes": false,
"datasource": "Prometheus",
"editable": true,
"error": false,
"fill": 1,
"grid": {},
"gridPos": {
"h": 6,
"w": 11,
"x": 0,
"y": 6
},
"height": "300",
"id": 13,
"legend": {
"alignAsTable": true,
"avg": true,
"current": true,
"max": true,
"min": false,
"rightSide": true,
"show": true,
"total": false,
"values": true
},
"lines": true,
"linewidth": 2,
"links": [],
"maxPerRow": 6,
"nullPointMode": "null as zero",
"paceLength": 10,
"percentage": false,
"pointradius": 5,
"points": false,
"renderer": "flot",
"repeat": null,
"seriesOverrides": [],
"spaceLength": 10,
"stack": false,
"steppedLine": false,
"targets": [
{
"expr": "node_load1{instance=~\"nginxvlb\"}",
"format": "time_series",
"instant": false,
"interval": "10s",
"intervalFactor": 2,
"legendFormat": "1m",
"metric": "",
"refId": "A",
"step": 20,
"target": ""
},
{
"expr": "node_load5{instance=~\"nginxvlb\"}",
"format": "time_series",
"instant": false,
"interval": "10s",
"intervalFactor": 2,
"legendFormat": "5m",
"refId": "B",
"step": 20
},
{
"expr": "node_load15{instance=~\"nginxvlb\"}",
"format": "time_series",
"instant": false,
"interval": "10s",
"intervalFactor": 2,
"legendFormat": "15m",
"refId": "C",
"step": 20
}
],
"thresholds": [],
"timeFrom": null,
"timeRegions": [],
"timeShift": null,
"title": "系统平均负载",
"tooltip": {
"msResolution": false,
"shared": true,
"sort": 0,
"value_type": "cumulative"
},
"type": "graph",
"xaxis": {
"buckets": null,
"mode": "time",
"name": null,
"show": true,
"values": []
},
"yaxes": [
{
"format": "short",
"logBase": 1,
"max": null,
"min": null,
"show": true
},
{
"format": "short",
"logBase": 1,
"max": null,
"min": null,
"show": true
}
],
"yaxis": {
"align": false,
"alignLevel": null
}
},
{
"aliasColors": {
"/": "#eab839",
"/boot": "#bf1b00",
"/data": "#1f78c1"
},
"breakPoint": "100%",
"cacheTimeout": null,
"combine": {
"label": "Others",
"threshold": ""
},
"datasource": "Prometheus",
"decimals": 1,
"fontSize": "50%",
"format": "bytes",
"gridPos": {
"h": 6,
"w": 5,
"x": 11,
"y": 6
},
"hideTimeOverride": false,
"id": 171,
"interval": null,
"legend": {
"header": "",
"percentage": false,
"percentageDecimals": 0,
"show": true,
"sideWidth": 142,
"values": true
},
"legendType": "Right side",
"links": [],
"maxDataPoints": 3,
"nullPointMode": "connected",
"pieType": "pie",
"strokeWidth": "2",
"targets": [
{
"expr": "node_filesystem_size_bytes {instance=~\"nginxvlb\",fstype=~\"ext4|xfs\"}",
"format": "time_series",
"instant": true,
"interval": "10s",
"intervalFactor": 1,
"legendFormat": "{{mountpoint}}",
"refId": "A"
}
],
"title": "磁盘总空间",
"type": "grafana-piechart-panel",
"valueName": "current"
},
{
"columns": [],
"datasource": "Prometheus",
"fontSize": "120%",
"gridPos": {
"h": 6,
"w": 8,
"x": 16,
"y": 6
},
"id": 164,
"links": [],
"pageSize": null,
"scroll": true,
"showHeader": true,
"sort": {
"col": 11,
"desc": true
},
"styles": [
{
"alias": "Time",
"dateFormat": "YYYY-MM-DD HH:mm:ss",
"pattern": "Time",
"type": "hidden"
},
{
"alias": "分区",
"colorMode": null,
"colors": [
"rgba(50, 172, 45, 0.97)",
"rgba(237, 129, 40, 0.89)",
"rgba(245, 54, 54, 0.9)"
],
"dateFormat": "YYYY-MM-DD HH:mm:ss",
"decimals": 2,
"mappingType": 1,
"pattern": "mountpoint",
"thresholds": [
""
],
"type": "string",
"unit": "bytes"
},
{
"alias": "可用空间",
"colorMode": "value",
"colors": [
"rgba(245, 54, 54, 0.9)",
"rgba(237, 129, 40, 0.89)",
"rgba(50, 172, 45, 0.97)"
],
"dateFormat": "YYYY-MM-DD HH:mm:ss",
"decimals": 2,
"mappingType": 1,
"pattern": "Value #A",
"thresholds": [
"10000000000",
"20000000000"
],
"type": "number",
"unit": "bytes"
},
{
"alias": "使用率",
"colorMode": "cell",
"colors": [
"rgba(50, 172, 45, 0.97)",
"rgba(237, 129, 40, 0.89)",
"rgba(245, 54, 54, 0.9)"
],
"dateFormat": "YYYY-MM-DD HH:mm:ss",
"decimals": 2,
"mappingType": 1,
"pattern": "Value #B",
"thresholds": [
"70",
"90"
],
"type": "number",
"unit": "percentunit"
},
{
"alias": "总空间",
"colorMode": null,
"colors": [
"rgba(245, 54, 54, 0.9)",
"rgba(237, 129, 40, 0.89)",
"rgba(50, 172, 45, 0.97)"
],
"dateFormat": "YYYY-MM-DD HH:mm:ss",
"decimals": 1,
"link": false,
"mappingType": 1,
"pattern": "Value #C",
"thresholds": [],
"type": "number",
"unit": "bytes"
},
{
"alias": "文件系统",
"colorMode": null,
"colors": [
"rgba(245, 54, 54, 0.9)",
"rgba(237, 129, 40, 0.89)",
"rgba(50, 172, 45, 0.97)"
],
"dateFormat": "YYYY-MM-DD HH:mm:ss",
"decimals": 2,
"link": false,
"mappingType": 1,
"pattern": "fstype",
"thresholds": [],
"type": "number",
"unit": "short"
},
{
"alias": "",
"colorMode": null,
"colors": [
"rgba(245, 54, 54, 0.9)",
"rgba(237, 129, 40, 0.89)",
"rgba(50, 172, 45, 0.97)"
],
"decimals": 2,
"pattern": "/.*/",
"preserveFormat": true,
"sanitize": false,
"thresholds": [],
"type": "hidden",
"unit": "short"
}
],
"targets": [
{
"expr": "node_filesystem_size_bytes{instance=~'nginxvlb',fstype=~\"ext4|xfs\"}",
"format": "table",
"hide": true,
"instant": true,
"intervalFactor": 1,
"legendFormat": "",
"refId": "C"
},
{
"expr": "node_filesystem_avail_bytes {instance=~'nginxvlb',fstype=~\"ext4|xfs\"}",
"format": "table",
"hide": false,
"instant": true,
"interval": "10s",
"intervalFactor": 1,
"legendFormat": "",
"refId": "A"
},
{
"expr": "1-(node_filesystem_free_bytes{instance=~'nginxvlb',fstype=~\"ext4|xfs\"} / node_filesystem_size_bytes{instance=~'nginxvlb',fstype=~\"ext4|xfs\"})",
"format": "table",
"hide": false,
"instant": true,
"intervalFactor": 1,
"legendFormat": "",
"refId": "B"
},
{
"expr": "",
"format": "table",
"interval": "10s",
"intervalFactor": 1,
"legendFormat": "",
"refId": "D"
}
],
"title": "各分区可用空间",
"transform": "table",
"type": "table"
},
{
"aliasColors": {
"Idle - Waiting for something to happen": "#052B51",
"guest": "#9AC48A",
"idle": "#052B51",
"iowait": "#EAB839",
"irq": "#BF1B00",
"nice": "#C15C17",
"sdb_每秒I/O操作%": "#d683ce",
"softirq": "#E24D42",
"steal": "#FCE2DE",
"system": "#508642",
"user": "#5195CE",
"磁盘花费在I/O操作占比": "#ba43a9"
},
"bars": false,
"dashLength": 10,
"dashes": false,
"datasource": "Prometheus",
"decimals": 2,
"description": "node_disk_io_time_seconds_total:\n磁盘花费在输入/输出操作上的毫秒数。该值为累加值。(Milliseconds Spent Doing I/Os)\n\nirate(node_disk_io_time_seconds_total[1m]):\n计算每秒的速率:(last值-last前一个值)/时间戳差值,即:1秒钟内磁盘花费在I/O操作的时间占比。",
"fill": 1,
"gridPos": {
"h": 7,
"w": 16,
"x": 0,
"y": 12
},
"id": 7,
"legend": {
"alignAsTable": true,
"avg": true,
"current": true,
"hideEmpty": true,
"hideZero": true,
"max": true,
"min": false,
"rightSide": true,
"show": true,
"sideWidth": null,
"sort": null,
"sortDesc": null,
"total": false,
"values": true
},
"lines": true,
"linewidth": 1,
"links": [],
"maxPerRow": 6,
"nullPointMode": "null",
"paceLength": 10,
"percentage": false,
"pointradius": 5,
"points": false,
"renderer": "flot",
"repeat": null,
"seriesOverrides": [],
"spaceLength": 10,
"stack": false,
"steppedLine": false,
"targets": [
{
"expr": "avg(irate(node_cpu_seconds_total{instance=~\"nginxvlb\",mode=\"system\"}[1m]))",
"format": "time_series",
"interval": "",
"intervalFactor": 2,
"legendFormat": "System",
"refId": "A",
"step": 20
},
{
"expr": "avg(irate(node_cpu_seconds_total{instance=~\"nginxvlb\",mode=\"user\"}[1m]))",
"format": "time_series",
"intervalFactor": 2,
"legendFormat": "User",
"refId": "B",
"step": 240
},
{
"expr": "avg(irate(node_cpu_seconds_total{instance=~\"nginxvlb\",mode=\"idle\"}[1m]))",
"format": "time_series",
"hide": true,
"intervalFactor": 2,
"legendFormat": "Idle",
"refId": "F",
"step": 240
},
{
"expr": "avg(irate(node_cpu_seconds_total{instance=~\"nginxvlb\",mode=\"iowait\"}[1m]))",
"format": "time_series",
"intervalFactor": 2,
"legendFormat": "Iowait",
"refId": "D",
"step": 240
},
{
"expr": "irate(node_disk_io_time_seconds_total{instance=~\"nginxvlb\"}[1m])",
"format": "time_series",
"intervalFactor": 1,
"legendFormat": "{{device}}_每秒I/O操作%",
"refId": "C"
}
],
"thresholds": [],
"timeFrom": null,
"timeRegions": [],
"timeShift": null,
"title": "CPU使用率、磁盘每秒的I/O操作耗费时间(%)",
"tooltip": {
"shared": true,
"sort": 0,
"value_type": "individual"
},
"type": "graph",
"xaxis": {
"buckets": null,
"mode": "time",
"name": null,
"show": true,
"values": []
},
"yaxes": [
{
"decimals": null,
"format": "percentunit",
"label": "",
"logBase": 1,
"max": null,
"min": null,
"show": true
},
{
"format": "short",
"label": null,
"logBase": 1,
"max": null,
"min": null,
"show": false
}
],
"yaxis": {
"align": false,
"alignLevel": null
}
},
{
"alert": { #这一段需要添加
"conditions": [
{
"evaluator": {
"params": [
1999999998
],
"type": "lt"
},
"operator": {
"type": "and"
},
"query": {
"params": [
"F",
"10s",
"now"
]
},
"reducer": {
"params": [],
"type": "avg"
},
"type": "query"
}
],
"executionErrorState": "alerting",
"for": "10s",
"frequency": "10s",
"handler": 1,
"message": "【Warning】[10.10.25.111]vlb服务器内存剩余不足2G,请注意查看!",
"name": "[10.10.25.111]vlbserver mem is less then 2g",
"noDataState": "alerting",
"notifications": []
},
"aliasColors": {
"内存_Avaliable": "#6ED0E0",
"内存_Cached": "#EF843C",
"内存_Free": "#629E51",
"内存_Total": "#6d1f62",
"内存_Used": "#eab839",
"可用": "#9ac48a",
"总内存": "#bf1b00"
},
"bars": false,
"dashLength": 10,
"dashes": false,
"datasource": "Prometheus",
"decimals": 2,
"fill": 6,
"gridPos": {
"h": 7,
"w": 8,
"x": 16,
"y": 12
},
"height": "300",
"id": 156,
"legend": {
"alignAsTable": false,
"avg": false,
"current": true,
"max": false,
"min": false,
"rightSide": false,
"show": true,
"total": false,
"values": true
},
"lines": true,
"linewidth": 3,
"links": [],
"nullPointMode": "null",
"paceLength": 10,
"percentage": false,
"pointradius": 5,
"points": false,
"renderer": "flot",
"seriesOverrides": [],
"spaceLength": 10,
"stack": false,
"steppedLine": false,
"targets": [
{
"expr": "node_memory_MemTotal_bytes{instance=~\"nginxvlb\"}",
"format": "time_series",
"hide": false,
"instant": false,
"intervalFactor": 2,
"legendFormat": "总内存",
"refId": "A",
"step": 4
},
{
"expr": "node_memory_MemTotal_bytes{instance=~\"nginxvlb\"} - node_memory_MemAvailable_bytes{instance=~\"nginxvlb\"}",
"format": "time_series",
"hide": false,
"intervalFactor": 2,
"legendFormat": "已用",
"refId": "B",
"step": 4
},
{
"expr": "node_memory_MemFree_bytes{instance=~\"nginxvlb\"}",
"format": "time_series",
"hide": true,
"intervalFactor": 2,
"legendFormat": "内存_Free",
"refId": "C",
"step": 4
},
{
"expr": "node_memory_Buffers_bytes{instance=~\"nginxvlb\"}",
"format": "time_series",
"hide": true,
"intervalFactor": 2,
"legendFormat": "内存_Buffers",
"refId": "D",
"step": 4
},
{
"expr": "node_memory_Cached_bytes{instance=~\"nginxvlb\"}",
"format": "time_series",
"hide": true,
"intervalFactor": 2,
"legendFormat": "内存_Cached",
"refId": "E",
"step": 4
},
{
"expr": "node_memory_MemAvailable_bytes{instance=~\"nginxvlb\"}",
"format": "time_series",
"hide": false,
"interval": "",
"intervalFactor": 2,
"legendFormat": "可用",
"refId": "F",
"step": 4
},
{
"expr": "node_memory_MemTotal_bytes{instance=~\"nginxvlb\"} - (node_memory_Cached_bytes{instance=~\"nginxvlb\"} + node_memory_Buffers_bytes{instance=~\"nginxvlb\"} + node_memory_MemFree_bytes{instance=~\"nginxvlb\"})",
"format": "time_series",
"hide": true,
"intervalFactor": 1,
"refId": "G"
}
],
"thresholds": [
{###这一小段需要添加
"colorMode": "critical",
"fill": true,
"line": true,
"op": "lt",
"value": 1999999998
}
],
"timeFrom": null,
"timeRegions": [],
"timeShift": null,
"title": "内存信息",
"tooltip": {
"shared": true,
"sort": 0,
"value_type": "individual"
},
"type": "graph",
"xaxis": {
"buckets": null,
"mode": "time",
"name": null,
"show": true,
"values": []
},
"yaxes": [
{
"format": "bytes",
"label": null,
"logBase": 1,
"max": null,
"min": "0",
"show": true
},
{
"format": "short",
"label": null,
"logBase": 1,
"max": null,
"min": null,
"show": true
}
],
"yaxis": {
"align": false,
"alignLevel": null
}
},
{
"aliasColors": {
"vda_write": "#6ED0E0"
},
"bars": true,
"dashLength": 10,
"dashes": false,
"datasource": "Prometheus",
"description": "Reads completed: 每个磁盘分区每秒读完成次数\n\nWrites completed: 每个磁盘分区每秒写完成次数\n\nIO now 每个磁盘分区每秒正在处理的输入/输出请求数",
"fill": 2,
"gridPos": {
"h": 8,
"w": 8,
"x": 0,
"y": 19
},
"height": "300",
"id": 161,
"legend": {
"alignAsTable": false,
"avg": false,
"current": true,
"hideEmpty": true,
"hideZero": true,
"max": true,
"min": false,
"show": true,
"total": false,
"values": true
},
"lines": false,
"linewidth": 1,
"links": [],
"nullPointMode": "null",
"paceLength": 10,
"percentage": false,
"pointradius": 5,
"points": false,
"renderer": "flot",
"seriesOverrides": [
{
"alias": "/.*_读取$/",
"transform": "negative-Y"
}
],
"spaceLength": 10,
"stack": false,
"steppedLine": false,
"targets": [
{
"expr": "irate(node_disk_reads_completed_total{instance=~\"nginxvlb\"}[1m])",
"format": "time_series",
"hide": false,
"interval": "",
"intervalFactor": 2,
"legendFormat": "{{device}}_读取",
"refId": "A",
"step": 10
},
{
"expr": "irate(node_disk_writes_completed_total{instance=~\"nginxvlb\"}[1m])",
"format": "time_series",
"hide": false,
"intervalFactor": 2,
"legendFormat": "{{device}}_写入",
"refId": "B",
"step": 10
},
{
"expr": "node_disk_io_now{instance=~\"nginxvlb\"}",
"format": "time_series",
"hide": true,
"interval": "",
"intervalFactor": 1,
"legendFormat": "{{device}}",
"refId": "C"
}
],
"thresholds": [],
"timeFrom": null,
"timeRegions": [],
"timeShift": null,
"title": "磁盘读写速率(IOPS)",
"tooltip": {
"shared": true,
"sort": 0,
"value_type": "individual"
},
"type": "graph",
"xaxis": {
"buckets": null,
"mode": "time",
"name": null,
"show": true,
"values": []
},
"yaxes": [
{
"decimals": null,
"format": "iops",
"label": "读取(-)/写入(+)I/O ops/sec",
"logBase": 1,
"max": null,
"min": null,
"show": true
},
{
"format": "short",
"label": null,
"logBase": 1,
"max": null,
"min": null,
"show": true
}
],
"yaxis": {
"align": false,
"alignLevel": null
}
},
{
"aliasColors": {
"vda_write": "#6ED0E0"
},
"bars": true,
"dashLength": 10,
"dashes": false,
"datasource": "Prometheus",
"description": "Read bytes 每个磁盘分区每秒读取的比特数\nWritten bytes 每个磁盘分区每秒写入的比特数",
"fill": 2,
"gridPos": {
"h": 8,
"w": 8,
"x": 8,
"y": 19
},
"height": "300",
"id": 168,
"legend": {
"alignAsTable": false,
"avg": false,
"current": true,
"hideEmpty": true,
"hideZero": true,
"max": true,
"min": false,
"show": true,
"total": false,
"values": true
},
"lines": false,
"linewidth": 1,
"links": [],
"nullPointMode": "null",
"paceLength": 10,
"percentage": false,
"pointradius": 5,
"points": false,
"renderer": "flot",
"seriesOverrides": [
{
"alias": "/.*_读取$/",
"transform": "negative-Y"
}
],
"spaceLength": 10,
"stack": false,
"steppedLine": false,
"targets": [
{
"expr": "irate(node_disk_read_bytes_total{instance=~\"nginxvlb\"}[1m])",
"format": "time_series",
"interval": "",
"intervalFactor": 2,
"legendFormat": "{{device}}_读取",
"refId": "A",
"step": 10
},
{
"expr": "irate(node_disk_written_bytes_total{instance=~\"nginxvlb\"}[1m])",
"format": "time_series",
"hide": false,
"intervalFactor": 2,
"legendFormat": "{{device}}_写入",
"refId": "B",
"step": 10
}
],
"thresholds": [],
"timeFrom": null,
"timeRegions": [],
"timeShift": null,
"title": "磁盘读写容量大小",
"tooltip": {
"shared": true,
"sort": 0,
"value_type": "individual"
},
"type": "graph",
"xaxis": {
"buckets": null,
"mode": "time",
"name": null,
"show": true,
"values": []
},
"yaxes": [
{
"decimals": null,
"format": "Bps",
"label": "读取(-)/写入(+)",
"logBase": 1,
"max": null,
"min": null,
"show": true
},
{
"format": "short",
"label": null,
"logBase": 1,
"max": null,
"min": null,
"show": false
}
],
"yaxis": {
"align": false,
"alignLevel": null
}
},
{
"aliasColors": {
"vda": "#6ED0E0"
},
"bars": false,
"dashLength": 10,
"dashes": false,
"datasource": "Prometheus",
"description": "Read time ms 每个磁盘分区读操作花费的秒数\n\nWrite time ms 每个磁盘分区写操作花费的秒数\n\nIO time ms 每个磁盘分区输入/输出操作花费的秒数\n\nIO time weighted 每个磁盘分区输入/输出操作花费的加权秒数",
"fill": 3,
"gridPos": {
"h": 8,
"w": 8,
"x": 16,
"y": 19
},
"height": "300",
"id": 160,
"legend": {
"alignAsTable": false,
"avg": false,
"current": true,
"hideEmpty": true,
"hideZero": true,
"max": true,
"min": false,
"show": true,
"total": false,
"values": true
},
"lines": true,
"linewidth": 1,
"links": [],
"nullPointMode": "null",
"paceLength": 10,
"percentage": false,
"pointradius": 5,
"points": false,
"renderer": "flot",
"seriesOverrides": [
{
"alias": "/,*_读取$/",
"transform": "negative-Y"
}
],
"spaceLength": 10,
"stack": false,
"steppedLine": false,
"targets": [
{
"expr": "irate(node_disk_io_time_seconds_total{instance=~\"nginxvlb\"}[1m])",
"format": "time_series",
"hide": true,
"interval": "",
"intervalFactor": 2,
"legendFormat": "{{device}}",
"refId": "A",
"step": 10
},
{
"expr": "irate(node_disk_io_time_weighted_seconds_total{instance=~\"nginxvlb\"}[1m])",
"format": "time_series",
"hide": true,
"intervalFactor": 1,
"legendFormat": "{{device}}_加权",
"refId": "D"
},
{
"expr": "irate(node_disk_read_time_seconds_total{instance=~\"nginxvlb\"}[1m])",
"format": "time_series",
"hide": false,
"interval": "",
"intervalFactor": 1,
"legendFormat": "{{device}}_读取",
"refId": "B"
},
{
"expr": "irate(node_disk_write_time_seconds_total{instance=~\"nginxvlb\"}[1m])",
"format": "time_series",
"hide": false,
"intervalFactor": 1,
"legendFormat": "{{device}}_写入",
"refId": "C"
}
],
"thresholds": [],
"timeFrom": null,
"timeRegions": [],
"timeShift": null,
"title": "磁盘IO读写时间",
"tooltip": {
"shared": true,
"sort": 0,
"value_type": "individual"
},
"type": "graph",
"xaxis": {
"buckets": null,
"mode": "time",
"name": null,
"show": true,
"values": []
},
"yaxes": [
{
"format": "s",
"label": "读取(-)/写入(+)",
"logBase": 1,
"max": null,
"min": null,
"show": true
},
{
"format": "short",
"label": null,
"logBase": 1,
"max": null,
"min": null,
"show": false
}
],
"yaxis": {
"align": false,
"alignLevel": null
}
},
{
"aliasColors": {},
"bars": false,
"dashLength": 10,
"dashes": false,
"datasource": "Prometheus",
"fill": 1,
"gridPos": {
"h": 8,
"w": 12,
"x": 0,
"y": 27
},
"height": "300",
"id": 157,
"legend": {
"alignAsTable": false,
"avg": false,
"current": true,
"hideEmpty": true,
"hideZero": true,
"max": false,
"min": false,
"show": true,
"total": false,
"values": true
},
"lines": true,
"linewidth": 2,
"links": [],
"nullPointMode": "null",
"paceLength": 10,
"percentage": false,
"pointradius": 5,
"points": false,
"renderer": "flot",
"seriesOverrides": [
{
"alias": "/.*_out上传$/",
"transform": "negative-Y"
}
],
"spaceLength": 10,
"stack": false,
"steppedLine": false,
"targets": [
{
"expr": "irate(node_network_receive_bytes_total{instance=~'nginxvlb',device!~'tap.*'}[5m])*8",
"format": "time_series",
"intervalFactor": 2,
"legendFormat": "{{device}}_in下载",
"refId": "A",
"step": 4
},
{
"expr": "irate(node_network_transmit_bytes_total{instance=~'nginxvlb',device!~'tap.*'}[5m])*8",
"format": "time_series",
"intervalFactor": 2,
"legendFormat": "{{device}}_out上传",
"refId": "B",
"step": 4
}
],
"thresholds": [],
"timeFrom": null,
"timeRegions": [],
"timeShift": null,
"title": "网络流量",
"tooltip": {
"shared": true,
"sort": 0,
"value_type": "individual"
},
"type": "graph",
"xaxis": {
"buckets": null,
"mode": "time",
"name": null,
"show": true,
"values": []
},
"yaxes": [
{
"format": "bps",
"label": "上传(-)/下载(+)",
"logBase": 1,
"max": null,
"min": null,
"show": true
},
{
"format": "short",
"label": null,
"logBase": 1,
"max": null,
"min": null,
"show": false
}
],
"yaxis": {
"align": false,
"alignLevel": null
}
},
{
"aliasColors": {
"TCP": "#6ED0E0"
},
"bars": false,
"dashLength": 10,
"dashes": false,
"datasource": "Prometheus",
"description": "CurrEstab - 当前状态为 ESTABLISHED 或 CLOSE-WAIT 的 TCP 连接数\n\nActiveOpens - 已从 CLOSED 状态直接转换到 SYN-SENT 状态的 TCP 平均连接数(1分钟内)\n\nPassiveOpens - 已从 LISTEN 状态直接转换到 SYN-RCVD 状态的 TCP 平均连接数(1分钟内)\n\nTCP_alloc - 已分配(已建立、已申请到sk_buff)的TCP套接字数量\n\nTCP_inuse - 正在使用(正在侦听)的TCP套接字数量\n\nTCP_tw - 等待关闭的TCP连接数",
"fill": 0,
"gridPos": {
"h": 8,
"w": 12,
"x": 12,
"y": 27
},
"height": "300",
"id": 158,
"legend": {
"alignAsTable": true,
"avg": false,
"current": true,
"max": true,
"min": false,
"rightSide": true,
"show": true,
"total": false,
"values": true
},
"lines": true,
"linewidth": 1,
"links": [],
"nullPointMode": "null",
"paceLength": 10,
"percentage": false,
"pointradius": 5,
"points": false,
"renderer": "flot",
"seriesOverrides": [],
"spaceLength": 10,
"stack": false,
"steppedLine": false,
"targets": [
{
"expr": "node_netstat_Tcp_CurrEstab{instance=~'nginxvlb'}",
"format": "time_series",
"hide": false,
"interval": "10s",
"intervalFactor": 1,
"legendFormat": "ESTABLISHED",
"refId": "A",
"step": 20
},
{
"expr": "node_sockstat_TCP_tw{instance=~'nginxvlb'}",
"format": "time_series",
"intervalFactor": 1,
"legendFormat": "TCP_tw",
"refId": "D"
},
{
"expr": "irate(node_netstat_Tcp_ActiveOpens{instance=~'nginxvlb'}[1m])",
"format": "time_series",
"hide": false,
"intervalFactor": 1,
"legendFormat": "ActiveOpens",
"refId": "B"
},
{
"expr": "irate(node_netstat_Tcp_PassiveOpens{instance=~'nginxvlb'}[1m])",
"format": "time_series",
"intervalFactor": 1,
"legendFormat": "PassiveOpens",
"refId": "C"
},
{
"expr": "node_sockstat_TCP_alloc{instance=~'nginxvlb'}",
"format": "time_series",
"intervalFactor": 1,
"legendFormat": "TCP_alloc",
"refId": "E"
},
{
"expr": "node_sockstat_TCP_inuse{instance=~'nginxvlb'}",
"format": "time_series",
"intervalFactor": 1,
"legendFormat": "TCP_inuse",
"refId": "F"
}
],
"thresholds": [],
"timeFrom": null,
"timeRegions": [],
"timeShift": null,
"title": "TCP 连接情况",
"tooltip": {
"shared": true,
"sort": 0,
"value_type": "individual"
},
"type": "graph",
"xaxis": {
"buckets": null,
"mode": "time",
"name": null,
"show": true,
"values": []
},
"yaxes": [
{
"format": "short",
"label": null,
"logBase": 1,
"max": null,
"min": null,
"show": true
},
{
"format": "short",
"label": null,
"logBase": 1,
"max": null,
"min": null,
"show": true
}
],
"yaxis": {
"align": false,
"alignLevel": null
}
},
{
"aliasColors": {},
"bars": false,
"dashLength": 10,
"dashes": false,
"datasource": "Prometheus",
"fill": 0,
"gridPos": {
"h": 10,
"w": 24,
"x": 0,
"y": 35
},
"id": 169,
"legend": {
"alignAsTable": true,
"avg": true,
"current": true,
"hideEmpty": true,
"hideZero": true,
"max": true,
"min": false,
"rightSide": true,
"show": true,
"total": false,
"values": true
},
"lines": true,
"linewidth": 1,
"links": [],
"nullPointMode": "null as zero",
"paceLength": 10,
"percentage": false,
"pointradius": 0.5,
"points": false,
"renderer": "flot",
"seriesOverrides": [],
"spaceLength": 10,
"stack": false,
"steppedLine": false,
"targets": [
{
"expr": "node_hwmon_temp_celsius{instance=\"nginxvlb\"}",
"format": "time_series",
"intervalFactor": 1,
"legendFormat": "{{chip}} {{sensor}}",
"refId": "A"
}
],
"thresholds": [],
"timeFrom": null,
"timeRegions": [],
"timeShift": null,
"title": "硬件温度",
"tooltip": {
"shared": true,
"sort": 0,
"value_type": "individual"
},
"type": "graph",
"xaxis": {
"buckets": null,
"mode": "time",
"name": null,
"show": true,
"values": []
},
"yaxes": [
{
"format": "celsius",
"label": null,
"logBase": 1,
"max": null,
"min": null,
"show": true
},
{
"format": "short",
"label": null,
"logBase": 1,
"max": null,
"min": null,
"show": true
}
],
"yaxis": {
"align": false,
"alignLevel": null
}
}
],
"refresh": false,
"schemaVersion": 18,
"style": "dark",
"tags": [
"StarsL",
"Prometheus"
],
"templating": {
"list": [
{
"auto": true,
"auto_count": 30,
"auto_min": "10s",
"current": {
"text": "auto",
"value": "$__auto_interval_interval"
},
"hide": 0,
"label": "interval",
"name": "interval",
"options": [
{
"selected": true,
"text": "auto",
"value": "$__auto_interval_interval"
},
{
"selected": false,
"text": "1m",
"value": "1m"
},
{
"selected": false,
"text": "10m",
"value": "10m"
},
{
"selected": false,
"text": "30m",
"value": "30m"
},
{
"selected": false,
"text": "1h",
"value": "1h"
},
{
"selected": false,
"text": "6h",
"value": "6h"
},
{
"selected": false,
"text": "12h",
"value": "12h"
},
{
"selected": false,
"text": "1d",
"value": "1d"
},
{
"selected": false,
"text": "7d",
"value": "7d"
},
{
"selected": false,
"text": "14d",
"value": "14d"
},
{
"selected": false,
"text": "30d",
"value": "30d"
}
],
"query": "1m,10m,30m,1h,6h,12h,1d,7d,14d,30d",
"refresh": 2,
"skipUrlSync": false,
"type": "interval"
},
{
"allFormat": "glob",
"allValue": null,
"current": {
"isNone": true,
"text": "None",
"value": ""
},
"datasource": "Prometheus",
"definition": "",
"hide": 0,
"includeAll": false,
"label": "环境",
"multi": false,
"multiFormat": "regex values",
"name": "env",
"options": [],
"query": "label_values(node_exporter_build_info,env)",
"refresh": 1,
"regex": "",
"skipUrlSync": false,
"sort": 1,
"tagValuesQuery": "",
"tags": [],
"tagsQuery": "",
"type": "query",
"useTags": false
},
{
"allFormat": "glob",
"allValue": null,
"current": {
"isNone": true,
"text": "None",
"value": ""
},
"datasource": "Prometheus",
"definition": "",
"hide": 0,
"includeAll": false,
"label": "主机名",
"multi": false,
"multiFormat": "regex values",
"name": "name",
"options": [],
"query": "label_values(node_exporter_build_info{env='$env'},name)",
"refresh": 1,
"regex": "",
"skipUrlSync": false,
"sort": 1,
"tagValuesQuery": "",
"tags": [],
"tagsQuery": "",
"type": "query",
"useTags": false
},
{
"allFormat": "glob",
"allValue": null,
"current": {
"tags": [],
"text": "nginxvlb",
"value": "nginxvlb"
},
"datasource": "Prometheus",
"definition": "",
"hide": 0,
"includeAll": false,
"label": "节点",
"multi": false,
"multiFormat": "regex values",
"name": "node",
"options": [],
"query": "label_values(node_exporter_build_info{name='$name'},instance)",
"refresh": 1,
"regex": "",
"skipUrlSync": false,
"sort": 1,
"tagValuesQuery": "",
"tags": [],
"tagsQuery": "",
"type": "query",
"useTags": false
},
{
"allValue": null,
"current": {
"text": "/",
"value": "/"
},
"datasource": "Prometheus",
"definition": "",
"hide": 2,
"includeAll": false,
"label": "",
"multi": false,
"name": "maxmount",
"options": [],
"query": "query_result(topk(1,sort_desc (max(node_filesystem_size_bytes{instance=~'nginxvlb',fstype=~\"ext4|xfs\"}) by (mountpoint))))",
"refresh": 1,
"regex": "/.*\\\"(.*)\\\".*/",
"skipUrlSync": false,
"sort": 0,
"tagValuesQuery": "",
"tags": [],
"tagsQuery": "",
"type": "query",
"useTags": false
}
]
},
"time": {
"from": "now-5m",
"to": "now"
},
"timepicker": {
"now": true,
"refresh_intervals": [
"5s",
"10s",
"30s",
"1m",
"5m",
"15m",
"30m",
"1h",
"2h",
"1d"
],
"time_options": [
"5m",
"15m",
"1h",
"6h",
"12h",
"24h",
"2d",
"7d",
"30d"
]
},
"timezone": "browser",
"title": "nginxvlb",
"uid": "SW8eIbgZz",
"version": 4
}需要重启prometheus + grafana-server 服务
查看 Telegram群组告警

如果需要其他报警请自己编辑json文件.