R语言与函数估计学习笔记(函数模型的参数估计)
R语言与函数估计学习笔记
毫无疑问,函数估计是一个比参数估计要复杂得多的问题,当然也是一个有趣的多的问题。这个问题在模型未知的实验设计的建模中十分的常见,也是我正在学习的内容的一部分。
关于函数估计我想至少有这么几个问题是我们关心的:1、我知道函数的一个大概的模型,需要估计函数的参数;2、我不知道它是一个什么模型,但是我想用一个不坏的模型刻画它;3、我不知道它是一个什么模型,我也不太关心它的显式表达是什么,我只想知道它在没观测到的点的取值。这三个问题第一个是拟合或者叫参数估计,第二个叫函数逼近,第三个叫函数插值。从统计的角度来看,第一个是参数问题,剩下的是非参数的问题。
函数模型的参数估计
这类的问题有很多,一个比较典型的例子是柯布-道格拉斯函数\( Y=L^\alpha k^\beta \mu \)。我们要估计参数常用的就是最小化残差平方和,如果是密度函数或者分布函数常用的办法在加上矩估计与似然估计(MLE)两种办法。
我们在这里介绍一下R中的用于函数拟合的函数nls(),其调用格式如下:
nls(formula, data, start, control, algorithm, trace, subset, weights, na.action, model, lower, upper, …)
其用法与线性回归函数lm()用法类似,这里就不作过多介绍了,我们来看几个例子来说明函数的用法:
情形一:指数模型
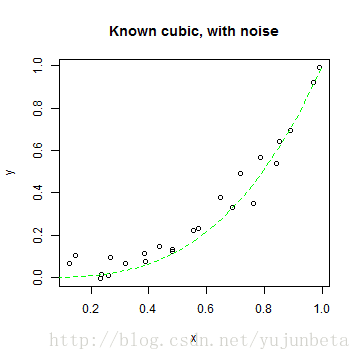
模拟模型\( y=x^\beta+\varepsilon \),这里假设\( \beta=3 \)
len <- 24
x <- runif(len, 0.1, 1)
y <- x^3 + rnorm(len, 0, 0.06)
ds <- data.frame(x = x, y = y)
str(ds)
## 'data.frame':    24 obs. of  2 variables:
##  $ x: num  0.238 0.482 0.787 0.145 0.232 ...
##  $ y: num  0.0154 0.12048 0.56788 0.10287 -0.00321 ...
plot(y ~ x, main = "Known cubic, with noise")
s <- seq(0, 1, length = 100)
lines(s, s^3, lty = 2, col = "green")
使用函数nls估计参数\( \beta \)
m <- nls(y ~ I(x^power), data = ds, start = list(power = 1), trace = T)
## 1.637 :  1
## 0.2674 :  1.847
## 0.07229 :  2.464
## 0.06273 :  2.656
## 0.06264 :  2.677
## 0.06264 :  2.678
## 0.06264 :  2.678
summary(m)
##
## Formula: y ~ I(x^power)
##
## Parameters:
##       Estimate Std. Error t value Pr(>|t|)
## power    2.678      0.117    22.9   <2e-16 ***
## ---
## Signif. codes:  0 '***' 0.001 '**' 0.01 '*' 0.05 '.' 0.1 ' ' 1
##
## Residual standard error: 0.0522 on 23 degrees of freedom
##
## Number of iterations to convergence: 6
## Achieved convergence tolerance: 6.07e-06
当然,也可以两边取对数,通过最小二乘来处理这个问题。其R代码如下:
model <- lm(I(log(y)) ~ I(log(x)))
summary(model)
##
## Call:
## lm(formula = I(log(y)) ~ I(log(x)))
##
## Residuals:
##     Min      1Q  Median      3Q     Max
## -1.8016 -0.2407 -0.0368  0.2876  1.4164
##
## Coefficients:
##             Estimate Std. Error t value Pr(>|t|)
## (Intercept)   -0.446      0.233   -1.91     0.07 .
## I(log(x))      1.680      0.251    6.69  1.3e-06 ***
## ---
## Signif. codes:  0 '***' 0.001 '**' 0.01 '*' 0.05 '.' 0.1 ' ' 1
##
## Residual standard error: 0.695 on 21 degrees of freedom
##   (1 observation deleted due to missingness)
## Multiple R-squared:  0.681,  Adjusted R-squared:  0.666
## F-statistic: 44.8 on 1 and 21 DF,  p-value: 1.27e-06
如果这个模型还有常数项,两边取对数就不好使了,不过,我们的nls函数还是能解决的。
情形二:含常数项的指数模型
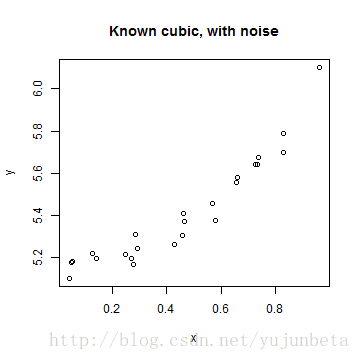
模拟模型\( y=x^\beta+\mu +\varepsilon \),这里假设\( \beta=3,\mu=5.2 \)
len <- 24
x <- runif(len)
y <- x^3 + 5.2 + rnorm(len, 0, 0.06)
ds <- data.frame(x = x, y = y)
str(ds)
## 'data.frame':    24 obs. of  2 variables:
##  $ x: num  0.277 0.831 0.127 0.464 0.734 ...
##  $ y: num  5.17 5.79 5.22 5.37 5.64 ...
plot(y ~ x, main = "Known cubic, with noise")
s <- seq(0, 1, length = 100)
lines(s, s^3, lty = 2, col = "green")
使用nls函数估计如下:
rhs <- function(x, b0, b1) {
    b0 + x^b1
}
m.2 <- nls(y ~ rhs(x, intercept, power), data = ds, start = list(intercept = 0,
    power = 2), trace = T)
## 632.5 :  0 2
## 0.05006 :  5.171 2.331
## 0.04934 :  5.173 2.395
## 0.04934 :  5.174 2.404
## 0.04934 :  5.174 2.404
## 0.04934 :  5.174 2.405
## 0.04934 :  5.174 2.405
summary(m.2)
##
## Formula: y ~ rhs(x, intercept, power)
##
## Parameters:
##           Estimate Std. Error t value Pr(>|t|)
## intercept   5.1740     0.0184   281.5  < 2e-16 ***
## power       2.4046     0.1775    13.6  3.7e-12 ***
## ---
## Signif. codes:  0 '***' 0.001 '**' 0.01 '*' 0.05 '.' 0.1 ' ' 1
##
## Residual standard error: 0.0474 on 22 degrees of freedom
##
## Number of iterations to convergence: 6
## Achieved convergence tolerance: 1.67e-06
如果这时我们还是采用最小二乘估计的办法处理,那么得到的结果是:
model <- lm(I(log(y)) ~ I(log(x)))
summary(model)
##
## Call:
## lm(formula = I(log(y)) ~ I(log(x)))
##
## Residuals:
##      Min       1Q   Median       3Q      Max
## -0.03703 -0.02483 -0.00204  0.01840  0.08087
##
## Coefficients:
##             Estimate Std. Error t value Pr(>|t|)
## (Intercept)  1.72898    0.00915  188.89  < 2e-16 ***
## I(log(x))    0.03816    0.00648    5.89  6.3e-06 ***
## ---
## Signif. codes:  0 '***' 0.001 '**' 0.01 '*' 0.05 '.' 0.1 ' ' 1
##
## Residual standard error: 0.0287 on 22 degrees of freedom
## Multiple R-squared:  0.612,  Adjusted R-squared:  0.594
## F-statistic: 34.7 on 1 and 22 DF,  p-value: 6.32e-06
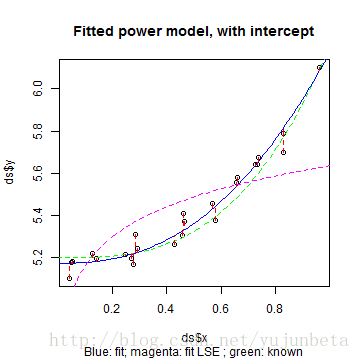
我们可以将估计数据、真实模型、nls估计模型、最小二乘模型得到的结果展示在下图中,来拟合好坏有个直观的判断:
plot(ds$y ~ ds$x, main = "Fitted power model, with intercept", sub = "Blue: fit; magenta: fit LSE ; green: known")

lines(s, s^3 + 5.2, lty = 2, col = "green")
lines(s, predict(m.2, list(x = s)), lty = 1, col = "blue")
lines(s, exp(predict(model, list(x = s))), lty = 2, col = "magenta")
segments(x, y, x, fitted(m.2), lty = 2, col = "red")
从图就可以看出,化为最小二乘的办法不总是可行的。
情形三:分段函数模型
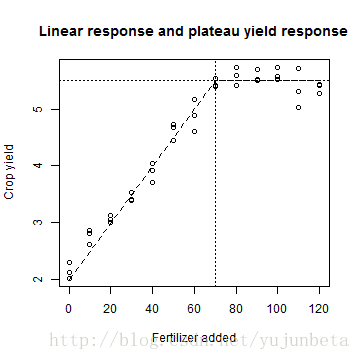
我们来看下面的模型:
f.lrp <- function(x, a, b, t.x) {
    ifelse(x > t.x, a + b * t.x, a + b * x)
}
f.lvls <- seq(0, 120, by = 10)
a.0 <- 2
b.0 <- 0.05
t.x.0 <- 70
test <- data.frame(x = f.lvls, y = f.lrp(f.lvls, a.0, b.0, t.x.0))
test <- rbind(test, test, test)
test$y <- test$y + rnorm(length(test$y), 0, 0.2)
plot(test$y ~ test$x, main = "Linear response and plateau yield response", xlab = "Fertilizer added",
    ylab = "Crop yield")
(max.yield <- a.0 + b.0 * t.x.0)
## [1] 5.5
lines(x = c(0, t.x.0, 120), y = c(a.0, max.yield, max.yield), lty = 2)
abline(v = t.x.0, lty = 3)
abline(h = max.yield, lty = 3)
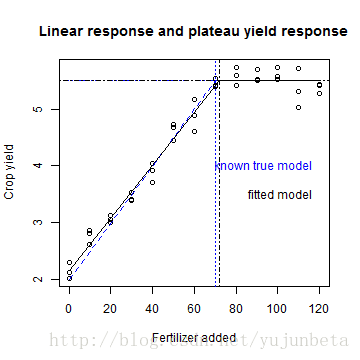
显然用一个线性模型解决不了,二次模型解决不好,分段函数倒是一个很好的选择,那么在哪里划分比较合理呢?我们还是用nls函数来解决这个问题:
m.lrp <- nls(y ~ f.lrp(x, a, b, t.x), data = test, start = list(a = 0, b = 0.1,
    t.x = 50), trace = T, control = list(warnOnly = T, minFactor = 1/2048))
## 32.74 :   0.0  0.1 50.0
## 7.352 :   2.16251  0.04619 59.34899
## 1.25 :   2.16251  0.04619 70.24081
## 1.116 :   2.15689  0.04639 72.09071
## 1.116 :   2.15689  0.04639 72.08250
summary(m.lrp)
##
## Formula: y ~ f.lrp(x, a, b, t.x)
##
## Parameters:
##     Estimate Std. Error t value Pr(>|t|)
## a    2.15689    0.06562    32.9   <2e-16 ***
## b    0.04639    0.00157    29.6   <2e-16 ***
## t.x 72.08250    1.76996    40.7   <2e-16 ***
## ---
## Signif. codes:  0 '***' 0.001 '**' 0.01 '*' 0.05 '.' 0.1 ' ' 1
##
## Residual standard error: 0.176 on 36 degrees of freedom
##
## Number of iterations to convergence: 4
## Achieved convergence tolerance: 3.63e-09
画图来看看拟合的可靠性:
plot(test$y ~ test$x, main = "Linear response and plateau yield response", xlab = "Fertilizer added",
    ylab = "Crop yield")
(max.yield <- a.0 + b.0 * t.x.0)
## [1] 5.5
lines(x = c(0, t.x.0, 120), y = c(a.0, max.yield, max.yield), lty = 2, col = "blue")
abline(v = t.x.0, lty = 3, col = "blue")
abline(h = max.yield, lty = 3, col = "blue")
(max.yield <- coefficients(m.lrp)["a"] + coefficients(m.lrp)["b"] * coefficients(m.lrp)["t.x"])
##     a
## 5.501
lines(x = c(0, coefficients(m.lrp)["t.x"], 120), y = c(coefficients(m.lrp)["a"],
    max.yield, max.yield), lty = 1)
abline(v = coefficients(m.lrp)["t.x"], lty = 4)
abline(h = max.yield, lty = 4)
text(120, 4, "known true model", col = "blue", pos = 2)
text(120, 3.5, "fitted model", col = "black", pos = 2)
可以看到拟合的结果还是不错的。这也显示了nls函数的优秀之处,几乎可以拟合所有的连续函数,哪怕他们存在不可微的点。它的算法是怎么样的我没有深究,不过光是分段线性模型,CART算法可是一个不错的选择,模型树(model tree)就是拟合这种模型的极好的选择。
最近在整理机器学习的笔记,model tree的R代码确实是写好了,不过由于人懒,敲字慢,最终也没形成文字发出来与大家分享。
我们对参数估计大概就介绍这么多,关于矩估计,极大似然估计可以参见之前的博文《R语言与点估计学习笔记(矩估计与MLE)》.当然,如果一个函数分离掉已知部分是一个密度函数的话,矩估计与极大似然仍然是可用的,如你想估计函数\( f(x)=e^{-(x-\mu)^2} \)中的参数\( \mu \)。
本作品采用 知识共享署名-非商业性使用-相同方式共享 4.0 国际许可协议进行许可。
