Python实战 |「野蛮时代」游戏数据分析过程
![]()
据来源:DC游戏玩家付费金额预测大赛
网页地址:http://t.cn/A67rUJxO
数据包含近229万条记录和109个字段,以下取较重要的字段进行说明。
字段说明
user_id:用户编码,用户唯一标识
bd_stronghold_level:要塞等级,相当于游戏账号等级
wood_reduce_value:木头消耗数量
stone_reduce_value:石头消耗数量
ivory_reduce_value:象牙消耗数量
meat_reduce_value:肉消耗数量
magic_reduce_value:魔法消耗数量
general_acceleration_reduce_value:通用加速消耗数量
building_acceleration_reduce_value:建筑加速消耗数量
reaserch_acceleration_reduce_value:科研加速消耗数量
training_acceleration_reduce_value:训练加速消耗数量
treatment_acceleration_reduce_value:治疗加速消耗数量
pvp_battle_count:玩家对玩家次数
pve_battle_count:玩家对机器次数
avg_online_minutes:日均在线时间
pay_price : 消费金额
pay_count:消费次数
分析思路
用户注册时间分布情况?
用户的付费情况(付费率,ARPU,ARPPU)?
各等级用户的付费情况?
用户的消费习惯?
可视化数据
分析过程
1. 导入数据
import numpy as np
import pandas as pd
from pandas import read_csv
from sklearn.cluster import KMeans
import matplotlib.pyplotas plt
import pylab as pl
from matplotlib.font_managerimport FontManager, FontProperties
pd.set_option('display.max_columns',None)
#为了数据安全,copy一份数据
df=df0
#检查是否有空值
print(df.isnull().any().any())
#观察数据构成
print(df.head())
2. 清洗数据
#以user_id为维度,删除重复数据,并查看用户总数
df=df.drop_duplicates(subset='user_id')
print('用户总数:',len(df['user_id']))
→用户总数:2288007
3. 计算用户注册时间分布
#首先将注册时间精确到天
register_date=[]
for i in df['register_time']:
    date=i[5:10]
    register_date.append(date)
df['register_time']=register_date
#计算每天的注册人数
df_register=df.groupby('register_time').size()
df_register.columns=['日期','注册人数']
print(df_register)
(可视化)
plt.plot(df_register)
plt.grid(True)
pl.xticks(rotation=90)
font=FontProperties(fname='/System/Library/Fonts/PingFang.ttc')
plt.title('用户注册分布图',fontproperties=font)
plt.show()
由上图可以看出,用户注册数在2月19日有一次的大的高峰,其他时间也分别有几次小高峰,且高峰的持续时间很短,可以推测是因为游戏推出一些奖励活动或公司对游戏的推广取得了效果进而使注册用户激增。
4. 用户的付费情况(付费率,ARPU,ARPPU)
#付费率(付费人数/活跃人数)
df_pay_user=df[(df['pay_price']>0)]
pay_rate=df_pay_user['user_id'].count()/df_active_user['user_id'].count()
print('付费率:%.2f'%(pay_rate))
#ARPU(总付费金额/活跃人数)
arpu=df_pay_user['pay_price'].sum()/df_active_user['user_id'].count()
print('ARPU:%.2f'%(arpu))
#ARPPU(总付费金额/付费人数)
arppu=df_pay_user['pay_price'].sum()/df_pay_user['user_id'].count()
print('ARPPU:%.2f'%(arppu))

由上图可知目前盈利较好的手游的ARPU超过5元,一般手游在3~5元之间,盈利较差的低于3元,该游戏的ARPU为8.55元,说明盈利水平较高。
5. 不同等级用户的付费情况
df_user=df[['user_id','bd_stronghold_level','pay_price','pay_count']]
df_table=pd.pivot_table(df_user,index=['bd_stronghold_level'],
values=['user_id','pay_price','pay_count'],
aggfunc={'user_id':'count','pay_price':'sum','pay_count':'sum'})
df_stronghold_pay=pd.DataFrame(df_table.to_records())
#各等级付费人数
df_stronghold_pay['pay_num']=df_user[(df_user['pay_price']>0)].groupby('bd_stronghold_level').user_id.count()
#各等级付费转化率
df_stronghold_pay['pay_rate']=df_stronghold_pay['pay_num']/df_stronghold_pay['user_id']
#各等级平均付费金额
df_stronghold_pay['avg_pay_price']=df_stronghold_pay['pay_price']/df_stronghold_pay['user_id']
#各等级平均付费次数
df_stronghold_pay['avg_pay_count']=df_stronghold_pay['pay_count']/df_stronghold_pay['user_id']
#重命名列名
df_stronghold_pay.columns=['要塞等级','总付费次数','总付费金额','总人数',
'付费人数','付费转化率','人均付费金额','人均付费次数']
df_stronghold_pay=df_stronghold_pay[['要塞等级','总人数','付费人数','付费转化率',
'总付费金额','人均付费金额','总付费次数','人均付费次数']]
df_stronghold_pay=df_stronghold_pay.round(2)
print(df_stronghold_pay)

可视化:
#要塞等级—付费转化率
x=df_stronghold_pay['要塞等级']
y=df_stronghold_pay['付费转化率']
plt.xticks(x,range(0,len(x),1))
plt.plot(x,y)
plt.grid(True)
plt.title('不同等级用户付费转化率',fontproperties=font)
plt.show()

#要塞等级-人均付费金额
x=df_stronghold_pay['要塞等级']
y=df_stronghold_pay['人均付费金额']
plt.xticks(x,range(0,len(x),1))
plt.plot(x,y)
plt.grid(True)
plt.title('不同等级用户人均付费jine',fontproperties=font)
plt.show()

x=df_stronghold_pay['要塞等级']
y=df_stronghold_pay['人均付费金额']
plt.xticks(x,range(0,len(x),1))
plt.plot(x,y)
plt.grid(True)
plt.title('不同等级用户人均付费jine',fontproperties=font)
plt.show()
#要塞等级-人均付费次数
x=df_stronghold_pay['要塞等级']
y=df_stronghold_pay['人均付费次数']
plt.xticks(x,range(0,len(x),1))
plt.plot(x,y)
plt.grid(True)
plt.title('不同等级用户人均付费次数',fontproperties=font)
plt.show()

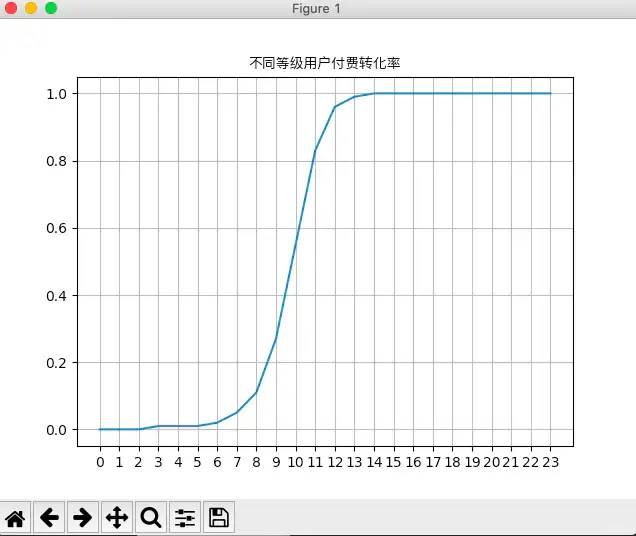
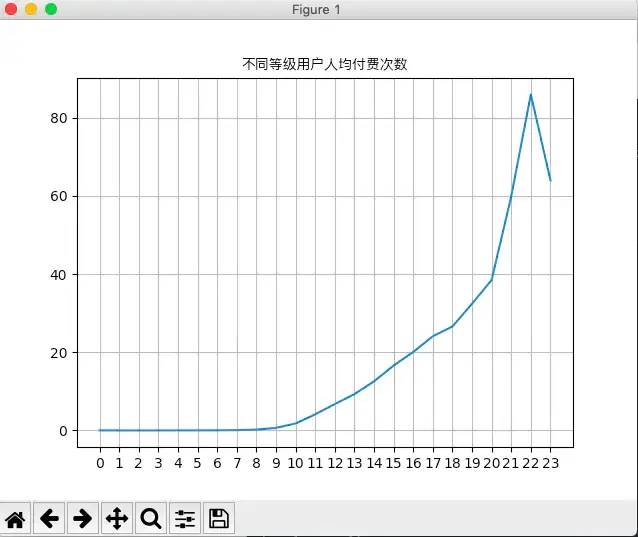
从上面看到用户等级到达10级时,付费率接近60%,等级到达13级时,付费率接近100%,且人均付费金额和次数两项指标也在用户达到10级后增长迅速,因此可以认定10级以上用户为游戏的核心用户。
但是观察用户等级分布,发现绝大部分用户还是处在10级以下的水平,因此如何使用户达到10级是游戏运营接下来需要考虑的事。
6. 不同玩家的消费习惯
该游戏充值主要可以获得道具类(木头、石头、象牙、肉、魔法)和加速券类(通用、建筑、科研、训练、医疗)。根据用户的充值金额大小,分别分析两类消费品的消耗情况。
#将等级>=10级的玩家划分为:消费>=500为高消费玩家,<500为普通玩家
df_eli_user=df[(df['pay_price']>=500)&(df['bd_stronghold_level']>=10)]
df_nor_user=df[(df['pay_price']<500)&(df['bd_stronghold_level']>10)]
#不同玩家的道具消耗情况
wood_avg=[df_eli_user['wood_reduce_value'].mean(),df_nor_user['wood_reduce_value'].mean()]
stone_avg=[df_eli_user['stone_reduce_value'].mean(),df_nor_user['stone_reduce_value'].mean()]
ivory_avg=[df_eli_user['ivory_reduce_value'].mean(),df_nor_user['ivory_reduce_value'].mean()]
meat_avg=[df_eli_user['meat_reduce_value'].mean(),df_nor_user['meat_reduce_value'].mean()]
magic_avg=[df_eli_user['magic_reduce_value'].mean(),df_nor_user['magic_reduce_value'].mean()]
props_data={'high_value_player':[wood_avg[0],stone_avg[0],ivory_avg[0],meat_avg[0],magic_avg[0]],
                        'normal_player':[wood_avg[1],stone_avg[1],ivory_avg[1],meat_avg[1],magic_avg[1]]}
df_props=pd.DataFrame(props_data,index=['wood','stone','ivory','meat','magic'])
df_props=df_props.round(2)
print(df_props)
#可视化
ax=df_props.plot(kind='bar',title='Props Reduce',
                 grid=True,legend=True)
plt.show()

普通玩家和高消费玩家对木头、石头、肉的消耗都较大,魔法的消耗都较小,而在象牙的消耗上,高消费玩家和普通玩家的消耗差距较大。
#不同玩家的加速券消耗情况
general_avg=[df_eli_user['general_acceleration_reduce_value'].mean(),
             df_nor_user['general_acceleration_reduce_value'].mean()]
building_avg=[df_eli_user['building_acceleration_reduce_value'].mean(),
              df_nor_user['building_acceleration_reduce_value'].mean()]
research_avg=[df_eli_user['reaserch_acceleration_reduce_value'].mean(),
              df_nor_user['reaserch_acceleration_reduce_value'].mean()]
training_avg=[df_eli_user['training_acceleration_reduce_value'].mean(),
              df_nor_user['training_acceleration_reduce_value'].mean()]
treatment_avg=[df_eli_user['treatment_acceleration_reduce_value'].mean(),
               df_nor_user['treatment_acceleration_reduce_value'].mean()]
acceleration_data={'high_value_player':[general_avg[0],building_avg[0],research_avg[0],
                           training_avg[0],treatment_avg[0]],
                   'normal_player':[general_avg[1],building_avg[1],research_avg[1],
                           training_avg[1],treatment_avg[1]]}
df_acceleration=pd.DataFrame(acceleration_data,index=['general','building','researching','training','treatment'])
print(df_acceleration.round(2))
#可视化
ax=df_acceleration.plot(kind='bar',title='Acceleration Reduce',
                 grid=True,legend=True)
plt.show()

从上图看出两类玩家对对治疗加速券消耗都很小,对通用加速券的消耗差异较大,其他三种加速券消耗差别不大。
结论
1. 该游戏具有较大的用户基数,且新用户注册受游戏活动、新版本等因素影响较大。
2. 该游戏的ARPU为8.55,说明该游戏的盈利能力较高。
3. 用户等级达到10级后,付费意愿明显上升,且达到13级时付费率将近100%。但是绝大多数用户仍然停留在10级以下,如何使用户平滑升至10级尤为重要。
4. 消费习惯上,高消费玩家对象牙和通用加速券的需求远多于一般玩家。
End.
作者:星屑m
来源:简书
零基础学 Python(送价值109的视频课),来这里
 只需7天时间,跨进Python编程大门,已有3800+加入

【基础】0基础入门python,24小时有人快速解答问题;
【提高】40多个项目实战,老手可以从真实场景中学习python;
【直播】不定期直播项目案例讲解,手把手教你如何分析项目;
【分享】优质python学习资料分享,让你在最短时间获得有价值的学习资源;圈友优质资料或学习分享,会不时给予赞赏支持,希望每个优质圈友既能赚回加入费用,也能快速成长,并享受分享与帮助他人的乐趣。
【人脉】收获一群志同道合的朋友,并且都是python从业者
【价格】本着布道思想,只需 69元 加入一个能保证学习效果的良心圈子。
【赠予】价值109元 0基础入门在线课程,免费送给圈友们,供巩固和系统化复习
