x=[0 100 300 600 1000 1500 ];

y1=[68.1 66.7 61.7 44.68 28.4 17.2];

y2=[1.67 1.76 2.1 3.5 5.6 7.7];

hold on;

[AX,H1,H2] =plotyy(x,y1,x,y2,@plot);% 获取坐标轴、图像句柄

set(get(AX(1),'ylabel'),'string', '耦合效率(%)','fontsize',16);

set(get(AX(2),'ylabel'),'string', '耦合损耗(dB)','fontsize',16);

xlabel('X容差(um)','fontsize',16);

set(H1,'Linestyle','--');

set(H2,'Linestyle',':');

set(gcf,'color','white')

set(gca,'linewidth',1.5) %设置边框宽度

clc,clear

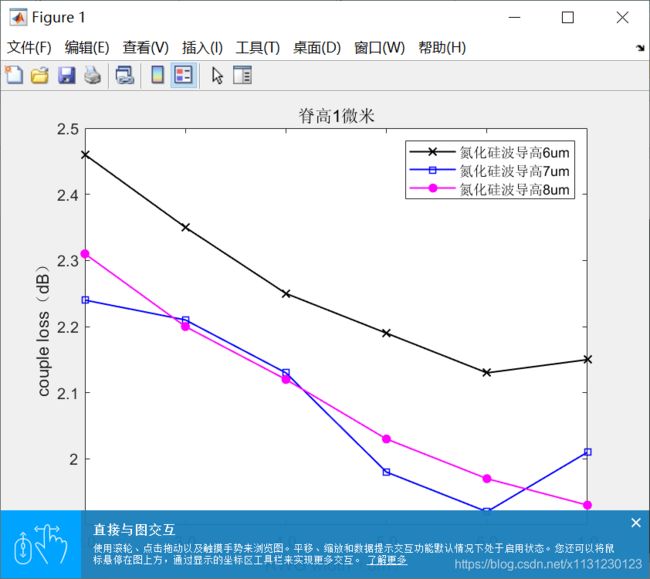
x1=[1,2,3,4,5,6];
y1=[2.46 2.35 2.25 2.19 2.13 2.15];
h=plot(x1,y1,'x-k','markerSize',7,  'LineWidth',1)
hold on

x2=[1,2,3,4,5,6];
y2=[2.24 2.21 2.13 1.98 1.92 2.01];
plot(x2,y2,'s-b','LineWidth',1)
hold on

x3=[1,2,3,4,5,6];
y3=[2.31 2.2 2.12 2.03 1.97 1.93];
plot(x3,y3,'.-m', 'markerSize',20, 'LineWidth',1)

legend("氮化硅波导高6um","氮化硅波导高7um","氮化硅波导高8um","location","northeast");
xlabel("RWG width(um)")%x轴标记
ylabel("couple loss(dB)")%y轴标记
 title("脊高1微米")%标题
% set(gca,'XDir','reverse');
str{1}=['1.0'];
str{2}=['2.0'];
str{3}=['3.0'];
str{4}=['4.0'];
str{5}=['5.0'];
str{6}=['6.0'];


haxes = get(h,'parent');
set(haxes,'xtick',(0:1:6),'xticklabel',str)


