siamfc-pytorch代码讲解(三):demo&track
siamfc-pytorch代码讲解(三):demo&track
- 一、demo.py
- 二、track
- 2.1 init(self, img, box)
- 2.2 update(self, img)
- 三、checkpoint and demo
- 四、test results
- OTB2013
- OTB2015
- 五、matlab官方评测
- 六、上下篇
我之前的两篇博客:
- siamfc-pytorch代码讲解(一):backbone&head
- siamfc-pytorch代码讲解(二):train&siamfc
- 代码来自:https://github.com/huanglianghua/siamfc-pytorch
今天主要看一下demo的部分,也就是涉及到测试tracking的部分。
直接上代码:
一、demo.py
from __future__ import absolute_import

import os
import glob
import numpy as np

from siamfc import TrackerSiamFC


if __name__ == '__main__':
    seq_dir = os.path.expanduser('D:\\OTB\\Crossing\\')
    img_files = sorted(glob.glob(seq_dir + 'img/*.jpg'))
    anno = np.loadtxt(seq_dir + 'groundtruth_rect.txt', delimiter=',')

    net_path = 'pretrained/siamfc_alexnet_e50.pth'
    tracker = TrackerSiamFC(net_path=net_path)
    tracker.track(img_files, anno[0], visualize=True)
- 上面的
第11行路径自己该,我这次是windows测试的,所以这样写了(看着有点不规范)。 13行我多加了一点代码:, delimiter=',',不加这个会报这样的错:
ValueError: could not convert string to float
- 下面几行就是用训练好的siamfc_alexnet_e50.pth模型进行tracking,给定的是img_files:视频序列;anno[0]就是第一帧中的ground truth bbox。
二、track
现在就来看一下类TrackerSiamFC下的track方法。这个函数的作用就是传入video sequence和first frame中的ground truth bbox,然后通过模型,得到后续帧的目标位置,可以看到主要有两个函数实现:init和update,这也是继承Tracker需要重写的两个方法:
init:就是传入第一帧的标签和图片,初始化一些参数,计算一些之后搜索区域的中心等等update:就是传入后续帧,然后根据SiamFC网络返回目标的box坐标,之后就是根据这些坐标来show,起到一个demo的效果。
def track(self, img_files, box, visualize=False):
    frame_num = len(img_files)
    boxes = np.zeros((frame_num, 4))
    boxes[0] = box
    times = np.zeros(frame_num)

    for f, img_file in enumerate(img_files):
        img = ops.read_image(img_file)

        begin = time.time()
        if f == 0:
            self.init(img, box)
        else:
            boxes[f, :] = self.update(img)
        times[f] = time.time() - begin

        if visualize:
            ops.show_image(img, boxes[f, :])

    return boxes, times
2.1 init(self, img, box)
我强烈建议可以用两个设备,一个看代码,一个用来看我下边的长图,对照着分析
def init(self, img, box):
    # set to evaluation mode
    self.net.eval()

    # convert box to 0-indexed and center based [y, x, h, w]
    box = np.array([
        box[1] - 1 + (box[3] - 1) / 2,
        box[0] - 1 + (box[2] - 1) / 2,
        box[3], box[2]], dtype=np.float32)
    self.center, self.target_sz = box[:2], box[2:]

    # create hanning window
    self.upscale_sz = self.cfg.response_up * self.cfg.response_sz  # 272
    self.hann_window = np.outer(
        np.hanning(self.upscale_sz),
        np.hanning(self.upscale_sz))
    self.hann_window /= self.hann_window.sum()

    # search scale factors
    self.scale_factors = self.cfg.scale_step ** np.linspace(
        -(self.cfg.scale_num // 2),
        self.cfg.scale_num // 2, self.cfg.scale_num)  # 1.0375**(-2,-0.5,1)

    # exemplar and search sizes
    context = self.cfg.context * np.sum(self.target_sz)
    self.z_sz = np.sqrt(np.prod(self.target_sz + context))
    self.x_sz = self.z_sz * \
                self.cfg.instance_sz / self.cfg.exemplar_sz

    # exemplar image
    self.avg_color = np.mean(img, axis=(0, 1))
    z = ops.crop_and_resize(
        img, self.center, self.z_sz,
        out_size=self.cfg.exemplar_sz,
        border_value=self.avg_color)

    # print(z.shape) # [127,127,3]
    # exemplar features [H,W,C]->[C,H,W]
    z = torch.from_numpy(z).to(
        self.device).permute(2, 0, 1).unsqueeze(0).float()
    self.kernel = self.net.backbone(z)  # torch.Size([1, 256, 6, 6])
- 一开始,就是把输入的ltwh格式的box转变为[y, x, h, w]格式的,这个看过我第二篇的就很清楚了,然后记录bbox的中心和宽高size信息,以备后用(如下图黑色字体表示的)
- 这里计算了响应图上采样后的大小upscale_sz,因为论文中有这样一句话:
We found that upsampling the score map using bicubic interpolation, from 17 × 17 to 272 × 272, results in more accurate localization since the original map is relatively coarse.也就是17×16=272 - 然后创建了一个汉宁窗(hanning window),也叫余弦窗【可以看这里】,论文中说是增加惩罚:
Online, ... and a cosine window is added to the score map to penalize large displacements - 论文中提到两个变体,一个是5个尺度的,一个是3个尺度的(这里就是),5个尺度依次是 1.02 5 [ − 2 , − 1 , 0 , 1 , 2 ] 1.025^{[-2,-1,0,1,2]} 1.025[−2,−1,0,1,2],代码中3个尺度是 1.037 5 [ − 2 , − 0.5 , 1 ] 1.0375^{[-2,-0.5,1]} 1.0375[−2,−0.5,1]
- context 就是边界的语义信息,为了计算z_sz和x_sz,最后送入crop_and_resize去抠出搜索区域【我第二篇博客有讲这个函数】, z_sz大小可以看下面蓝色方形框, x_sz大小可以看下面粉色方形框,最后抠出z_sz大小的作为exemplar image,并送入backbone,输出embedding,也可以看作是一个固定的互相关kernel,为了之后的相似度计算用,如论文中提到:
We found that updating (the feature representation of) the exemplar online through simple strategies, such as linear interpolation, does not gain much performance and thus we keep it fixed
关于一些tensor的shape可以看代码里的注释,下面是我当时的笔记:

2.2 update(self, img)
我强烈建议可以用两个设备,一个看代码,一个用来看我下边的长图,对照着分析
def update(self, img):
    # set to evaluation mode
    self.net.eval()

    # search images
    x = [ops.crop_and_resize(
        img, self.center, self.x_sz * f,
        out_size=self.cfg.instance_sz,
        border_value=self.avg_color) for f in self.scale_factors]
    x = np.stack(x, axis=0)  # [3, 255, 255, 3]
    x = torch.from_numpy(x).to(
        self.device).permute(0, 3, 1, 2).float()

    # responses
    x = self.net.backbone(x)  # [3, 256, 22, 22]
    responses = self.net.head(self.kernel, x)  # [3, 1, 17, 17]
    responses = responses.squeeze(1).cpu().numpy()  # [3, 17, 17]

    # upsample responses and penalize scale changes
    responses = np.stack([cv2.resize(
        u, (self.upscale_sz, self.upscale_sz),
        interpolation=cv2.INTER_CUBIC)
        for u in responses])  # [3, 272, 272]
    responses[:self.cfg.scale_num // 2] *= self.cfg.scale_penalty
    responses[self.cfg.scale_num // 2 + 1:] *= self.cfg.scale_penalty

    # peak scale
    scale_id = np.argmax(np.amax(responses, axis=(1, 2)))  # which channel is max

    # peak location
    response = responses[scale_id]
    response -= response.min()
    response /= response.sum() + 1e-16
    response = (1 - self.cfg.window_influence) * response + \
               self.cfg.window_influence * self.hann_window
    loc = np.unravel_index(response.argmax(), response.shape)

    # locate target center: disp stand for displacement
    disp_in_response = np.array(loc) - (self.upscale_sz - 1) / 2
    disp_in_instance = disp_in_response * \
                       self.cfg.total_stride / self.cfg.response_up
    disp_in_image = disp_in_instance * self.x_sz * \
                    self.scale_factors[scale_id] / self.cfg.instance_sz
    self.center += disp_in_image

    # update target size
    scale = (1 - self.cfg.scale_lr) * 1.0 + \
            self.cfg.scale_lr * self.scale_factors[scale_id]
    self.target_sz *= scale
    self.z_sz *= scale
    self.x_sz *= scale

    # return 1-indexed and left-top based bounding box
    box = np.array([
        self.center[1] + 1 - (self.target_sz[1] - 1) / 2,
        self.center[0] + 1 - (self.target_sz[0] - 1) / 2,
        self.target_sz[1], self.target_sz[0]])

    return box
- update顾名思义就是对后续的帧更新出bbox来,因为是tracking phase,所以把模型设成eval mode。然后在这新的帧里抠出search images,根据之前init里生成的3个尺度,然后resize成255×255,特别一点,我们可以发现search images在resize之前的边长x_sz大约为target_sz的4倍,这也印证了论文中的:
we only search for the object within a region of approximately four times its previous size - 然后将这3个尺度的patch(也就是3个搜索范围)拼接一起,送入backbone,生成emdding后与之前的kernel进行互相关,得到score map,这些tensor的shape代码里都有标注,得到3个17×17的responses,然后对每一个response进行上采样到272×272
- 上面的
24,25行就是对尺度进行惩罚,我是这样理解的,因为中间的尺度肯定是接近于1,其他两边的尺度不是缩一点就是放大一点,所以给以惩罚,如论文中说:Any change in scale is penalized - 之后就选出这3个通道里面最大的那个,并就行归一化和余弦窗惩罚,然后通过
numpy.unravel_index找到一张response上峰值点(peak location)【关于这个函数可以看这里】 - 接下来的问题就是:在response图中找到峰值点,那这在原图img中在哪里呢?所以我们要计算位移(displacement),因为我们原本都是以目标为中心的,认为最大峰值点应该在response的中心,所以
39行就是峰值点和response中心的位移。 - 因为之前在img上crop下一块instance patch,然后resize,然后送入CNN的backbone,然后score map又进行上采样成response,所以要根据这过程,逆回去计算对应在img上的位移,所以
上面的39-43行就是在做这件事,也可以看下面的图 - 根据
disp_in_image修正center,然后update target size,因为论文有一句:update the scale by linear interpolation with a factor of 0.35 to provide damping,但是似乎参数不太对得上,线性插值可以看下面蓝色的图,因为更新后的scale还是很接近1,所以bbox区域不会变化很大 - 最后根据ops.show_image输入的需要,又得把bbox格式改回ltwh的格式

三、checkpoint and demo
我的模型存在这里,但是只训练了GOT-10k的前500个序列,但感觉效果也还行:
之后在全部训练序列上训练出来的模型(到49轮的时候电脑卡死了,感觉训练过程中cpu占用率很高):siamfc_alexnet_e49.zip
四、test results
这里放一下测试结果,当然和代码提供者结果,论文中的结果都是有距离的:
OTB2013
| success OPE | |
|---|---|
| 我的 | 0.466/0.520 |
| 代码提供者的 | 0.589 |
| siamfc论文中的 | 0.612 |
注意:我的OPE那栏里,前面那个是训了一部分的结果,下面也是一样的
OTB2015
| success OPE | |
|---|---|
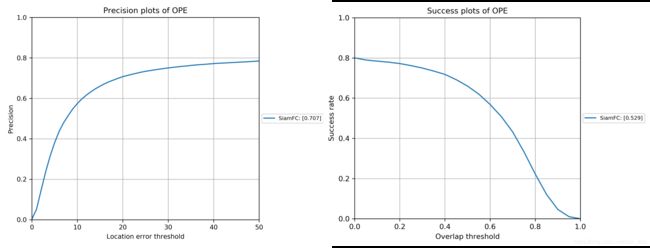
| 我的 | 0.469/0.529 |
| 代码提供者的 | 0.578 |
| siamfc论文中的 | 0.582 |
注意:siamfc论文中的没有OTB2015的success OPE,我摘抄自SiamRPN论文,不过可以去官方地址有matlab结果文件,有机会用official toolkit评估一下,再来放个结果

上面的结果更新了一下,原因之前的OTB数据集没整理好,导致实际评估的序列数少了。我看过OTB benchmark官方评测代码python版本,里面评测和画图的方法和GOT-10k里面的ExperimentOTB是一样的,可以放心使用。
五、matlab官方评测
2020/05/20 情人节更新一下结果,这个是SiamFC官方project的结果:我使用的是
results_SiamFC-3s_OTB-100.zip,然后用OTB official MATLAB toolkit的代码tracker_benchmark_v1.0.zip

具体的做法如下:
- 去这篇博客下载包含otb全部序列的anno,tracker_benchmark_v1.0里面只有CVPR2013的序列注释(注意新加的序列名字不再都是小写的),把anno覆盖掉原来的,把configSeqs复制替换掉原来的configSeqs.m文件,在configTrackers.m中最后改成如下:
trackersSiamfc={struct('name','siamfc3s','namePaper','SiamFC')};
trackers = trackersSiamfc;
- 在tracker_benchmark_v1.0的results文件夹下新建results_TRE_OTB100,并把上面下载的结果文件results_SiamFC-3s_OTB-100.zip里面的.mat文件拷贝其中,并把genPerfMat.m的13行改成
rpAll=['.\results\results_TRE_OTB100\'];(这个结果文件是TRE的,但是TRE的第一次就是OPE) - 因为结果.mat文件跟我们configSeqs.m里面的seq.name不完全一样,所以得重命名,可用下面的python脚本重命名:
import os

tracker_name = 'siamfc3s'
location = len(tracker_name) + 1
# replace to your own path
anno_seqs_path = 'D:\\tracker_benchmark_v1.0\\anno'
anno_seqs = os.listdir(anno_seqs_path)
anno_seqs.remove('att')
assert len(anno_seqs) == 100, 'otb must have 100 seqs!'
anno_seqs = [anno_seq[:-4] for anno_seq in anno_seqs]
lower_anno_seqs = [i.lower() for i in anno_seqs]
# print(anno_seqs)
# replace to your own path
res_seqs_path = 'D:\\tracker_benchmark_v1.0\\results\\results_TRE_OTB100'
res_seqs = os.listdir(res_seqs_path)
assert len(res_seqs) == len(anno_seqs), \
    'otb result must have equal length with anno'
# remove .mat
res_seqs = [res_seq[:-4] for res_seq in res_seqs]
lower_res_no_tracker_name = [seq[:-location].lower() for seq in res_seqs]
# print(lower_res_no_tracker_name)
# different naming methods
diff = []
for res_seq in lower_res_no_tracker_name:
    if res_seq not in lower_anno_seqs:
        diff.append(res_seq)

print('different naming methods:', diff)
assert not diff, 'before rename, should rename diff name seqs!'

# rename res file name
for res_seq in lower_res_no_tracker_name:
    anno_idx = lower_anno_seqs.index(res_seq)
    res_idx = lower_res_no_tracker_name.index(res_seq)
    old_name = os.path.join(res_seqs_path, res_seqs[res_idx]+'.mat')
    new_name = os.path.join(res_seqs_path, anno_seqs[anno_idx]+'_'+tracker_name+'.mat')
    os.rename(old_name, new_name)
- 这样运行perfPlot.m文件就能出结果了,其中105行的rankingType = 'AUC’时能得到success plot;rankingType = 'threshold’时能得到precision plot【这时得到的成功图不是0-1阈值下的,所以只有准确率图能用】
六、上下篇
上一篇:siamfc-pytorch代码讲解(二):train&siamfc
下一篇:OTB官方评估代码python版本–评估自己跟踪器,对比其他跟踪器