最新版学习笔记---Python机器学习基础教程(4)线性模型(分类)---附完整代码
线性模型
- 1. 用于二分类的线性模型
- 2. 用于多分类的线性模型
线性模型也同样应用于分类问题。
1. 用于二分类的线性模型
首先我们看一下二分类,预测公式:
![]()
这个公式上一篇博文里面的线性回归公式非常相似,但是我们没有返回特征的加权求和,而是为预测设置了阈值(0)。如果函数值小于0,我们就预测类别-1;若函数值大于0,我们就预测类别+1。
最常见的两种线性分类算法是Logistic回归和线性支持向量机(线性SVM)
在这里我们将两个模型应用在forge数据集上,并将线性模型找到的决策边界可视化。
运行代码如下:
from sklearn.linear_model import LogisticRegression
from sklearn.svm import LinearSVC
import mglearn
import matplotlib.pyplot as plt
X,y=mglearn.datasets.make_forge()
fig,axes = plt.subplots(1,2,figsize=(10,3))
for model,ax in zip([LinearSVC(),LogisticRegression()],axes):
    clf=model.fit(X,y)
    mglearn.plots.plot_2d_separator(clf,X,fill=False,eps=0.5,ax=ax)
    mglearn.discrete_scatter(X[:,0],X[:,1],y,ax=ax)
    ax.set_title("{}".format(clf.__class__.__name__))
    ax.set_xlabel("Feature 0")
    ax.set_ylabel("Feature 1")
axes[0].legend()
plt.show()
效果图:

这两个算法的决策边界都是直线。这两个模型都默认使用L2正则化,和Ridge回归一样。
对于LogisticRegression和LinearSCV,决定正则化强度的权衡参数叫做C。
C值越大,对应正则化越弱,也就是说,参数C的值较大,那么两个模型将尽可能将训练集拟合到最好;如果C的值较小,那么模型更强调是系数w接近于0.
让我们来看一下不同c值的线性SCM在forge数据集上的决策边界,如下图:

在左图中,C的值最小,对应强正则化;中间图,C的值较大,模型更关注两个分类错误的样本,是决策边界的斜率变大;在右图中,C的值非常大,是决策边界的斜率变得更大。
我们在乳腺癌数据集上详细分析LogisticRegression,运行代码如下:
from sklearn.datasets import load_breast_cancer
from sklearn.model_selection import train_test_split
from sklearn.linear_model import LogisticRegression
import matplotlib.pyplot as plt
cancer=load_breast_cancer()
#传入参数stratify作用为以分层方式分割数据,保持测试集与整个数据集里cancer.target的数据分类比例一致,
#默认值为None,例如:cancer.target分两类:0和1,其中0有400个,1有600个,即数据分类的比例为4:6。
#则训练集和测试集中的数据分类比例将与cancer.target一致,也是4:6,
#结果就是在训练集中有300个0和450个1;测试集中有100个0和150个1
X_train,X_test,y_train,y_test=train_test_split(
    cancer.data,cancer.target,stratify=cancer.target,random_state=42)#分离数据
logreg=LogisticRegression().fit(X_train,y_train)
print("Training set score:{:.3f}".format(logreg.score(X_train,y_train)))
print("Test set score:{:.3f}".format(logreg.score(X_test,y_test)))
输出:
Training set score:0.948
Test set score:0.958
C=1的默认值给出了相当好的性能,但是由于训练集和测试集的性能非常接近,所以模型很可能欠拟合。
我们下面尝试增大C来拟合一个更加灵活的模型,运行代码如下:
from sklearn.datasets import load_breast_cancer
from sklearn.model_selection import train_test_split
from sklearn.linear_model import LogisticRegression
import matplotlib.pyplot as plt
cancer=load_breast_cancer()
X_train,X_test,y_train,y_test=train_test_split(
    cancer.data,cancer.target,stratify=cancer.target,random_state=42)#分离数据
logreg=LogisticRegression(C=100,penalty="l2").fit(X_train,y_train)
print("Training set score:{:.3f}".format(logreg.score(X_train,y_train)))
print("Test set score:{:.3f}".format(logreg.score(X_test,y_test)))
输出:
Training set score:0.953
Test set score:0.965
令C=10可以得到更高的训练集精度,也得到了稍高的测试集精度。
- 其中penalty参数会影响正则化,也会影响模型是使用所有可用特征还是只选择特征的一个子集。
这里的Logistic回归模型默认使用L2正则化
2. 用于多分类的线性模型
许多的线性分类模型只适用于二分类问题,不能轻易推广到多类别问题(除了Logistic回归)。
将二分类算法推广到多分类算法的一种常见方法是“一对其余”方法。
该方法对每个类别都学习一个二分类的模型,将这个类别与所有其他类别尽可能地分开,生成了一个与类别个数一样多的二分类模型。
在测试集上运行所有的二分类模型进行预测,在对应类别上分数高的分类器“胜出”,将这个类别标签返回作为预测结果。
多分类Logistic回归背后的数学与“一对其余”方法稍微有点不同,但它也是对每个类别都有一个系数向量和一个截距,也使用了同样的预测方法。
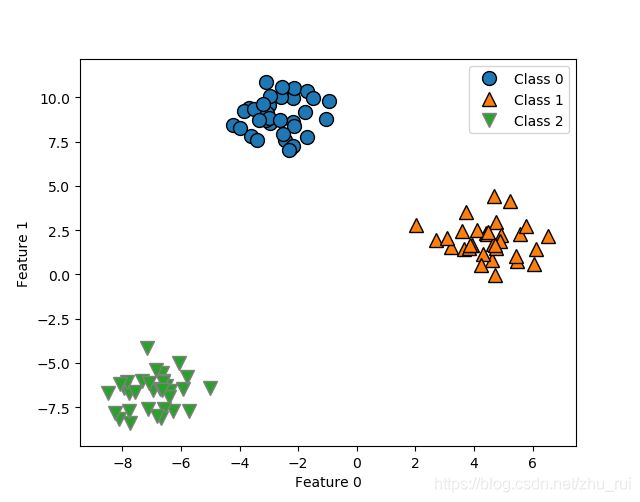
下面我们将“一对其余”方法应用在一个简单的三分类数据集上。运行代码如下:
from sklearn.datasets import make_blobs
import mglearn
import matplotlib.pyplot as plt
X,y=make_blobs(random_state=42)
mglearn.discrete_scatter(X[:,0],X[:,1],y)
plt.xlabel("Feature 0")
plt.ylabel("Feature 1")
plt.legend(["Class 0","Class 1","Class 2"])
plt.show()
效果图:

上图为半酣三个类别的二维玩具数据集,接下来在这个数据集上训练一个LinearSVC分类器,
运行代码如下:
from sklearn.datasets import make_blobs
from sklearn.svm import LinearSVC
X,y=make_blobs(random_state=42)#参数random_state指定随机数生成器的种子,使每次拆分的数据集相同
linear_svm= LinearSVC().fit(X,y)#训练数据
print("Coefficient shape: ",linear_svm.coef_.shape)
print("Intercept shape: ",linear_svm.intercept_.shape)
print("-----------------")
print(linear_svm.coef_)
print("-----------------")
print(linear_svm.intercept_)
输出:
Coefficient shape:  (3, 2)
Intercept shape:  (3,)
-----------------
[[-0.17492193  0.23141221]
 [ 0.47621693 -0.06936525]
 [-0.18914143 -0.20400521]]
-----------------
[-1.07745423  0.13140757 -0.08604997]
我们可以看到模型系数coef_的形状是(3,2),说明coef_每行包含三个类别之一的系数向量,每列包含2个特征的对应系数值;现在intercept_是一维数组,保存每个类别的截距。
下面我们将这3个二类分类器给出的直线可视化,并给出二维空间的所有预测结果,运行代码如下:
from sklearn.datasets import make_blobs
from sklearn.svm import LinearSVC
import mglearn
import matplotlib.pyplot as plt
import numpy as np
#参数random_state指定随机数生成器的种子,使每次拆分的数据集相同
X,y=make_blobs(random_state=42)
linear_svm= LinearSVC().fit(X,y)
#第一个参数为模型,第二个参数X为训练数据,fill参数设置为填充可见,alpha参数指透明度
#加入这行代码重新运行得到第二个图
#mglearn.plots.plot_2d_classification(linear_svm,X,fill=True,alpha=0.6)
mglearn.discrete_scatter(X[:,0],X[:,1],y)
line = np.linspace(-15,15)
for coef,intercept ,color in zip(linear_svm.coef_,linear_svm.intercept_,['b','r','g']):
	#第一个参数x轴,第二个参数y轴(这就是个公式,目前我也不是很懂,后面我明白了会更新),c参数颜色
    plt.plot(line,-(line*coef[0]+intercept)/coef[1],c=color)
plt.ylim(-10,15)
plt.xlim(-10,8)
plt.xlabel("Feature 0")
plt.ylabel("Feature 1")
plt.legend(["Class 0","Class 1","Class 2","Line class 0","Line class 1","Line class 2"],
	loc=(1.01,0.3))
plt.show()
- 完整代码都在文章里面全部可以运行
- 有不懂得地方和问题请留言
- 这是一个系列,大家可以收藏一下以后学习用得到
