R 教你做炫酷的--共线性系数展示
1,data =
| mpg | cyl | disp | hp | drat | wt | qsec | vs | am | gear | carb | |
| mpg | 1 | -0.85 | -0.85 | -0.78 | 0.681 | -0.87 | 0.419 | 0.66 | 0.6 | 0.48 | -0.551 |
| cyl | -0.85 | 1 | 0.9 | 0.83 | -0.7 | 0.78 | -0.591 | -0.81 | -0.523 | -0.49 | 0.527 |
| disp | -0.85 | 0.9 | 1 | 0.79 | -0.71 | 0.89 | -0.434 | -0.71 | -0.591 | -0.56 | 0.395 |
| hp | -0.78 | 0.83 | 0.79 | 1 | -0.449 | 0.66 | -0.708 | -0.72 | -0.243 | -0.13 | 0.75 |
| drat | 0.68 | -0.7 | -0.71 | -0.45 | 1 | -0.71 | 0.091 | 0.44 | 0.713 | 0.7 | -0.091 |
| wt | -0.87 | 0.78 | 0.89 | 0.66 | -0.712 | 1 | -0.175 | -0.55 | -0.692 | -0.58 | 0.428 |
| qsec | 0.42 | -0.59 | -0.43 | -0.71 | 0.091 | -0.17 | 1 | 0.74 | -0.23 | -0.21 | -0.656 |
| vs | 0.66 | -0.81 | -0.71 | -0.72 | 0.44 | -0.55 | 0.745 | 1 | 0.168 | 0.21 | -0.57 |
| am | 0.6 | -0.52 | -0.59 | -0.24 | 0.713 | -0.69 | -0.23 | 0.17 | 1 | 0.79 | 0.058 |
| gear | 0.48 | -0.49 | -0.56 | -0.13 | 0.7 | -0.58 | -0.213 | 0.21 | 0.794 | 1 | 0.274 |
| carb | -0.55 | 0.53 | 0.39 | 0.75 | -0.091 | 0.43 | -0.656 | -0.57 | 0.058 | 0.27 | 1 |
2,安装包
install.packages("corrgram") 载入
library(corrgram)corrgram(data, order=TRUE, lower.panel=panel.shade,upper.panel=panel.pie, text.panel=panel.txt,
main="Correlogram of mtcars intercorrelations")
3.2 作图
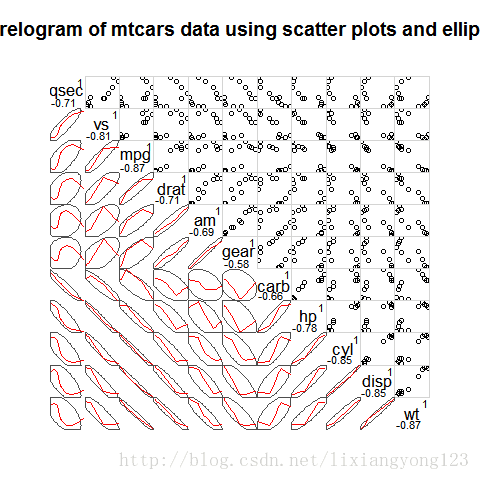
corrgram(xuan2, order=TRUE, lower.panel=panel.ellipse,upper.panel=panel.pts, text.panel=panel.txt,diag.panel=panel.minmax,
main="Correlogram of mtcars data using scatter plots and ellipses")
感觉没啥用,这个图太乱了
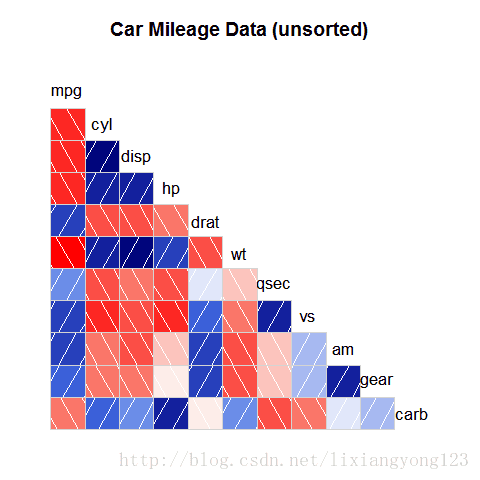
3.3 作图 不显示右侧饼图
corrgram(mtcars,lower.panel=panel.shade,upper.panel=NULL,text.panel=panel.txt,main="Car Mileage Data(unsorted)") corrgram(mtcars, lower.panel=panel.shade,upper.panel=NULL, text.panel=panel.txt,main="Car Mileage Data (unsorted)")
#注释#
data, #数据#
order=TRUE,#表示聚类#
lower.panel=panel.shade,upper.panel=panel.pie, text.panel=panel.txt,
main="Correlogram of mtcars intercorrelations" #标题 #
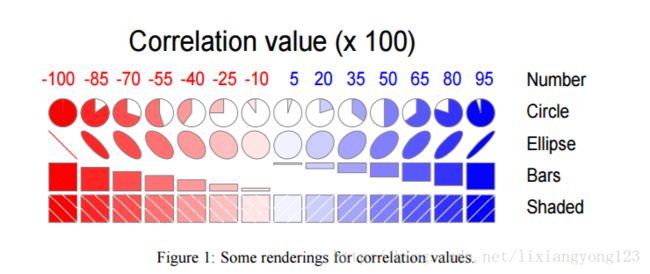
smooth 直线
bar 面积
cor 数值
conf 数值+方差..
ellipse 线圈图
pie 饼状图
pts 散点图
shade 方框+斜线


text.panel=panel.txt 让对角线显示的是名字
upper.panel=panel.shade 右上方的形状
lower.panel=panel.shade 左下放的形状
