clear
clc
close all
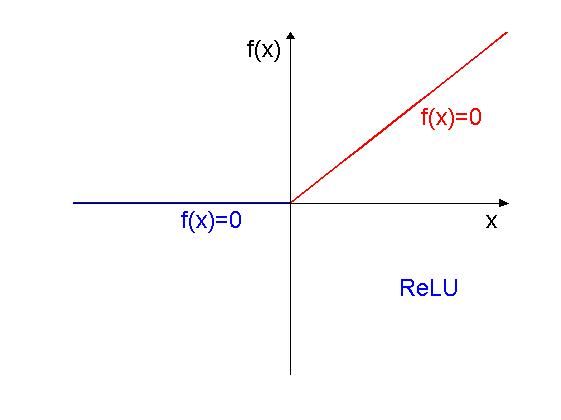
x1 = linspace(-5,0,10);
y1 = 0.*x1;
x2 = linspace(0,5,10);
y2 = x2;
h1 = figure;
hold on
plot(x1,y1,'b','LineWidth',2)
plot(x2,y2,'r','LineWidth',2)
axis off; hold on;
plot([-5 5],[0 0],'k',[0 0],[-5 5],'k');
ax=[max(x2),max(x2)-0.2,max(x2)-0.2;0,0.1,-0.1];
fill(ax(1,:),ax(2,:),'k');
ay=[0,0.1,-0.1;max(y2),max(y2)-0.2,max(y2)-0.2];
fill(ay(1,:),ay(2,:),'k');
text(4.5,-0.5,'x','FontSize',18,'Color','k')
text(-1,4.5,'f(x)','FontSize',18,'Color','k')
text(-2.5,-0.5,'f(x)=0','FontSize',18,'Color','b')
text(3,2.5,'f(x)=0','FontSize',18,'Color','r')
text(2.5,-2.5,'ReLU','FontSize',18,'Color','b')
saveas(h1,'ReLU_fun.jpg','jpg')