用python进行数据清理(上)
数据清理是从数据集、表或数据库中检测和纠正(或删除)损坏或不准确的记录的过程,指的是识别数据中不完整、不正确、不准确或不相关的部分,然后进行替换、修改或删除不干净或者粗糙的数据。
为了使它更简单,我们用Python创建了这个新的完整的分步指南。你将学习如何寻找和清洁的技术:
- 数据缺失
- 数据不规则(异常值)
- 非必要的数据(如重复值)
- 非一致的数据
在本指南中,我们使用了来自Kaggle的俄罗斯住房数据集。这个项目的目标是预测俄罗斯的房价波动。我们不清理整个数据集,但将显示它的例子。
在进入清理过程之前,让我们简要地看一下数据。
# import packages
import pandas as pd
import numpy as np
import seaborn as sns

import matplotlib.pyplot as plt
import matplotlib.mlab as mlab
import matplotlib
plt.style.use('ggplot')
from matplotlib.pyplot import figure

%matplotlib inline
matplotlib.rcParams['figure.figsize'] = (12,8)

pd.options.mode.chained_assignment = None


# read the data
df = pd.read_csv('train.csv')

# shape and data types of the data (30471, 292)
print(df.shape)
print(df.dtypes)

# 打印数字列int/float
df_numeric = df.select_dtypes(include=[np.number])
numeric_cols = df_numeric.columns.values
print(numeric_cols)

# 打印非数字列object
df_non_numeric = df.select_dtypes(exclude=[np.number])
non_numeric_cols = df_non_numeric.columns.values
print(non_numeric_cols)
运行结果
(30471, 292)
id                                         int64
timestamp                                 object
full_sq                                    int64
life_sq                                  float64
floor                                    float64
max_floor                                float64
material                                 float64
build_year                               float64
num_room                                 float64
kitch_sq                                 float64
state                                    float64
product_type                              object
sub_area                                  object
area_m                                   float64
raion_popul                                int64
green_zone_part                          float64
indust_part                              float64
children_preschool                         int64
preschool_quota                          float64
preschool_education_centers_raion          int64
children_school                            int64
school_quota                             float64
school_education_centers_raion             int64
school_education_centers_top_20_raion      int64
hospital_beds_raion                      float64
healthcare_centers_raion                   int64
university_top_20_raion                    int64
sport_objects_raion                        int64
additional_education_raion                 int64
culture_objects_top_25                    object
                                          ...
big_church_count_3000                      int64
church_count_3000                          int64
mosque_count_3000                          int64
leisure_count_3000                         int64
sport_count_3000                           int64
market_count_3000                          int64
green_part_5000                          float64
prom_part_5000                           float64
office_count_5000                          int64
office_sqm_5000                            int64
trc_count_5000                             int64
trc_sqm_5000                               int64
cafe_count_5000                            int64
cafe_sum_5000_min_price_avg              float64
cafe_sum_5000_max_price_avg              float64
cafe_avg_price_5000                      float64
cafe_count_5000_na_price                   int64
cafe_count_5000_price_500                  int64
cafe_count_5000_price_1000                 int64
cafe_count_5000_price_1500                 int64
cafe_count_5000_price_2500                 int64
cafe_count_5000_price_4000                 int64
cafe_count_5000_price_high                 int64
big_church_count_5000                      int64
church_count_5000                          int64
mosque_count_5000                          int64
leisure_count_5000                         int64
sport_count_5000                           int64
market_count_5000                          int64
price_doc                                  int64
Length: 292, dtype: object
['id' 'full_sq' 'life_sq' 'floor' 'max_floor' 'material' 'build_year'
 'num_room' 'kitch_sq' 'state' 'area_m' 'raion_popul' 'green_zone_part'
 'indust_part' 'children_preschool' 'preschool_quota'
 'preschool_education_centers_raion' 'children_school' 'school_quota'
 'school_education_centers_raion' 'school_education_centers_top_20_raion'
 'hospital_beds_raion' 'healthcare_centers_raion'
 'university_top_20_raion' 'sport_objects_raion'
 'additional_education_raion' 'culture_objects_top_25_raion'
 'shopping_centers_raion' 'office_raion' 'full_all' 'male_f' 'female_f'
 'young_all' 'young_male' 'young_female' 'work_all' 'work_male'
 'work_female' 'ekder_all' 'ekder_male' 'ekder_female' '0_6_all'
 '0_6_male' '0_6_female' '7_14_all' '7_14_male' '7_14_female' '0_17_all'
 '0_17_male' '0_17_female' '16_29_all' '16_29_male' '16_29_female'
 '0_13_all' '0_13_male' '0_13_female'
 'raion_build_count_with_material_info' 'build_count_block'
 'build_count_wood' 'build_count_frame' 'build_count_brick'
 'build_count_monolith' 'build_count_panel' 'build_count_foam'
 'build_count_slag' 'build_count_mix'
 'raion_build_count_with_builddate_info' 'build_count_before_1920'
 'build_count_1921-1945' 'build_count_1946-1970' 'build_count_1971-1995'
 'build_count_after_1995' 'ID_metro' 'metro_min_avto' 'metro_km_avto'
 'metro_min_walk' 'metro_km_walk' 'kindergarten_km' 'school_km' 'park_km'
 'green_zone_km' 'industrial_km' 'water_treatment_km' 'cemetery_km'
 'incineration_km' 'railroad_station_walk_km' 'railroad_station_walk_min'
 'ID_railroad_station_walk' 'railroad_station_avto_km'
 'railroad_station_avto_min' 'ID_railroad_station_avto'
 'public_transport_station_km' 'public_transport_station_min_walk'
 'water_km' 'mkad_km' 'ttk_km' 'sadovoe_km' 'bulvar_ring_km' 'kremlin_km'
 'big_road1_km' 'ID_big_road1' 'big_road2_km' 'ID_big_road2' 'railroad_km'
 'zd_vokzaly_avto_km' 'ID_railroad_terminal' 'bus_terminal_avto_km'
 'ID_bus_terminal' 'oil_chemistry_km' 'nuclear_reactor_km' 'radiation_km'
 'power_transmission_line_km' 'thermal_power_plant_km' 'ts_km'
 'big_market_km' 'market_shop_km' 'fitness_km' 'swim_pool_km'
 'ice_rink_km' 'stadium_km' 'basketball_km' 'hospice_morgue_km'
 'detention_facility_km' 'public_healthcare_km' 'university_km'
 'workplaces_km' 'shopping_centers_km' 'office_km'
 'additional_education_km' 'preschool_km' 'big_church_km'
 'church_synagogue_km' 'mosque_km' 'theater_km' 'museum_km'
 'exhibition_km' 'catering_km' 'green_part_500' 'prom_part_500'
 'office_count_500' 'office_sqm_500' 'trc_count_500' 'trc_sqm_500'
 'cafe_count_500' 'cafe_sum_500_min_price_avg'
 'cafe_sum_500_max_price_avg' 'cafe_avg_price_500'
 'cafe_count_500_na_price' 'cafe_count_500_price_500'
 'cafe_count_500_price_1000' 'cafe_count_500_price_1500'
 'cafe_count_500_price_2500' 'cafe_count_500_price_4000'
 'cafe_count_500_price_high' 'big_church_count_500' 'church_count_500'
 'mosque_count_500' 'leisure_count_500' 'sport_count_500'
 'market_count_500' 'green_part_1000' 'prom_part_1000' 'office_count_1000'
 'office_sqm_1000' 'trc_count_1000' 'trc_sqm_1000' 'cafe_count_1000'
 'cafe_sum_1000_min_price_avg' 'cafe_sum_1000_max_price_avg'
 'cafe_avg_price_1000' 'cafe_count_1000_na_price'
 'cafe_count_1000_price_500' 'cafe_count_1000_price_1000'
 'cafe_count_1000_price_1500' 'cafe_count_1000_price_2500'
 'cafe_count_1000_price_4000' 'cafe_count_1000_price_high'
 'big_church_count_1000' 'church_count_1000' 'mosque_count_1000'
 'leisure_count_1000' 'sport_count_1000' 'market_count_1000'
 'green_part_1500' 'prom_part_1500' 'office_count_1500' 'office_sqm_1500'
 'trc_count_1500' 'trc_sqm_1500' 'cafe_count_1500'
 'cafe_sum_1500_min_price_avg' 'cafe_sum_1500_max_price_avg'
 'cafe_avg_price_1500' 'cafe_count_1500_na_price'
 'cafe_count_1500_price_500' 'cafe_count_1500_price_1000'
 'cafe_count_1500_price_1500' 'cafe_count_1500_price_2500'
 'cafe_count_1500_price_4000' 'cafe_count_1500_price_high'
 'big_church_count_1500' 'church_count_1500' 'mosque_count_1500'
 'leisure_count_1500' 'sport_count_1500' 'market_count_1500'
 'green_part_2000' 'prom_part_2000' 'office_count_2000' 'office_sqm_2000'
 'trc_count_2000' 'trc_sqm_2000' 'cafe_count_2000'
 'cafe_sum_2000_min_price_avg' 'cafe_sum_2000_max_price_avg'
 'cafe_avg_price_2000' 'cafe_count_2000_na_price'
 'cafe_count_2000_price_500' 'cafe_count_2000_price_1000'
 'cafe_count_2000_price_1500' 'cafe_count_2000_price_2500'
 'cafe_count_2000_price_4000' 'cafe_count_2000_price_high'
 'big_church_count_2000' 'church_count_2000' 'mosque_count_2000'
 'leisure_count_2000' 'sport_count_2000' 'market_count_2000'
 'green_part_3000' 'prom_part_3000' 'office_count_3000' 'office_sqm_3000'
 'trc_count_3000' 'trc_sqm_3000' 'cafe_count_3000'
 'cafe_sum_3000_min_price_avg' 'cafe_sum_3000_max_price_avg'
 'cafe_avg_price_3000' 'cafe_count_3000_na_price'
 'cafe_count_3000_price_500' 'cafe_count_3000_price_1000'
 'cafe_count_3000_price_1500' 'cafe_count_3000_price_2500'
 'cafe_count_3000_price_4000' 'cafe_count_3000_price_high'
 'big_church_count_3000' 'church_count_3000' 'mosque_count_3000'
 'leisure_count_3000' 'sport_count_3000' 'market_count_3000'
 'green_part_5000' 'prom_part_5000' 'office_count_5000' 'office_sqm_5000'
 'trc_count_5000' 'trc_sqm_5000' 'cafe_count_5000'
 'cafe_sum_5000_min_price_avg' 'cafe_sum_5000_max_price_avg'
 'cafe_avg_price_5000' 'cafe_count_5000_na_price'
 'cafe_count_5000_price_500' 'cafe_count_5000_price_1000'
 'cafe_count_5000_price_1500' 'cafe_count_5000_price_2500'
 'cafe_count_5000_price_4000' 'cafe_count_5000_price_high'
 'big_church_count_5000' 'church_count_5000' 'mosque_count_5000'
 'leisure_count_5000' 'sport_count_5000' 'market_count_5000' 'price_doc']
['timestamp' 'product_type' 'sub_area' 'culture_objects_top_25'
 'thermal_power_plant_raion' 'incineration_raion' 'oil_chemistry_raion'
 'radiation_raion' 'railroad_terminal_raion' 'big_market_raion'
 'nuclear_reactor_raion' 'detention_facility_raion' 'water_1line'
 'big_road1_1line' 'railroad_1line' 'ecology']
从这些结果中,我们了解到数据集有30471行和292列。我们还确定特征是数值变量还是分类变量。这些都是有用的信息。
现在,我们可以浏览“脏”数据类型的检查表并逐个修复它们。
1.数据缺失
丢失数据可视化
处理丢失的数据/值是数据清理中最棘手但最常见的部分之一。虽然许多模型可以处理数据的其他问题,但是大多数模型不接受丢失的数据。
我们将介绍三种技术,以进一步了解数据集中丢失的数据。
1.缺失数据的热图
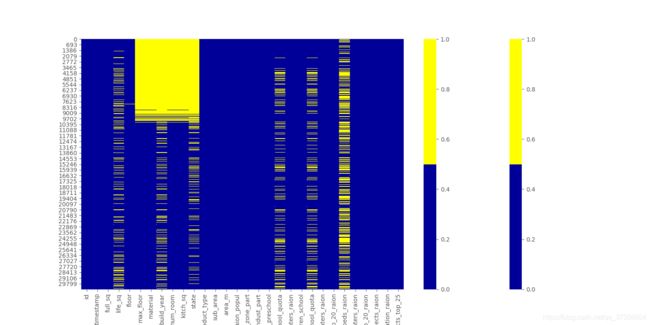
当特征数量较少时,我们可以通过heatmap来可视化缺失的数据。
cols = df.columns[:30] # first 30 columns
colours = ['#000099', '#ffff00'] # specify the colours - yellow is missing. blue is not missing.
sns.heatmap(df[cols].isnull(), cmap=sns.color_palette(colours))
plt.show()
下面的图表展示了前30个特性中缺失的数据模式。横轴为特征名称;纵轴表示观测值/行数;黄色表示缺少的数据,蓝色表示没缺少的数据。
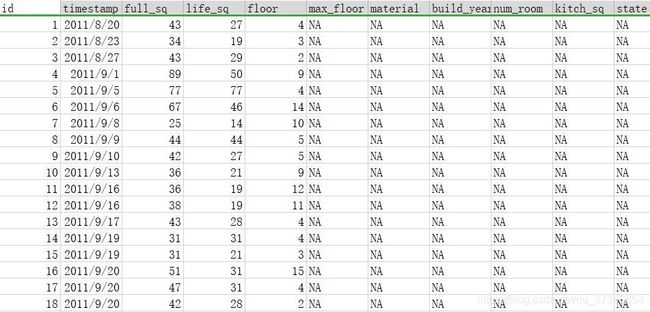
train.csv文件截图如下:
2.缺失数据百分比表
当数据集中有许多特性时,我们可以列出每个特性的缺失数据百分比。
for col in df.columns:
    pct_missing = np.mean(df[col].isnull())
    print('{} - {}%'.format(col, round(pct_missing*100)))
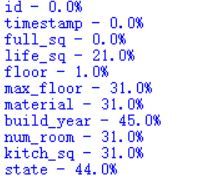
这将生成一个列表,在下面的列表中显示每个特性缺失值的百分比。
具体来说,我们看到life_sq功能有21%的缺失,而地板只有1%的缺失。这个列表是一个有用的总结,可以补充热图可视化。
3.丢失数据直方图
当我们有很多特征时,丢失数据直方图也是一种技术。
为了了解更多关于观测中缺失值模式的信息,我们可以通过直方图将其可视化。
for col in df.columns:
    missing = df[col].isnull()
    num_missing = np.sum(missing)

    if num_missing > 0:
        print('created missing indicator for: {}'.format(col))
        df['{}_ismissing'.format(col)] = missing


# then based on the indicator, plot the histogram of missing values
ismissing_cols = [col for col in df.columns if 'ismissing' in col]
df['num_missing'] = df[ismissing_cols].sum(axis=1)

df['num_missing'].value_counts().reset_index().sort_values(by='index').plot.bar(x='index', y='num_missing')
这个直方图有助于识别30,471个观察值中缺失的值。

例如,有6000多个没有缺失值的观测值,而有一个缺失值的观测值接近4000个。
对于缺失数据的处理方法
对于处理缺失的数据,没有一致的解决方案。我们必须研究特定的特性和数据集,以确定处理它们的最佳方式。
下面介绍四种最常见的处理丢失数据的方法。但是,如果情况比通常更复杂,我们需要创造性地使用更复杂的方法,比如缺失数据建模。
1.删除观察值
在统计学中,这种方法称为列表删除技术。在这个解决方案中,只要整个观察值包含一个丢失的值,我们就删除它。只有当我们确信丢失的数据不能提供信息时,我们才执行此操作。否则,我们应该考虑其他的解决方案。还可以使用其他标准来删除观察结果。
例如,从缺失的数据柱状图中,我们注意到只有少量的观察数据总共丢失了35个以上的特征。我们可以创建一个新的数据集df_less_missing_rows,删除包含35个以上缺失特性的观察数据。
ind_missing = df[df['num_missing'] > 35].index
df_less_missing_rows = df.drop(ind_missing, axis=0)
2.删除特征值
与解决方案1类似,我们只在确信该特性没有提供有用信息时才这样做。例如,在缺失数据百分比列表中,我们注意到hospital_beds_raion有47%的高缺失值百分比。我们可能会删除该特征。
cols_to_drop = ['hospital_beds_raion']
df_less_hos_beds_raion = df.drop(cols_to_drop, axis=1)
3.估算缺失值
当特征是一个数值变量时,我们可以进行缺失数据的归并。我们将缺失的值替换为未缺失的相同特征数据的平均值或中值。
当特征是一个分类变量时,我们可以通过模式(最频繁的值)来估算缺失的数据。
以life_sq为例,我们可以用它的中值来代替这个特性的缺失值。
med = df['life_sq'].median()
print(med)
df['life_sq'] = df['life_sq'].fillna(med)
此外,我们可以对所有的数值特征同时应用相同的归算策略。
即所有数据的缺失值用平均值代替。
df_numeric = df.select_dtypes(include=[np.number])
numeric_cols = df_numeric.columns.values

for col in numeric_cols:
    missing = df[col].isnull()
    num_missing = np.sum(missing)

    if num_missing > 0:  # 仅对具有缺失值的列进行估算。
        print('imputing missing values for: {}'.format(col))
        df['{}_ismissing'.format(col)] = missing
        med = df[col].median()
        df[col] = df[col].fillna(med)
对于非数据类型的缺失值,我们利用该特征中的最频繁值特征代替。
df_non_numeric = df.select_dtypes(exclude=[np.number])
non_numeric_cols = df_non_numeric.columns.values

for col in non_numeric_cols:
    missing = df[col].isnull()
    num_missing = np.sum(missing)

    if num_missing > 0:  # only do the imputation for the columns that have missing values.
        print('imputing missing values for: {}'.format(col))
        df['{}_ismissing'.format(col)] = missing

        top = df[col].describe()['top'] # impute with the most frequent value.
        df[col] = df[col].fillna(top)
4.替换缺失值
对于分类特性,我们可以添加一个值为“MISSING”的新类别。对于数值特征,我们可以用一个特定的值来代替它,比如-999。
通过这种方式,我们仍然保留了丢失的值作为有价值的信息。
df['sub_area'] = df['sub_area'].fillna('_MISSING_')


# numeric
df['life_sq'] = df['life_sq'].fillna(-999)
2.不规则的数据(异常值)
离群值是与其他观测结果有显著区别的数据。它们可能是真正的异常值或错误。
根据特征是数值型的还是分类型的,我们可以使用不同的技术来研究其分布以检测离群值。
1.柱状图/箱线图
当特征是数值型时,我们可以使用直方图和箱形图来检测离群值。
下面是特征life_sq的直方图。
df['life_sq'].hist(bins=100)
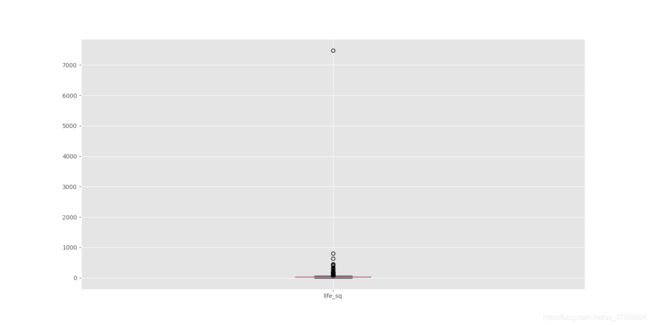
为了更深入地研究这个特性,让我们做一个方框图。
df.boxplot(column=['life_sq'])
在这个图中,我们可以看到这个特征有超过7000的离群值。
2.描述统计
此外,对于数值特性,异常值可能太明显,以至于箱形图无法将它们可视化。相反,我们可以看看它们的描述性统计。
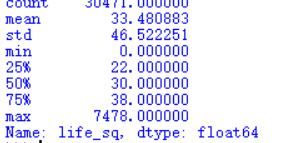
例如,对于特性life_sq,我们可以看到最大值是7478,而该特征中75%的数只有43。故7478值是一个离群值。
3.长条图
当特征是分类的。我们可以用柱状图来了解它的种类和分布。
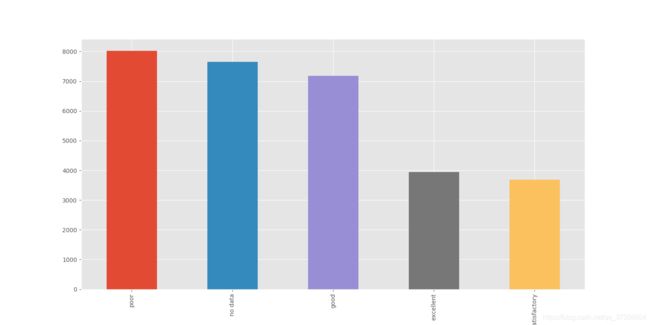
例如,特征生态具有合理的分布。但是如果有一个类别只有一个值叫做“other”,那么它就是一个离群值。
df['ecology'].value_counts().plot.bar()
4.其他技术
许多其他技术也可以发现离群值,比如散点图、z分数和聚类。
虽然异常值不难检测,但我们必须确定正确的解决方案来处理它们。它高度依赖于数据集和项目目标。
处理异常值的方法在某种程度上类似于丢失的数据。我们要么放弃,要么调整,要么保留它们。我们可以返回到遗漏的数据部分以获得可能的解决方案。
3.不必要的数据
在为丢失的数据和异常值做了这么多工作之后,让我们看看不必要的数据,这更简单。
所有输入模型的数据都应该服务于项目的目的。不必要的数据是当数据没有增加价值的时候。由于不同的原因,我们涵盖了三种主要的不必要的数据类型。
不必要数据的类型1:不提供信息/重复
有时,一个特性是无信息性的,因为它有太多行是相同的值。
我们可以创建一个具有相同值的高百分比的特性列表。
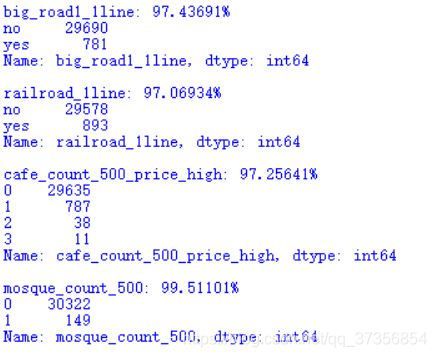
例如,我们在下面指定以显示超过95%观察值的相同值(false/no/0)的特性。
num_rows = len(df.index)#观察值个数
low_information_cols = [] #

for col in df.columns:
    cnts = df[col].value_counts(dropna=False)#no
    top_pct = (cnts/num_rows).iloc[0]

    if top_pct > 0.95:
        low_information_cols.append(col)
        print('{0}: {1:.5f}%'.format(col, top_pct*100))
        print(cnts)
        print()
我们可以逐个研究这些变量,看看它们是否提供了有用的信息。
我们需要了解重复特征背后的原因。当它们真的不能提供信息时,我们可以把它们扔掉。
不必要数据的类型2:不相关
同样,数据需要为项目提供有价值的信息。如果特性与我们试图在项目中解决的问题不相关,那么它们就是不相关的。
我们需要浏览特性来识别不相关的特性。
例如,一个记录多伦多气温的功能并不能提供任何有用的洞见来预测俄罗斯的房价。
当特性不能满足项目目标时,我们可以删除该特征。
不必要数据的类型3:重复的数据
重复数据是指相同观测数据的副本存在。
当观察到的所有特征值都相同时,这种重复就会发生。很容易找到。
我们首先删除数据集中的唯一标识符id。然后我们通过删除重复项来创建一个名为df_dedupped的数据集。我们比较两个数据集(df和df_dedupped)的形状,以找出重复的行数。
类型1:基于特征
df_dedupped = df.drop('id', axis=1).drop_duplicates()

# there were duplicate rows
print(df.shape)
print(df_dedupped.shape)
类型2:基于关键特征
有时,基于一组惟一标识符删除重复的数据会更好。
例如,在相同的面积、相同的价格和相同的构建年份中,两个事务同时发生的几率接近于零。
我们可以设置一组关键特性作为事务的惟一标识符。我们包括时间戳、full_sq、life_sq、楼层、build_year、num_room、price_doc。我们检查是否有重复的基础上。
key = ['timestamp', 'full_sq', 'life_sq', 'floor', 'build_year', 'num_room', 'price_doc']

df.fillna(-999).groupby(key)['id'].count().sort_values(ascending=False).head(20)
我们可以根据关键特性删除这些重复项。
key = ['timestamp', 'full_sq', 'life_sq', 'floor', 'build_year', 'num_room', 'price_doc']
df_dedupped2 = df.drop_duplicates(subset=key)

print(df.shape)
print(df_dedupped2.shape)
4.非一致的数据
让数据集遵循特定的标准来适应模型也是非常重要的。我们需要用不同的方式来探究数据,找出不一致的数据。很多时候,这取决于观察和经验。没有设置代码来运行和修复它们。
不一致的类型1:大小写
在分类值中使用大小写不一致是一个常见的错误。因为Python中的分析是区分大小写的,所以它可能会导致问题。
让我们看看sub_area特性。
df['sub_area'].value_counts(dropna=False)
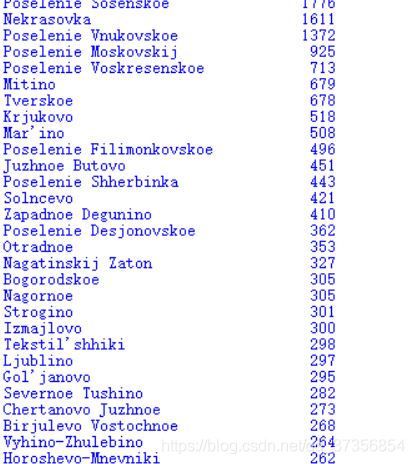
它存储不同区域的名称,并且看起来非常标准化。
但有时在同一功能中存在大小写使用不一致的情况。“Poselenie Sosenskoe”和“Poselenie sosenskeo”可以指同一个区域。
为了避免这种情况,我们可以将所有的字母放在小写字母(或大写字母)中。
df['sub_area_lower'] = df['sub_area'].str.lower()
df['sub_area_lower'].value_counts(dropna=False)
不一致的类型2:格式
我们需要执行的另一个标准化是数据格式。一个例子是将特性从字符串转换为DateTime格式。
特性时间戳是字符串格式的,而它表示日期。
我们可以使用下面的代码转换它并提取日期或时间值。在此之后,可以更容易地分析按年或按月划分的事务量组。
df['timestamp_dt'] = pd.to_datetime(df['timestamp'], format='%Y-%m-%d')
df['year'] = df['timestamp_dt'].dt.year
df['month'] = df['timestamp_dt'].dt.month
df['weekday'] = df['timestamp_dt'].dt.weekday

print(df['year'].value_counts(dropna=False))
print()
print(df['month'].value_counts(dropna=False))
不一致类型3:分类值
不一致的分类值是我们最后讨论的不一致类型。分类特征的值是有限的。有时可能会因为拼写错误等原因而产生其他值。
我们需要观察这个特性来找出这种不一致性。让我们用一个例子来说明这一点。
我们在下面创建一个新的数据集,因为我们在不动产数据集中没有这样的问题。
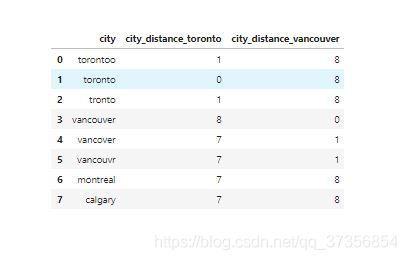
例如,city的值被错误地输入为“torontoo”和“tronto”。但是它们都指向正确的值“toronto”。
识别它们的一个简单方法是模糊逻辑(或编辑距离)。它度量我们需要多少字母(距离)来更改一个值的拼写以匹配另一个值。
我们知道,类别应该只有“多伦多”、“温哥华”、“蒙特利尔”和“卡尔加里”四个值。我们计算所有值与单词“toronto”(和“vancouver”)之间的距离。我们可以看到,可能是拼写错误的单词与正确的单词之间的距离更小。因为它们只相差几个字母。
from nltk.metrics import edit_distance

df_city_ex = pd.DataFrame(data={
     'city': ['torontoo', 'toronto', 'tronto', 'vancouver', 'vancover', 'vancouvr', 'montreal', 'calgary']})


df_city_ex['city_distance_toronto'] = df_city_ex['city'].map(lambda x: edit_distance(x, 'toronto'))
df_city_ex['city_distance_vancouver'] = df_city_ex['city'].map(lambda x: edit_distance(x, 'vancouver'))
df_city_ex
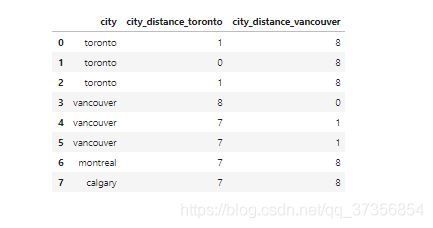
我们可以设置条件将这些拼写转换为正确的值。例如,下面的代码将距离“toronto”两个字母以内的所有值设置为“toronto”。
msk = df_city_ex['city_distance_toronto'] <= 2
df_city_ex.loc[msk, 'city'] = 'toronto'

msk = df_city_ex['city_distance_vancouver'] <= 2
df_city_ex.loc[msk, 'city'] = 'vancouver'

df_city_ex
不一致类型4:地址
地址功能可能会让我们很多人头疼。因为在数据库中输入数据的人通常不遵循标准格式。
我们可以通过查看来找到混乱的地址数据。即使有时我们不能发现任何问题,我们仍然可以运行代码来标准化它们。
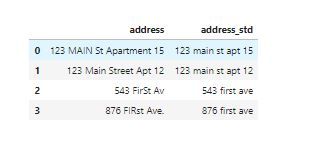
由于隐私原因,我们的数据集中没有地址列。因此,我们创建了一个新的数据集df_add_ex,它具有特征地址。
df_add_ex = pd.DataFrame(['123 MAIN St Apartment 15', '123 Main Street Apt 12   ', '543 FirSt Av', '  876 FIRst Ave.'], columns=['address'])
df_add_ex
正如我们所看到的,地址功能相当混乱。
我们运行以下代码进行小写字母、删除空白、删除句点和标准化改写。
df_add_ex['address_std'] = df_add_ex['address'].str.lower()
df_add_ex['address_std'] = df_add_ex['address_std'].str.strip() # remove leading and trailing whitespace.
df_add_ex['address_std'] = df_add_ex['address_std'].str.replace('\\.', '') # remove period.
df_add_ex['address_std'] = df_add_ex['address_std'].str.replace('\\bstreet\\b', 'st') # replace street with st.
df_add_ex['address_std'] = df_add_ex['address_std'].str.replace('\\bapartment\\b', 'apt') # replace apartment with apt.
df_add_ex['address_std'] = df_add_ex['address_std'].str.replace('\\bav\\b', 'ave') # replace apartment with apt.

df_add_ex
复现文献:
Data Cleaning in Python: the Ultimate Guide (2020)
