- 代码地址:appke/Los-House-Prices: 洛杉矶房价预测
数据的制作
import numpy as np
import matplotlib.pyplot as plt
X=np.arange(0,10,0.1)
X
array([0. , 0.1, 0.2, 0.3, 0.4, 0.5, 0.6, 0.7, 0.8, 0.9, 1. , 1.1, 1.2,
       1.3, 1.4, 1.5, 1.6, 1.7, 1.8, 1.9, 2. , 2.1, 2.2, 2.3, 2.4, 2.5,
       2.6, 2.7, 2.8, 2.9, 3. , 3.1, 3.2, 3.3, 3.4, 3.5, 3.6, 3.7, 3.8,
       3.9, 4. , 4.1, 4.2, 4.3, 4.4, 4.5, 4.6, 4.7, 4.8, 4.9, 5. , 5.1,
       5.2, 5.3, 5.4, 5.5, 5.6, 5.7, 5.8, 5.9, 6. , 6.1, 6.2, 6.3, 6.4,
       6.5, 6.6, 6.7, 6.8, 6.9, 7. , 7.1, 7.2, 7.3, 7.4, 7.5, 7.6, 7.7,
       7.8, 7.9, 8. , 8.1, 8.2, 8.3, 8.4, 8.5, 8.6, 8.7, 8.8, 8.9, 9. ,
       9.1, 9.2, 9.3, 9.4, 9.5, 9.6, 9.7, 9.8, 9.9])
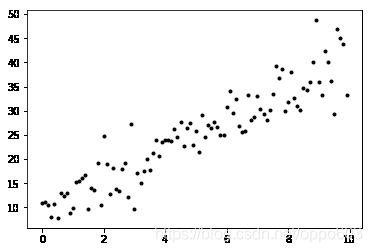
GT=[10+3*x for x in X]
Y=[np.random.normal(z, 3.6) for z in GT]
plt.plot(X, Y, 'k.')
[]

解方程法求解最小二乘
def lsm_func(x,y):
    N=len(x)
    sx=sum(x)
    sy=sum(y)
    sx2=sum(x**2)
    sxy=sum(x*y)
    G=np.mat([[N,sx],[sx,sx2]])
    b=np.array([sy,sxy])
    return np.linalg.solve(G,b)
a0,a1=lsm_func(X,Y)
print(a0,a1)
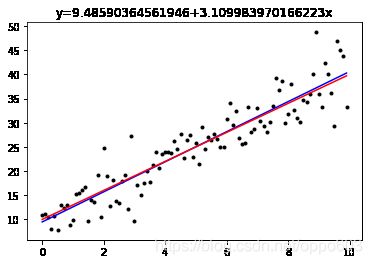
9.48590364561946 3.109983970166223
Y_=[a0+a1*x for x in X]
plt.plot(X,Y,'k.')
plt.plot(X,Y_,'b')
plt.plot(X,GT,'r')
plt.title("y={}+{}x".format(a0,a1))
Text(0.5,1,'y=9.48590364561946+3.109983970166223x')

矩阵方法求解最小二乘
c=np.ones(len(X))
G=np.mat(np.array([c, X]).T)
G.shape
(100, 2)
b=np.mat(Y).T
(G.T*G).I*(G.T)*b
matrix([[9.48590365],
        [3.10998397]])
print(a0,a1)
9.48590364561946 3.109983970166223

