Python 100例(二)
Python 核心12例
1.斐波那契数列
>>> def fibonacci(n):
      a, b = 1, 1
      for _ in range(n):
        yield a
        a, b = b, a+b # 注意这种赋值

>>> for fib in fibonacci(10):
      print(fib)


1
1
2
3
5
8
13
21
34
55
2.list等分n组
>>> from math import ceil
>>> def divide_iter(lst, n):
      if n <= 0:
        yield lst
        return
      i, div = 0, ceil(len(lst) / n)
      while i < n:
        yield lst[i * div: (i + 1) * div]
        i += 1


>>> for group in divide_iter([1,2,3,4,5],2):
      print(group)


[1, 2, 3]
[4, 5]
**3.yield **
- 通常的for…in…循环中,in后面是一个数组,这个数组就是一个可迭代对象,类似的还有链表,字符串,文件。它可以是mylist = [1, 2, 3],也可以是mylist = [x*x for x in range(3)]。 它的缺陷是所有数据都在内存中,如果有海量数据的话将会非常耗内存。
- 生成器是可以迭代的,但只可以读取它一次。因为用的时候才生成。比如 mygenerator = (x*x for x in
range(3)),注意这里用到了(),它就不是数组,而上面的例子是[]。 - 我理解的生成器(generator)能够迭代的关键是它有一个next()方法,工作原理就是通过重复调用next()方法,直到捕获一个异常。可以用上面的mygenerator测试。
- 带有 yield 的函数不再是一个普通函数,而是一个生成器generator,可用于迭代,工作原理同上。
- yield 是一个类似 return 的关键字,迭代一次遇到yield时就返回yield后面的值。重点是:下一次迭代时,从上一次迭代遇到的yield后面的代码开始执行。
- 简要理解:yield就是 return 返回一个值,并且记住这个返回的位置,下次迭代就从这个位置后开始。
- 带有yield的函数不仅仅只用于for循环中,而且可用于某个函数的参数,只要这个函数的参数允许迭代参数。比如array.extend函数,它的原型是array.extend(iterable)。
- send(msg)与next()的区别在于send可以传递参数给yield表达式,这时传递的参数会作为yield表达式的值,而yield的参数是返回给调用者的值。——换句话说,就是send可以强行修改上一个yield表达式值。比如函数中有一个yield赋值,a
= yield 5,第一次迭代到这里会返回5,a还没有赋值。第二次迭代时,使用.send(10),那么,就是强行修改yield 5表达式的值为10,本来是5的,那么a=10 - send(msg)与next()都有返回值,它们的返回值是当前迭代遇到yield时,yield后面表达式的值,其实就是当前迭代中yield后面的参数。
- 第一次调用时必须先next()或send(None),否则会报错,send后之所以为None是因为这时候没有上一个yield(根据第8条)。可以认为,next()等同于send(None)。
第一次yield返回1:
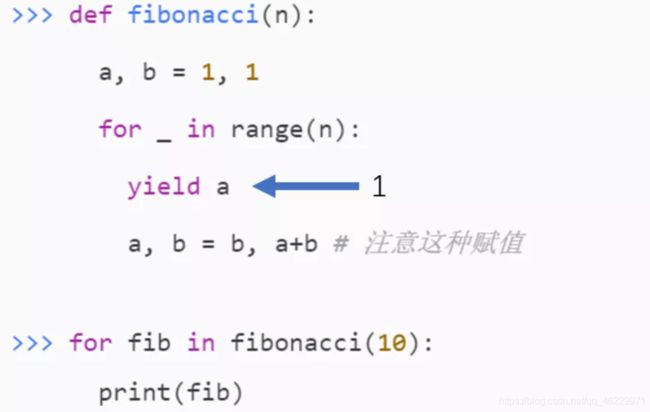
第二次迭代,直接到2的这句代码:

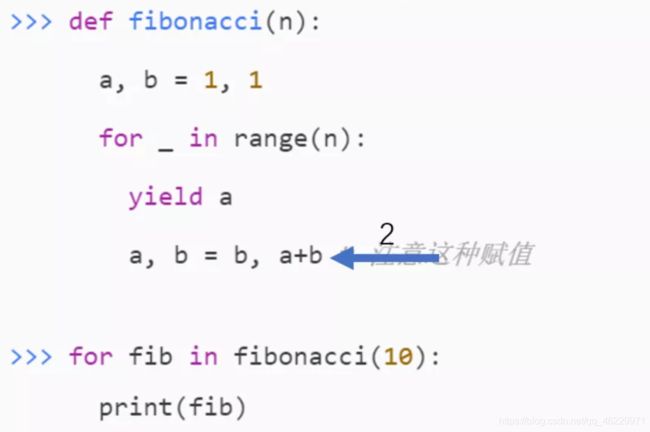
然后再走 for ,再 yield ,重复下去,直到for结束。
4.装饰器
- 定义装饰器
time 模块,第一个导入 wraps 函数(装饰器)为确保被装饰的函数名称等属性不发生改变用。
from functools import wraps
import time
定义一个装饰器:print_info,装饰器函数入参要求为函数,返回值要求也为函数。
如下,入参为函数 f, 返回参数 info 也为函数,满足要求。
def print_info(f):
    """
    @para: f, 入参函数名称
    """
    @wraps(f) # 确保函数f名称等属性不发生改变
    def info():
        print('正在调用函数名称为: %s ' % (f.__name__,))
        t1 = time.time()
        f()
        t2 = time.time()
        delta = (t2 - t1)
        print('%s 函数执行时长为:%f s' % (f.__name__,delta))

    return info
- 使用装饰器
使用 print_info 装饰器,分别修饰 f1, f2 函数:
@print_info
def f1():
    time.sleep(1.0)


@print_info
def f2():
    time.sleep(2.0)
- 使用装饰后的函数
使用f1,f2函数:
f1()
f2()

# 输出信息如下:

# 正在调用函数名称为:f1
# f1 函数执行时长为:1.000000 s
# 正在调用函数名称为:f2
# f2 函数执行时长为:2.000000 s
5.迭代器案例
一个类成为迭代器类型,必须实现两个方法:_ iter_,next
下面编写一个迭代器类:
class YourRange():
    def __init__(self, start, end):
        self.value = start
        self.end = end

    # 成为迭代器类型的关键协议
    def __iter__(self):
        return self

    # 当前迭代器状态(位置)的下一个位置
    def __next__(self):
        if self.value >= self.end:
            raise StopIteration

        cur = self.value
        self.value += 1
        return cur
使用这个迭代器:
yr = YourRange(5, 12)
for e in yr:
    print(e)
迭代器实现__iter__ 协议,它就能在 for 上迭代
问题:如果此时运行:next(yr)会输出5还是报错?
如果 yr 是 list,for 遍历后,再 next(iter(yr)) 又会输出什么?
下面使用 4 种常见的绘图库绘制柱状图和折线图,使用尽可能最少的代码绘制
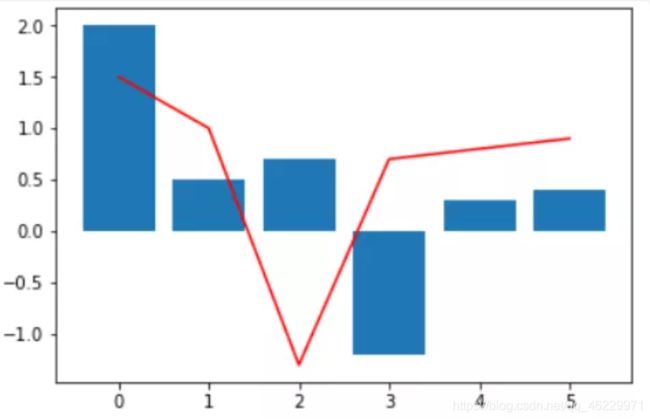
1.matplotlib
导入包:
import matplotlib
matplotlib.__version__  # '2.2.2'

import matplotlib.pyplot as plt
``
绘图代码:

```python
import matplotlib.pyplot as plt
plt.plot([0, 1, 2, 3, 4, 5],
        [1.5, 1, -1.3, 0.7, 0.8, 0.9]
        ,c='red')
plt.bar([0, 1, 2, 3, 4, 5],
        [2, 0.5, 0.7, -1.2, 0.3, 0.4]
        )
plt.show()
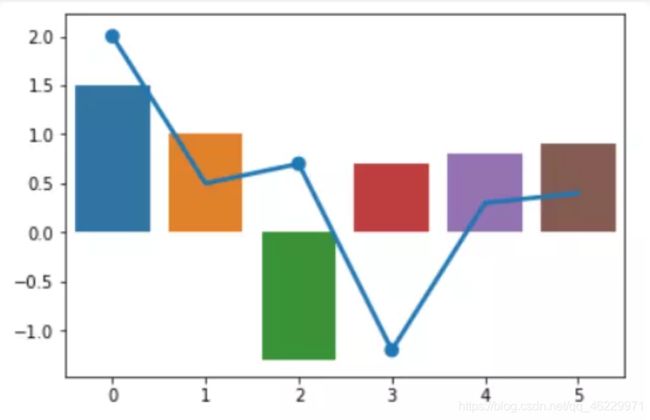
import seaborn as sns
sns.__version__ # '0.8.0'
绘图:
sns.barplot([0, 1, 2, 3, 4, 5],
        [1.5, 1, -1.3, 0.7, 0.8, 0.9]
        )
sns.pointplot([0, 1, 2, 3, 4, 5],
        [2, 0.5, 0.7, -1.2, 0.3, 0.4]
        )
plt.show()
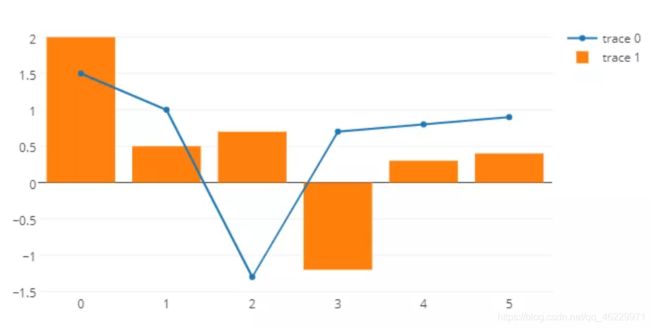
import plotly
plotly.__version__ # '2.0.11'
绘图(自动打开html):
import plotly.graph_objs as go
import plotly.offline as offline

pyplt = offline.plot
sca = go.Scatter(x=[0, 1, 2, 3, 4, 5],
             y=[1.5, 1, -1.3, 0.7, 0.8, 0.9]
            )
bar = go.Bar(x=[0, 1, 2, 3, 4, 5],
            y=[2, 0.5, 0.7, -1.2, 0.3, 0.4]
            )
fig = go.Figure(data = [sca,bar])
pyplt(fig)
import pyecharts
pyecharts.__version__ # '1.7.1'
绘图(自动打开html)
bar = (
        Bar()
        .add_xaxis([0, 1, 2, 3, 4, 5])
        .add_yaxis('ybar',[1.5, 1, -1.3, 0.7, 0.8, 0.9])
    )
line = (Line()
        .add_xaxis([0, 1, 2, 3, 4, 5])
        .add_yaxis('yline',[2, 0.5, 0.7, -1.2, 0.3, 0.4])
        )
bar.overlap(line)
bar.render_notebook()
matplotlib 绘制三维 3D 图形的方法,主要锁定在绘制 3D 曲面图和等高线图。
