数据大屏可视化2-超全的基础图形模板(基础模版)
内容整理于网络,因为忘了之前是从那几篇文章中整理的了,所以转载的连接不知道填啥,如果作者有看到的话,可以联系下我,谢谢
注意:所有带有import random的都是生成随机数展示的,如果有需要研究对应的数据格式改回
数据大屏可视化1-pyecharts库说明(python)
数据大屏可视化2-超全的基础图形模板(基础模版)
数据大屏可视化3-通用数据大屏模版
一、柱状图
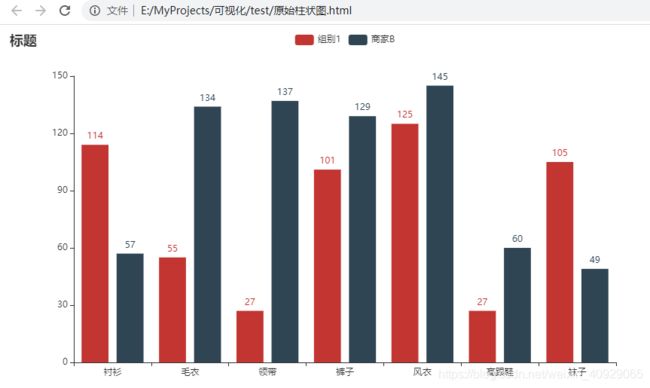
原始柱状图
from pyecharts.charts import Bar
from pyecharts import options as opts
# V1 版本开始支持链式调用
bar = (
    Bar()
    .add_xaxis(["衬衫", "毛衣", "领带", "裤子", "风衣", "高跟鞋", "袜子"])
    .add_yaxis("商家A", [114, 55, 27, 101, 125, 27, 105])
    .add_yaxis("商家B", [57, 134, 137, 129, 145, 60, 49])
    .set_global_opts(title_opts=opts.TitleOpts(title="某商场销售情况"))
)
bar.render('E:\MyProjects\可视化\原始柱状图.html')
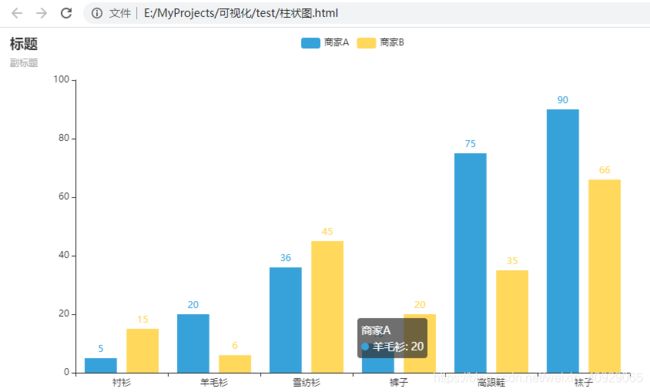
from pyecharts.charts import Bar
from pyecharts import options as opts
# 条形图
from pyecharts.globals import ThemeType
bar = (
    Bar(
        init_opts=opts.InitOpts(theme=ThemeType.LIGHT))
        .add_xaxis(["衬衫", "羊毛衫", "雪纺衫", "裤子", "高跟鞋", "袜子"])
        .add_yaxis("商家A", [5, 20, 36, 10, 75, 90])
        .add_yaxis("商家B", [15, 6, 45, 20, 35, 66])
        .set_global_opts(title_opts=opts.TitleOpts (title="商家销售情况", subtitle="商家对比"))
)
bar.render('E:\MyProjects\可视化\柱状图.html')
from pyecharts.charts import Bar
from pyecharts import options as opts
# 基础数据
xray = ["衬衫", "羊毛衫", "雪纺衫", "裤子", "高跟鞋", "袜子"] # x轴数据
y1 =   [114, 55, 27, 101, 125, 27]
y2 =  [57, 134, 137, 129, 145, 60]
bar = Bar()
bar.add_xaxis(xray)
bar.add_yaxis("S1",y1)
bar.add_yaxis("S2",y2)
bar.set_global_opts(title_opts=opts.TitleOpts(title="Bar-datazoom)")
                   ,datazoom_opts = opts.DataZoomOpts(type_ = "inside"))
bar.set_series_opts(
    label_opts = opts.LabelOpts(is_show = False)
    ,markpoint_opts = opts.MarkPointOpts(data = [opts.MarkPointItem(type_ = "max",name = "max")
                                                ,opts.MarkPointItem(name = "min",type_ = "min")] # 这里需要注意data是一个系列,就算只有一个也是必须做list处理
                                                )
    ,markline_opts = opts.MarkLineOpts(data = [opts.MarkLineItem(name = "average",type_ = "average")]))
# bar.render_notebook()
bar.render('E:\MyProjects\可视化\柱状图特殊标记.html')
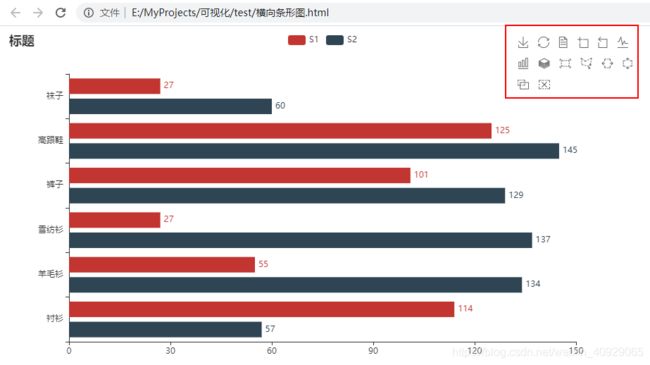
from pyecharts.charts import Bar
from pyecharts import options as opts
# 基础数据
xray = ["衬衫", "羊毛衫", "雪纺衫", "裤子", "高跟鞋", "袜子"] # x轴数据
y1 =   [114, 55, 27, 101, 125, 27]
y2 =  [57, 134, 137, 129, 145, 60]
# y轴数据 ,无法直接使用numpy对象,转为list进行处理
bar = Bar()
bar.add_xaxis(xray)
bar.add_yaxis("S1",y1)
bar.add_yaxis("S2",y2)
bar.reversal_axis()
bar.set_global_opts(title_opts=opts.TitleOpts("rever")
                   ,toolbox_opts = opts.ToolboxOpts(is_show = True))
bar.set_series_opts(label_opts=opts.LabelOpts(position = "right"))
# bar.render_notebook()
bar.render('E:\MyProjects\可视化\横向条形图.html')
# import random
from pyecharts import options as opts
from pyecharts.charts import Bar, Timeline
from pyecharts.globals import ThemeType
# 示例数据
tl = Timeline()
cate = ['Apple', 'Huawei', 'Xiaomi', 'Oppo', 'Vivo', 'Meizu']
bar = (
        Bar()
        .add_xaxis(cate)
        .add_yaxis("线上", [63, 77, 58, 62, 105, 134])
        .add_yaxis("门店", [133, 174, 115, 163, 131, 167])
        .set_global_opts(title_opts=opts.TitleOpts("手机品牌{}年营业额".format(2015)))
    )
tl.add(bar, "{}年".format(2015))
bar = (
        Bar()
        .add_xaxis(cate)
        .add_yaxis("线上", [66, 109, 147, 131, 61, 146])
        .add_yaxis("门店", [110, 117, 144, 134, 104, 105])
        .set_global_opts(title_opts=opts.TitleOpts("手机品牌{}年营业额".format(2016)))
    )
tl.add(bar, "{}年".format(2016))
bar = (
        Bar()
        .add_xaxis(cate)
        .add_yaxis("线上",[97, 98, 140, 85, 61, 99])
        .add_yaxis("门店",[194, 120, 176, 124, 128, 192])
        .set_global_opts(title_opts=opts.TitleOpts("手机品牌{}年营业额".format(2017)))
    )
tl.add(bar, "{}年".format(2017))
bar = (
        Bar()
        .add_xaxis(cate)
        .add_yaxis("线上",[124, 104, 105, 52, 78, 62])
        .add_yaxis("门店",[157, 107, 161, 184, 124, 142])
        .set_global_opts(title_opts=opts.TitleOpts("手机品牌{}年营业额".format(2018)))
    )
tl.add(bar, "{}年".format(2018))
bar = (
        Bar()
        .add_xaxis(cate)
        .add_yaxis("线上",[140, 60, 65, 121, 110, 105])
        .add_yaxis("门店",[111, 117, 182, 156, 108, 131])
        .set_global_opts(title_opts=opts.TitleOpts("手机品牌{}年营业额".format(2019)))
    )
tl.add(bar, "{}年".format(2019))
tl.render('时间轴柱状图.html')
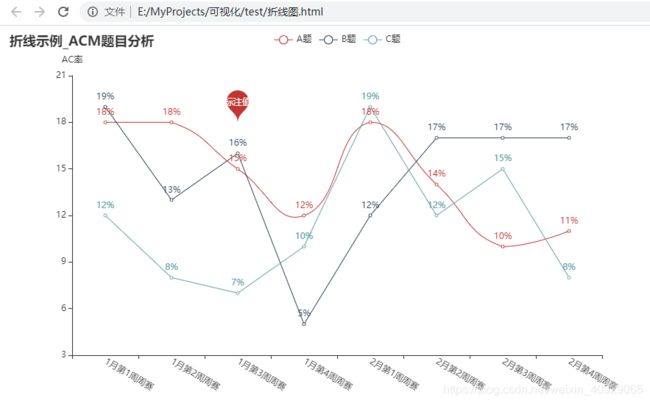
import random
import pyecharts.options as opts
from pyecharts.charts import Line
from pyecharts.commons.utils import JsCode
line = (
    Line()
    .add_xaxis(['{}月第{}周周赛'.format(y,z)
                     for y in range(1, 3)  # 1、2月
                         for z in range(1, 5)])  # 1-4周
    .add_yaxis('A题', [random.randint(10, 20) for _ in range(8)],
               is_smooth=True, # 平滑
               markpoint_opts=opts.MarkPointOpts(
                           # 使用coord这个属性设置自定义标记点数值,我这儿随便写
                           data=[opts.MarkPointItem(name='自定义标记点',coord=[2,18],value='标注值')]
                       )
               )
    .add_yaxis('B题', [random.randint(5, 20) for _ in range(8)])
    .add_yaxis('C题', [random.randint(5, 20) for _ in range(8)])
    .set_series_opts(label_opts=opts.LabelOpts(
                    formatter=JsCode( # 通过定义JavaScript回调函数自定义标签
                         "function(params){"
                                "return params.value[1].toString() + '%';}"  # 外层单引号内存双引号亲测不行!
                    )
                ))
    .set_global_opts(xaxis_opts=opts.AxisOpts(axislabel_opts=opts.LabelOpts(rotate=-30)), # 设置x轴标签旋转角度
                     yaxis_opts=opts.AxisOpts(name='AC率', min_=3),
                     title_opts=opts.TitleOpts(title='折线示例_ACM题目分析'))
    )
line.render('E:\MyProjects\可视化\折线图.html')
import pyecharts.options as opts
from pyecharts.charts import Line,Timeline
from pyecharts.commons.utils import JsCode
tl = Timeline()
#如果静态显示一个折线图数据,到tl前为止格式即可line.render()
line = (
    Line()
    .add_xaxis(['1月1周周销','1月2周周销','1月3周周销','1月4周周销'])
    .add_yaxis('A店',[11,15,12,13])#,is_smooth=True,markpoint_opts=opts.MarkPointOpts(data=[opts.MarkPointItem(name='自定义标记点',coord=[2,18],value='平滑')))
    .add_yaxis('B店',[17,17,18,19],is_smooth=True,markpoint_opts=opts.MarkPointOpts(data=[opts.MarkPointItem(name='自定义标记点',coord=[2,18],value='平滑')]))
    .set_series_opts(label_opts=opts.LabelOpts(
                    formatter=JsCode( # 通过定义JavaScript回调函数自定义标签
                         "function(params){"
                                "return params.value[1].toString() + '%';}"  # 外层单引号内存双引号亲测不行!
                    )
                ))
    .set_global_opts(xaxis_opts=opts.AxisOpts(axislabel_opts=opts.LabelOpts(rotate=-30)), # 设置x轴标签旋转角度
                     yaxis_opts=opts.AxisOpts(name='Y轴-周销售额', min_=3),
                     title_opts=opts.TitleOpts(title='标题-门店周销售额动态显示'.format(1)))
)
tl.add(line, "2020年{}月".format(1))
line = (
    Line()
    .add_xaxis(['1月1周周销','1月2周周销','1月3周周销','1月4周周销','2月1周周销','2月2周周销','2月3周周销','2月4周周销'])
    .add_yaxis('A店',[11,15,12,13,17,15,12,15])
    .add_yaxis('B店',[17,17,18,19,16,17,18,17])
    .set_series_opts(label_opts=opts.LabelOpts(
                    formatter=JsCode( # 通过定义JavaScript回调函数自定义标签
                         "function(params){"
                                "return params.value[1].toString() + '%';}"  # 外层单引号内存双引号亲测不行!
                    )
                ))
    .set_global_opts(xaxis_opts=opts.AxisOpts(axislabel_opts=opts.LabelOpts(rotate=-30)), # 设置x轴标签旋转角度
                     yaxis_opts=opts.AxisOpts(name='Y轴-周销售额', min_=3),
                     title_opts=opts.TitleOpts(title='标题-门店周销售额动态显示'.format(2)))
)
tl.add(line, "2020年1月-{}月".format(2))
line = (
    Line()
    .add_xaxis(['1月1周周销','1月2周周销','1月3周周销','1月4周周销','2月1周周销','2月2周周销','2月3周周销','2月4周周销','3月1周周销','3月2周周销','3月3周周销','3月4周周销'])
    .add_yaxis('A店',[11,15,12,13,17,15,12,15,10,13,15,17])
    .add_yaxis('B店',[17,17,18,19,16,17,18,17,20,17,18,16])
    .set_series_opts(label_opts=opts.LabelOpts(
                    formatter=JsCode( # 通过定义JavaScript回调函数自定义标签
                         "function(params){"
                                "return params.value[1].toString() + '%';}"  # 外层单引号内存双引号亲测不行!
                    )
                ))
    .set_global_opts(xaxis_opts=opts.AxisOpts(axislabel_opts=opts.LabelOpts(rotate=-30)), # 设置x轴标签旋转角度
                     yaxis_opts=opts.AxisOpts(name='Y轴-周销售额', min_=3),
                     title_opts=opts.TitleOpts(title='标题-门店周销售额动态显示'.format(3)))
)
tl.add(line, "2020年1月-{}月".format(3))
tl.render('时间轴折线图.html')
import random
import pyecharts.options as opts
from pyecharts.charts import Line
from pyecharts.commons.utils import JsCode

line = (
    Line()
    .add_xaxis(['{}月第{}周周赛'.format(y,z)
                     for y in range(1, 3)  # 1、2月
                         for z in range(1, 5)])  # 1-4周
    .add_yaxis('蔡队',
               [random.randint(10, 20) for _ in range(8)],
               is_symbol_show=False,
               areastyle_opts=opts.AreaStyleOpts(opacity=0.5),
               markpoint_opts=opts.MarkPointOpts(data=[opts.MarkPointItem(type_='average', name='均值'),
                                                   opts.MarkPointItem(type_='max', name='最大值'),
                                                   opts.MarkPointItem(type_='min', name='最小值')],
                                                   symbol_size=50)
               )
    .add_yaxis('旺神',
               [random.randint(6, 20) for _ in range(8)],
               is_smooth=True,
               is_symbol_show=False,
               areastyle_opts=opts.AreaStyleOpts(opacity=0.5)
               )
    .set_global_opts(xaxis_opts=opts.AxisOpts(axislabel_opts=opts.LabelOpts(rotate=-30)), # 设置x轴标签旋转角度
                     yaxis_opts=opts.AxisOpts(name='完成积分', min_=5),
                     title_opts=opts.TitleOpts(title='折线面积图示例_周赛分析'))
    )

line.render('E:\MyProjects\可视化\折线面积图.html')
from pyecharts.charts import Bar,Grid,Line
from pyecharts import options as opts
from pyecharts.globals import ThemeType
x_data = ["{}月".format(i) for i in range(1, 13)]
zengfaliang =  [2.0, 4.9, 7.0, 23.2, 25.6, 76.7, 135.6, 162.2, 32.6, 20.0, 6.4, 3.3]
jiangshuiliang = [2.6, 5.9, 9.0, 26.4, 28.7, 70.7, 175.6, 182.2, 48.7, 18.8, 6.0, 2.3]
average_wendu = [2.0, 2.2, 3.3, 4.5, 6.3, 10.2, 20.3, 23.4, 23.0, 16.5, 12.0, 6.2]
grid = Grid()
bar = Bar()
grid.theme = ThemeType.PURPLE_PASSION
line = Line()
bar.add_xaxis(x_data)
bar.add_yaxis("蒸发量",zengfaliang)
bar.add_yaxis("降水量",jiangshuiliang)
bar.set_global_opts(title_opts=opts.TitleOpts("Grid-多Y轴展示")
                   ,tooltip_opts=opts.TooltipOpts(trigger="axis", axis_pointer_type="cross") # 交叉指向工具
                   )
bar.extend_axis(yaxis=opts.AxisOpts(type_="value",
                                     name="温度",
                                     min_=0,
                                     max_=25,
                                     position="right",
                                     axislabel_opts=opts.LabelOpts(formatter="{value} °C"),
                                     ))
# 在bar上增加Y轴,在line图上选择对应的轴向
line.add_xaxis(x_data)
line.add_yaxis("平均温度",average_wendu,yaxis_index = 1)
# 把line添加到bar上
bar.overlap(line)
# 这里如果不需要grid也可以,直接设置bar的格式,然后显示bar即可
#bar.render_notebook()
grid.add(chart = bar,grid_opts = opts.GridOpts(),is_control_axis_index = True)
# grid.render_notebook()
grid.render('E:\MyProjects\可视化\多轴展示.html')
import random
from pyecharts import options as opts
from pyecharts.charts import Page, Pie
pie = (
    Pie()
    .add('鼠标选中分区后的tip',
         [list(z) for z in zip(['20{}年第{}季'.format(year,season)
                                        for year in [19, 20]  # count 2
                                                for season in range(1,5)] # count 2
                ,[random.randint(2, 10) for _ in range(8)])]) # count 8
    .set_series_opts(label_opts=opts.LabelOpts(formatter='{b}: {c}万套'))
    .set_global_opts(title_opts=opts.TitleOpts(title='饼图实例-近两年季度销售'),
                         legend_opts=opts.LegendOpts(is_show=False))
)
pie.render('E:\MyProjects\可视化\饼图.html')
import random
from pyecharts import options as opts
from pyecharts.charts import Pie
pie = (
    Pie()
    .add(
        '鼠标选中分区后的tip',
        [list(z) for z in zip(['20{}年第{}季'.format(year,season)
                                    for year in [19, 20]  # count 2
                                            for season in range(1,5)] # count 2
            ,[random.randint(2, 10) for _ in range(8)])],
        radius=['50%', '75%'],          #设置内径外径
        label_opts=opts.LabelOpts(is_show=True)
    )
    .set_global_opts(title_opts=opts.TitleOpts(title='圆环图示例-近两年季度销售'),
                     legend_opts=opts.LegendOpts(is_show=False))
)
pie.render('E:\MyProjects\可视化\环形图.html')
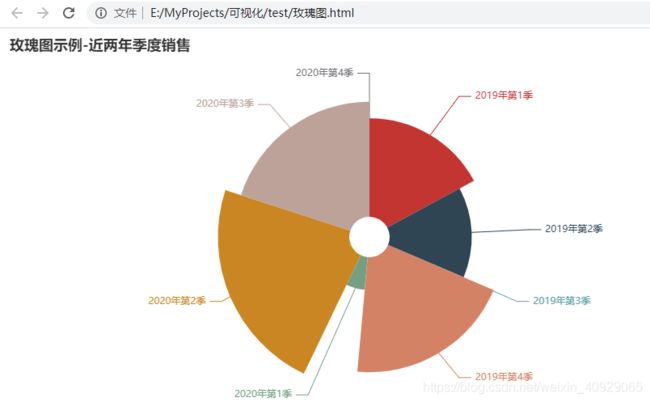
import random
from pyecharts import options as opts
from pyecharts.charts import Pie
pie = (
    Pie()
    .add(
        '鼠标选中分区后的tip',
        [list(z) for z in zip(['20{}年第{}季'.format(year,season)
                                    for year in [19, 20]  # count 2
                                            for season in range(1,5)] # count 2
            ,[random.randint(0, 10) for _ in range(8)])],
        radius=['10%', '75%'],          #设置内径外径
        # rosetype='radius' 圆心角展现数据百分比,半径展现数据大小
        # rosetype='area' 圆心角相同,为通过半径展现数据大小
        rosetype='radius',
        label_opts=opts.LabelOpts(is_show=True)
    )
    .set_global_opts(title_opts=opts.TitleOpts(title='玫瑰图示例-近两年季度销售'),
                     legend_opts=opts.LegendOpts(is_show=False))
)
pie.render('E:\MyProjects\可视化\玫瑰图.html')
from pyecharts.charts import Funnel
from pyecharts import options as opts

# 示例数据
cate = ['访问', '注册', '加入购物车', '提交订单', '付款成功']
data = [30398, 15230, 10045, 8109, 5698]
"""
漏斗图示例:
1. sort_控制排序,默认降序;
2. 标签显示位置
"""
funnel = (Funnel()
          .add("用户数", [list(z) for z in zip(cate, data)],
               sort_='ascending',
               label_opts=opts.LabelOpts(position="inside"))
          .set_global_opts(title_opts=opts.TitleOpts(title="Funnel-基本示例", subtitle="我是副标题"))
         )

funnel.render_notebook()
funnel.render('漏斗图.html')
from pyecharts.charts import HeatMap
from pyecharts import options as opts
from pyecharts.faker import Faker
import random
# 示例数据
data = [[i, j, random.randint(0, 50)] for i in range(24) for j in range(7)]
heat = (HeatMap()
        .add_xaxis(Faker.clock)
        .add_yaxis("访客数",
                   Faker.week,
                   data,
                   label_opts=opts.LabelOpts(is_show=True, position="inside"))
        .set_global_opts(
            title_opts=opts.TitleOpts(title="HeatMap-基本示例", subtitle="我是副标题"),
            visualmap_opts=opts.VisualMapOpts(),
            legend_opts=opts.LegendOpts(is_show=False))
       )
#heat.render_notebook()
heat.render('热力图.html')
from pyecharts import options as opts
from pyecharts.charts import Page, Radar
#雷达图
v1 = [[4300, 10000, 28000, 35000, 50000, 19000]]
v2 = [[5000, 14000, 28000, 31000, 42000, 21000]]
def radar_base() -> Radar:
    c = (
        Radar()
            .add_schema(
            schema=[
                opts.RadarIndicatorItem(name="销售", max_=6500),
                opts.RadarIndicatorItem(name="管理", max_=16000),
                opts.RadarIndicatorItem(name="信息技术", max_=30000),
                opts.RadarIndicatorItem(name="客服", max_=38000),
                opts.RadarIndicatorItem(name="研发", max_=52000),
                opts.RadarIndicatorItem(name="市场", max_=25000),
            ]
        )
            .add("预算分配", v1)
            .add("实际开销", v2)
            .set_series_opts(label_opts=opts.LabelOpts(is_show=False))
            .set_global_opts(title_opts=opts.TitleOpts(title="部门开销"))
    )
    return c
c = radar_base()
c.render('E:\MyProjects\可视化\雷达图.html')
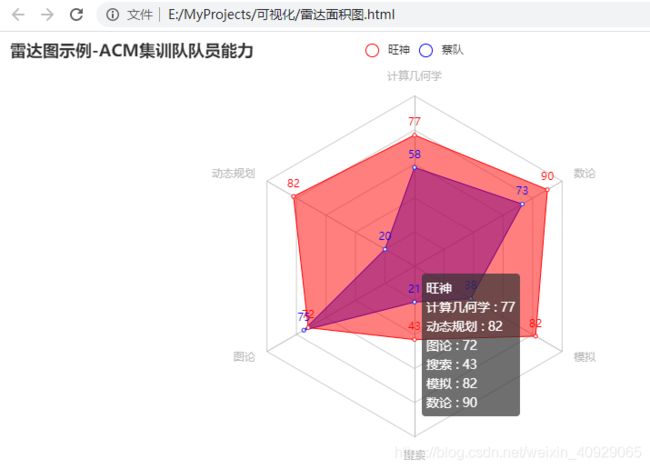
import random
from pyecharts import options as opts
from pyecharts.charts import Page, Radar
def radar_simple() -> Radar:
    c = (
        Radar()
        .add_schema(
            # 各项的max_值可以不同
            schema=[
                opts.RadarIndicatorItem(name='计算几何学', max_=100),
                opts.RadarIndicatorItem(name='动态规划', max_=100),
                opts.RadarIndicatorItem(name='图论', max_=100),
                opts.RadarIndicatorItem(name='搜索', max_=100),
                opts.RadarIndicatorItem(name='模拟', max_=100),
                opts.RadarIndicatorItem(name='数论', max_=100),
            ]
        )
        .add('旺神', [[random.randint(10, 101) for _ in range(6)]],
             color='red',
             areastyle_opts = opts.AreaStyleOpts(  #设置填充的属性
                 opacity = 0.5,
                 color='red'
         ),)
        .add('蔡队', [[random.randint(10, 101) for _ in range(6)]],
             color='blue',
             areastyle_opts = opts.AreaStyleOpts(
                 opacity = 0.5,#透明度
                 color='blue'
         ),)
        .set_series_opts(label_opts=opts.LabelOpts(is_show=True))
        .set_global_opts(title_opts=opts.TitleOpts(title='雷达图示例-ACM集训队队员能力'))
    )
    return c
radar_simple().render('雷达面积图.html')
from pyecharts.charts import Scatter
from pyecharts import options as opts
from pyecharts.commons.utils import JsCode
import pandas as pd

def scatter_simple() -> Scatter:
    # 数据源
    df = pd.DataFrame({
     'AC':[21,22,23,24,28,30,34,35,40,44,45],  # 刷题数
                       'ACB':[140,120,380,120,200,190,160,300,300,400,500],
                       '姓名':['小军','NIL','假冒NOI','小白','弱刚','晓雷','窜天','云云','依图','蔡队','旺神',]})
    # inplace=True:不创建新的对象,直接对原始对象进行修改
    # 升序
    df.sort_values('AC', inplace=True, ascending=True)

    c = (
        Scatter()
        .add_xaxis(df.AC.values.tolist())
        .add_yaxis(
            '刷题_能力_姓名',
            df[['ACB','姓名']].values.tolist(),
            label_opts=opts.LabelOpts(
                formatter=JsCode(
                    'function(params){return params.value[2];}' #通过定义JavaScript回调函数自定义标签
                )
            )
        )
        .set_global_opts(
            title_opts=opts.TitleOpts(title='散点图示例--ACM集训队队员能力'),
            xaxis_opts=opts.AxisOpts(name='AC(刷题数)', type_='value', min_=20),  #x轴从20开始,原点不为0
            yaxis_opts=opts.AxisOpts(name='ACB(能力值)', min_=100),  # y轴起始点的值
            legend_opts=opts.LegendOpts(is_show=True)
        )
    )
    return c
scatter_simple().render('E:\MyProjects\可视化\散点图.html')
from pyecharts import options as opts
from pyecharts.charts import Boxplot
def boxpolt_base() -> Boxplot:
    v_sophomore = [
        [1.1, 2.2, 2.6, 3.2, 3.7, 4.2, 4.7, 4.7, 5.5, 6.3, 8.0],
        [2.5, 2.5, 2.8, 3.2, 3.7, 4.2, 4.7, 4.7, 5.5, 6.3, 7.0]
    ]
    v_junior = [
        [3.6, 3.7, 4.7, 4.9, 5.1, 5.2, 5.3, 5.4, 5.7, 5.8, 5.8],
        [3.6, 3.7, 4.7, 4.9, 5.1, 5.2, 5.3, 5.4, 5.7, 5.8, 5.8]
    ]
    # 最小值,下四分位数,中位数、上四分位数、最大值
    # [min, Q1, median (or Q2), Q3, max]
    c = (
        Boxplot()
        .add_xaxis(['寒假作业','暑假作业'])
        .add_yaxis('大二队员', Boxplot.prepare_data(v_sophomore))
        .add_yaxis('大三队员', Boxplot.prepare_data(v_junior))
        .set_series_opts(label_opts=opts.LabelOpts(is_show=True))
        .set_global_opts(title_opts=opts.TitleOpts(title='ACM集训队祖传练习完成时长离散度'),
                         xaxis_opts=opts.AxisOpts(name='单位:小时'),
                         legend_opts=opts.LegendOpts(is_show=True))
        .reversal_axis() #翻转XY轴
    )
    return c

boxpolt_base().render('箱线图.html')
from pyecharts import options as opts
from pyecharts.charts import WordCloud
from pyecharts.globals import SymbolType

words = [
    ('背包问题', 10000),
    ('大整数', 6181),
    ('Karatsuba乘法算法', 4386),
    ('穷举搜索', 4055),
    ('傅里叶变换', 2467),
    ('状态树遍历', 2244),
    ('剪枝', 1868),
    ('Gale-shapley', 1484),
    ('最大匹配与匈牙利算法', 1112),
    ('线索模型', 865),
    ('关键路径算法', 847),
    ('最小二乘法曲线拟合', 582),
    ('二分逼近法', 555),
    ('牛顿迭代法', 550),
    ('Bresenham算法', 462),
    ('粒子群优化', 366),
    ('Dijkstra', 360),
    ('A*算法', 282),
    ('负极大极搜索算法', 273),
    ('估值函数', 265)
]
def wordcloud_base() -> WordCloud:
    c = (
        WordCloud()
        .add("", words, word_size_range=[20, 100], shape=SymbolType.ROUND_RECT)
        .set_global_opts(title_opts=opts.TitleOpts(title='WordCloud示例-OJ搜索关键字'))
    )
    return c
wordcloud_base().render('词云图.html')
from pyecharts.charts import Calendar
from pyecharts import options as opts
import random
import datetime
# 示例数据
begin = datetime.date(2019, 1, 1)
end = datetime.date(2019, 12, 31)
data = [[str(begin + datetime.timedelta(days=i)), random.randint(1000, 25000)]
        for i in range((end - begin).days + 1)]
"""
日历图示例:
"""
calendar = (
        Calendar()
        .add("微信步数", data, calendar_opts=opts.CalendarOpts(range_="2019"))
        .set_global_opts(
            title_opts=opts.TitleOpts(title="Calendar-基本示例", subtitle="我是副标题"),
            legend_opts=opts.LegendOpts(is_show=False),
            visualmap_opts=opts.VisualMapOpts(
                max_=25000,
                min_=1000,
                orient="horizontal",
                is_piecewise=True,
                pos_top="230px",
                pos_left="100px",
            )
        )
    )

calendar.render_notebook()
calendar.render('日历数据图.html')
from pyecharts import options as opts
from pyecharts.charts import Map
import random
province = ['广东', '湖北', '湖南', '四川', '重庆', '黑龙江', '浙江', '山西', '河北', '安徽', '河南', '山东', '西藏']
data = [(i, random.randint(50, 150)) for i in province]
_map = (
        Map()
        .add("销售额", data, "china")
        .set_global_opts(
            title_opts=opts.TitleOpts(title="Map-基本示例"),
            legend_opts=opts.LegendOpts(is_show=False),
            visualmap_opts=opts.VisualMapOpts(max_=200, is_piecewise=True),
        )
    )

_map.render_notebook()
_map.render('地理数据图.html')
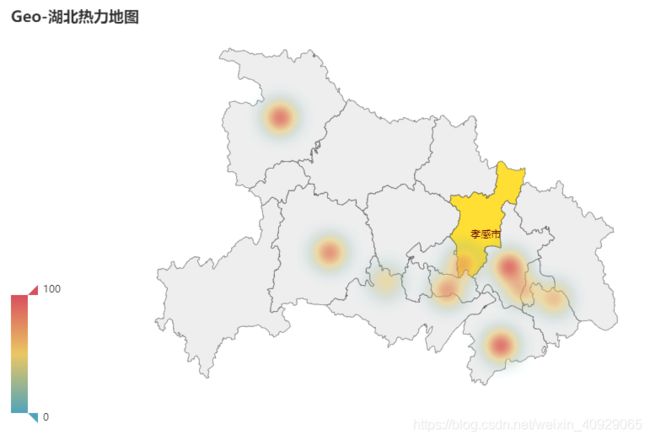
from pyecharts import options as opts
from pyecharts.charts import Geo
from pyecharts.globals import ChartType
import random
province = ['武汉', '十堰', '鄂州', '宜昌', '荆州', '孝感', '黄石', '咸宁', '仙桃']
data = [(i, random.randint(50, 150)) for i in province]
geo = (Geo().
        add_schema(maptype="湖北")
        .add("门店数", data,type_=ChartType.HEATMAP)
        .set_series_opts(label_opts=opts.LabelOpts(is_show=False))
        .set_global_opts(
            visualmap_opts=opts.VisualMapOpts(),
            legend_opts=opts.LegendOpts(is_show=False),
            title_opts=opts.TitleOpts(title="Geo-湖北热力地图"))
      )
geo.render_notebook()
geo.render('地理热力图.html')
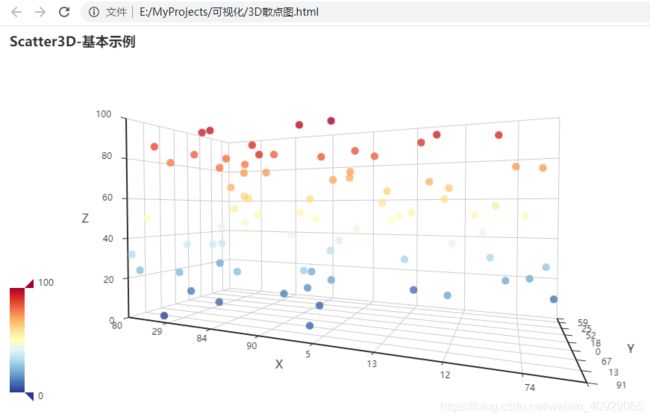
from pyecharts import options as opts
from pyecharts.charts import Scatter3D
from pyecharts.faker import Faker
import random
data = [(random.randint(0, 100), random.randint(0, 100), random.randint(0, 100))
        for _ in range(80)]
scatter3D = (Scatter3D()
             .add("", data)
             .set_global_opts(
                 title_opts=opts.TitleOpts("Scatter3D-基本示例"),
                 visualmap_opts=opts.VisualMapOpts(range_color=Faker.visual_color))
            )
scatter3D.render_notebook()
scatter3D.render('3D散点图.html')
