【基础教程】渗流理论【含Matlab源码 189期】
一、源代码
%%%This Shows The Precolation vs ocupency for all square matrix upto n
%%it will go through all permibility values from 0 to 1 and plot
%%percoaltion vs ocuupency for a perticular
%only edit n
n=6;
%%


k=0;
p=0:0.01:1;
cycle=20;
temp =size(p);
iter=temp(2);

storageall10p=zeros(iter,n);
storageall10o=zeros(iter,n);


for iter=1:iter
percolated=0;
occu_avg=0;

for cyc= 1:cycle
A=randsrc(n,n,[0 1;(1-p(iter)) p(iter)]);

B=zeros(n,n);
% figure;
% cmap = [1,1,0;0,1,1];
% colormap(cmap);
% set(gcf,'Position', [0 0 n*100 n*100])
% imagesc(A);
% colorbar;

p_count = 0;

  for j=1:n
       if  A(1,j)==1
       p_count= count(A,1,j,n,n,0,B);
       if p_count==1
           break
       end
       end

  end
  if p_count>0
    percolated=percolated+1;
  end
  occu_avg=sum(A(:))/(n*n)+occu_avg;

%   caption = sprintf('Percolation paths = %d %%, Occupancy = %d %% ', p_count,occu_per);
%  title(caption);
% pause(1)

end

storageall10p(iter,n)=percolated*100/cycle;
storageall10o(iter,n)=occu_avg*100/cycle;

end

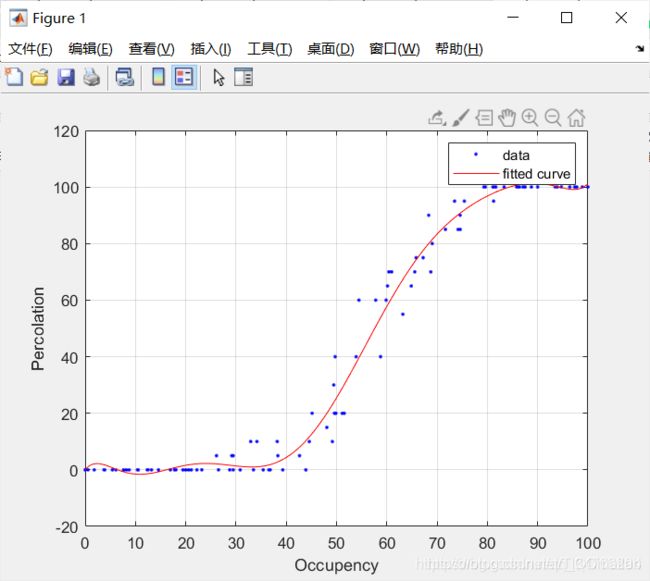
createFit(storageall10o, storageall10p);

function [fitresult, gof] = createFit(storageall10o, storageall10p)
%CREATEFIT(STORAGEALL10O,STORAGEALL10P)
%  Create a fit.
%
%  Data for 'untitled fit 1' fit:
%      X Input : storageall10o
%      Y Output: storageall10p
%  Output:
%      fitresult : a fit object representing the fit.
%      gof : structure with goodness-of fit info.
%
%  See also FIT, CFIT, SFIT.
%  Auto-generated by MATLAB on 05-Nov-2019 20:55:03

%% Fit: 'untitled fit 1'.
[xData, yData] = prepareCurveData( storageall10o, storageall10p );
% Set up fittype and options.
ft = fittype( 'poly9' );
% Fit model to data.
[fitresult, gof] = fit( xData, yData, ft );
% Plot fit with data.
figure();
plot( fitresult, xData, yData );
%legend( h, 'storageall10p vs. storageall10o', 'untitled fit 1', 'Location', 'NorthEast' );
%Label axes
xlabel Occupency
ylabel Percolation
grid on

end


function [pc] = count(A,i,j,n,m,pc,B)
if i==n||pc==1
%B=test_matrix;
% figure;
% cmap = [1,1,0;0,1,1;0,0,1];
% set(gcf,'Position', [0 0 n*100 m*100])
% imagesc(B);
% colorbar;
% title("B ");
% colormap(cmap);
% colorbar;
% pause(0.05);
pc=1;
return ;
end

if pc==0
test_matrix=A;
test_matrix(i,j)=2;


if i~=n
       if(test_matrix(i+1,j)==1)
       [pc]=count(test_matrix,i+1,j,n,m,pc,B);

       end
end
   if j~=1&&i~=1
   if (test_matrix(i,j-1)==1)
      [pc]=count(test_matrix,i,j-1,n,m,pc,B);
   end
   end


if j~=m&&i~=1
   if(test_matrix(i,j+1)==1)
     [pc]=count(test_matrix,i,j+1,n,m,pc,B);
   end
end


   if i~=1
       if(test_matrix(i-1,j)==1)
       [pc]=count(test_matrix,i-1,j,n,m,pc,B);

       end
   end
end

end
二、运行结果
三、备注
完整代码或者代写添加QQ2449341593。
往期回顾>>>>>>
【基础教程】基于matlab构建自己的colormap【含Matlab源码 032期】
