基于卡尔曼滤波的一阶电池系统的非线性状态估计
- 单体电池等效电路

该模型包含一个电压源Em,串联电阻R0 和一个RC块 R1 和C1。在电池充放电循环中,测量的电池电流,电压和温度来估计电池模型的充电状态(SOC)。您假设电池是非线性系统,使用无迹卡尔曼滤波器估算SOC。电池的容量会随着每个充电周期而降低,从而导致SOC估算不准确。当电池在充电和放电之间转换时,使用基于事件的线性卡尔曼滤波器来估计电池容量。估计的容量又可以用来指示电池的健康状况。
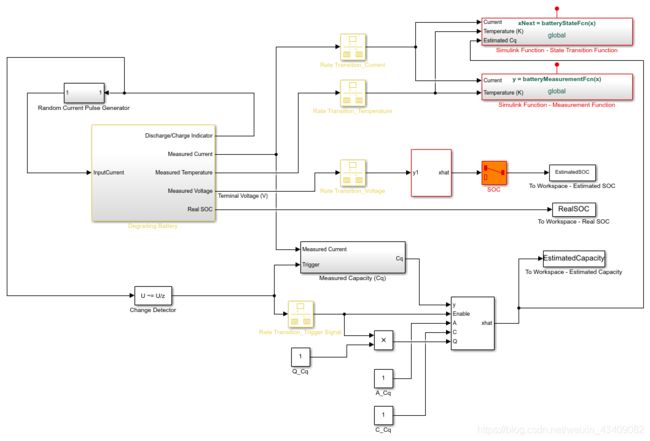
Simulink模型包含三个主要组件:电池模型,无迹的Kalman滤波器模块和基于事件的Kalman滤波器模块。以下各节给出了进一步的解释。

- 电池模型
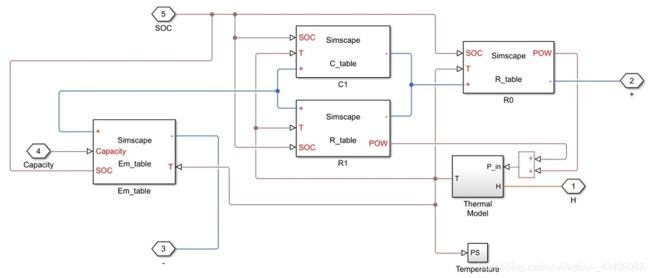
具有热效应的电池模型是使用Simscape语言实现的。

电池模型的状态转换方程式为:
R1 和C1(SOC,Tb) 是RC模块中与热和SOC相关的电阻器和电容器,U1是电容器两端的电压 I 是输入电流,Tb电池温度Cq 是电池容量(单位:Ah),并且w是过程噪音。
输入电流是在电池放电时随机产生的脉冲,而在电池充电时恒定,如下图所示。

测量公式由下式给出:
![]()
E 是测得的电压输出,R0(SOC,Tb) 是串行电阻, Em =Em(SOC,Tb)是来自电压源的电动势,并且v是测量噪声。
在模型中 R0,R1,C1 和 Em是取决于SOC和电池温度的2D查找表。查找表中的参数使用实验数据[1]进行标识
- 估算充电状态(SOC)
要使用无迹的卡尔曼滤波器模块,需要为状态和测量方程式定义Matlab或Simulink函数。本示例演示了Simulink函数的用法。由于无迹卡尔曼滤波器是离散时间滤波器,因此首先离散化状态方程。在这个例子中,采用欧拉离散化。设采样时间为 Ts 。对于一般的非线性系统
,系统可以离散为
![]()
非线性电池系统的状态向量为
应用Euler离散化可得出以下方程式:
离散化的状态转移方程式被实现为名为“ batteryStateFcn”的Simulink函数,如下所示。函数输入x是状态向量,而函数输出xNext是下一步的状态向量,使用离散状态转移方程式进行计算。你需要指定的信号尺寸和数据类型x和xNext。在这个例子中,为对信号维度x和xNext是2和数据类型是double。其他输入是温度,估计的容量和电流。注意,附加输入是状态转换方程的输入,UKF块不需要这些附加输入。

测量功能也实现为名为“ batteryMeasurementFcn”的Simulink函数,如下所示。

如下配置块参数:
在系统模型选项卡中,指定块参数,如下所示:

您指定以下参数:
在状态转换中的功能: batteryStateFcn。
先前定义的simulink函数的名称,该函数实现离散状态转移方程。
过程噪声: Additive具有时变协方差
![]()
该Additive装置中的噪声项被添加到直接的最终信号。
SOC和U1根据电池系统的动态特性估算。电池的标称容量为30 Ah,并以15A的平均电流幅度经历放电/充电循环。因此,一个放电或充电过程将花费大约2个小时(7200秒)。SOC的最大变化是100%,而SOC的最大变化是4伏左右U1.
SOC和每步的最大变化 U1 是
![]()
和
![]()
Ts是过滤器的采样时间。在这个例子中 Ts 设置为1秒。
过程噪音W 是:
![]()
初始状态!
![]()
假设SOC的初始值为100%(充满电的电池),而SOC的初始值为 U1 设置为0,因为我们没有任何先验信息U1.
初始协方差:
初始协方差表明初始猜测的准确性和可靠性。假设最大初始猜测误差对于SOC为10%,对于SOC为1V U1。初始协方差矩阵设置为
![]()
无迹的转换参数:设置基于[2]
 -Alpha:1.确定x周围sigma点的分布。将Alpha设置为1以获得更大的价差。
 -Beta:2.用于合并发行的先验知识。Beta的标称值为2。
 -Kappa:0。辅助缩放参数。Kappa的标称值为0。
测量功能: batteryMeasurementFcn。
先前定义的实现测量功能的simulink函数的名称。
测量噪声: Additive,具有时不变协方差1e-3。
根据测量设备的精度估算测量噪声。用于电池电压测量的电压表的精度约为1%。电池电压约为4V。等效地,我们有
![]()
因此,设定
$V =(max(dE_m))^ 2 =1e-3
采样时间: Ts
估计电池退化
电池退化是通过降低容量来建模的Cq。在该示例中,电池容量设置为每个放电周期减少1 Ah,以说明降级的影响。由于容量的降低率是未知的,因此设置Cq 随机步长:
![]()
k 是放电-充电循环的次数, W Cq 是过程噪音。
电池配置为在电池电量为30%时自动充电,并在电量状态为90%时切换为放电。使用此信息通过积分电流来测量电池容量i 在充电或放电周期内(库仑计数)。
电池退化的状态和测量方程可以归纳为以下状态空间形式:
![]()
A Cq 和 C Cq 等于1。
对于上述线性系统,请使用卡尔曼滤波器来估计电池容量。估计Cq来自线性卡尔曼滤波器的信号用于改善SOC估计。在该示例中,基于事件的线性卡尔曼滤波器用于估计 Cq。以来 Cq 如果在一个充电或放电周期内对它进行一次测量,则仅在充电或放电结束时才启用线性卡尔曼滤波器。
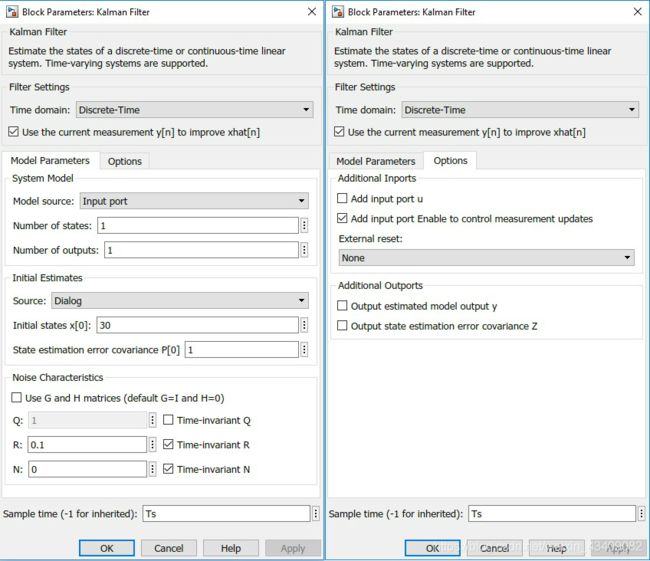
如下配置块参数和选项:

Model source: Input Port.
To implement an event-based Kalman Filter, the state equation is enabled only when the event happens. In other word, the state equation is event-based as well. For a linear system x t + 1 = A x t + B u t + w t x_{t+1} = Ax_t + Bu_t + w_t xt+1=Axt+But+wt, set the state equation to be
x t + 1 = { A x t + B u t + w t , t = t e n a b l e d x t , t ≠ t e n a b l e d x_{t+1} = \left \{ \begin{array}{cc} Ax_t + Bu_t + w_t, t=t_{enabled} \\ x_t, t \neq t_{enabled} \end{array} \right. xt+1={ Axt+But+wt,t=tenabledxt,t=tenabled.
A: { A C q , t = t e n a b l e d 1 , t ≠ t e n a b l e d \left \{ \begin{array}{cc} A_{C_q}, t=t_{enabled} \\ 1, t \neq t_{enabled} \end{array} \right. { ACq,t=tenabled1,t=tenabled. In this example, A C q = 1 A_{C_q}=1 ACq=1. Therefore, A A A equals to 1 all the time.
C: 1, from C q k M e a s u r e d = C q k + V C q = ∫ t k − 1 t k I d t 0.6 C_{q_k}^{Measured} = C_{q_k} + V_{C_q} = \frac{\int_{t_{k-1}}^{t_k}{I}dt}{0.6} CqkMeasured=Cqk+VCq=0.6∫tk−1tkIdt.
Initial Estimate Source: Dialog. You specify initial states in Initial state x[0]
Initial states x[0]: 30. This is the nominal capacity of the battery (30Ah).
Q: { 1 , t = t e n a b l e d 0 , t ≠ t e n a b l e d \left \{ \begin{array}{cc} 1, t=t_{enabled} \\ 0, t \neq t_{enabled} \end{array} \right. { 1,t=tenabled0,t=tenabled
This is the covariance of the process noise W C q W_{C_q} WCq. Since the degradation rate in the capacity is around 1 Ah per discharge-charge cycle, set the process noise to be 1.
R: 0.1. This is the covariance of the measurement noise V C q V_{C_q} VCq. Assume that the capacity measurement error is less than 1%. With a battery capacity of 30 Ah, the measurement noise V C q ≈ ( 0.3 ) 2 ≈ 0.1 V_{C_q} \approx (0.3)^2 \approx 0.1 VCq≈(0.3)2≈0.1.
Sample Time: Ts.
In the Options tab, add an input port Enable to control measurement updates. The enable port is used to update the battery capacity estimate on either charge or discharge events, as opposed to continually updating.
Note that setting Enable to 0 does not disable predictions using state equations. Therefore, the state equation is configured to be event-based as well. By setting an event-based A and Q for the Kalman Filter block, predictions using state equations are disabled when Enable is set to be 0.
Results
To simulate the system, load the battery parameters stored in the file BatteryParameters.mat. The file contains the battery parameters including E m ( S O C , T ) E_m(SOC,T) Em(SOC,T), R 0 ( S O C , T ) R_0(SOC,T) R0(SOC,T), R 1 ( S O C , T ) R_1(SOC,T) R1(SOC,T).
load BatteryParameters.mat
Simulate the system.
sim(‘BatteryExampleUKF’)
At every time step, the Unscented Kalman Filter provides an estimation for SOC, based on voltage measurements E m E_m Em. Plot the real SOC, the estimated SOC, and the difference between them.
% Synchronize two time series
[RealSOC, EstimatedSOC] = synchronize(RealSOC, EstimatedSOC, 'intersection');

figure;
subplot(2,1,1)
plot(100*RealSOC,'b','LineWidth',1.5);
hold on
plot(100*EstimatedSOC,'r--','LineWidth',1);
title('State of Charge');
xlabel('Time (s)');
ylabel('SOC (%)');
legend('Actual','UKF estimate','Location','Best','Orientation','horizontal');
axis tight

subplot(2,1,2)
DiffSOC = 100*(RealSOC - EstimatedSOC);
plot(DiffSOC.Time, DiffSOC.Data, 'LineWidth', 1.5);
xlabel('Time(s)');
ylabel('\Delta SOC (%)','Interpreter','Tex');
legend('Difference between Real SOC and Estimated SOC','Location','Best')
axis tight
figure;
subplot(2,1,1);
plot(RealCapacity,'b','LineWidth',1.5);
hold on
plot(EstimatedCapacity,'r--','LineWidth',1.5);
xlabel('Time (s)');
ylabel('Capacity (Ah)');
legend('Actual','KF estimate','Location','Best');

subplot(2,1,2);
plot(DischargeChargeIndicator.Time,DischargeChargeIndicator.Data,'b','LineWidth',1.5);
xlabel('Time(s)');
ylabel('Enable Signal');

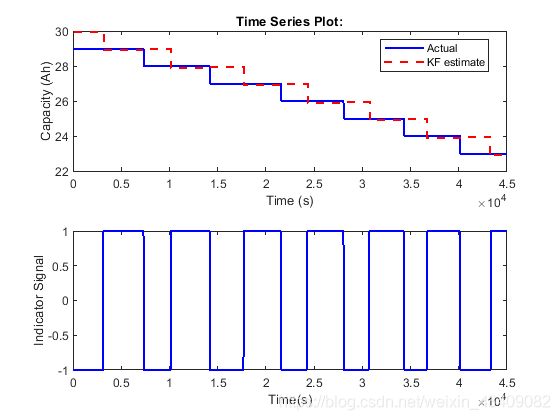
通常,卡尔曼滤波器能够跟踪实际容量。在估计容量和实际容量之间存在半个周期的延迟。该延迟是由于测量时间的缘故。当一个完整的充放电循环结束时,将发生电池容量下降的计算。库仑计数基于先前的放电或充电周期进行容量测量。
Reference
[1] Huria, Tarun, et al. “High fidelity electrical model with thermal dependence for characterization and simulation of high power lithium battery cells.” Electric Vehicle Conference (IEVC), 2012 IEEE International. IEEE, 2012.
[2] Wan, Eric A., and Rudolph Van Der Merwe. “The unscented Kalman filter for nonlinear estimation.” Adaptive Systems for Signal Processing, Communications, and Control Symposium 2000. AS-SPCC. The IEEE 2000. Ieee, 2000.
