matlab 图形绘制(基础篇)
【参考教学视频:https://www.bilibili.com/video/av14503445/?p=5】
目录
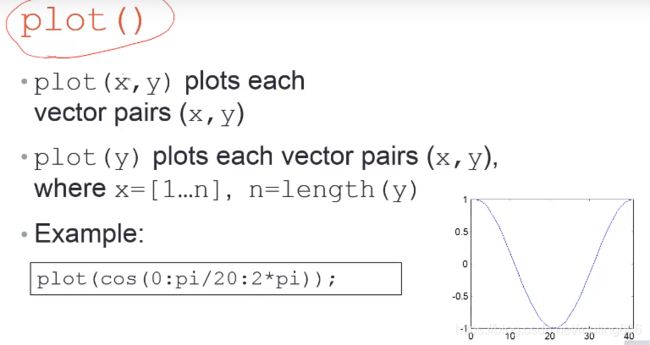
plot()
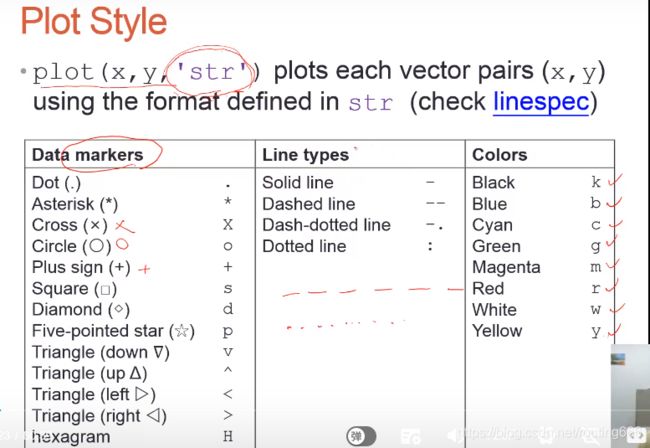
plot指定 形状:
text() 、annotation():
更改图像的性质:
更改特性:
marker:(点的特性)
同时画多个图(不被覆盖):
在一个plot画多个figure:
将画出的图像保存:
plot()
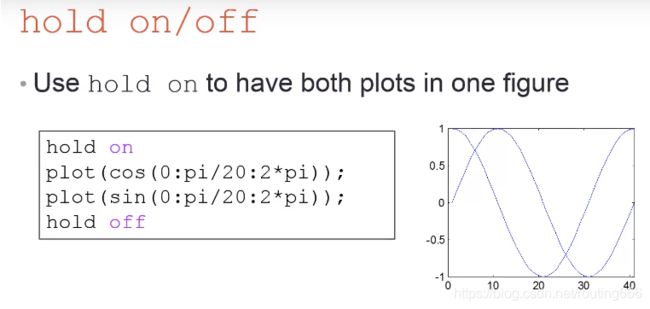
matlab 在画图是会将前面的图覆盖掉,除非用hold on 和 hold off
(通过hold on 可以将多条线画在同一个图形之中)
plot指定 形状:
如:
(1)
hold on;
plot(cos(0:pi/20:2*pi),'or--');
plot(sin(0:pi/20:2*pi),'xg:');
hold off;
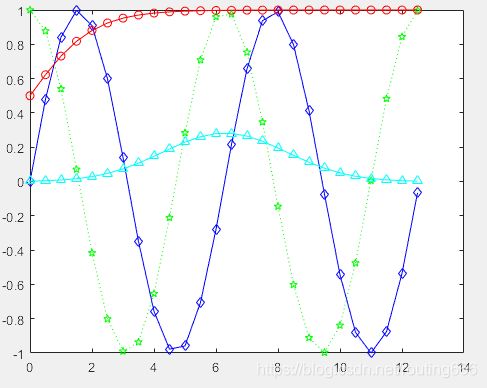
(2)
x = 0:0.5:4*pi;
y = sin(x);
h = cos(x);
w = 1./(1+exp(-x));
g = (1/(2*pi*2)^0.5).*exp((-1.*(x-2*pi).^2)./(2*2^2));
plot(x,y,'bd-',x,h,'gp:',x,w,'ro-',x,g,'c^-');
(3)
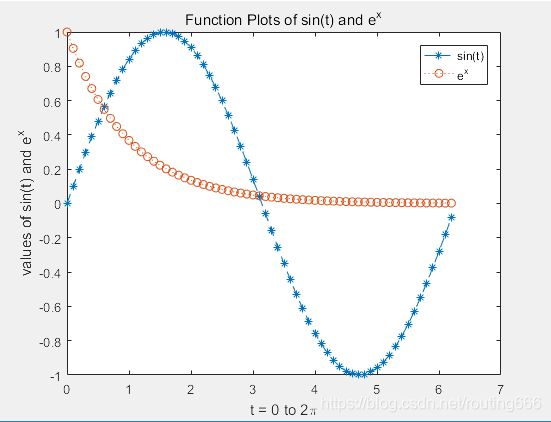
plot(x, y1,'--*',x,y2,':o');
xlabel('t = 0 to 2\pi');
ylabel('values of sin(t) and e^{x}');
title('Function Plots of sin(t) and e^{x}');
legend('sin(t)','e^{x}');
text() 、annotation():
例如:
clc ;
clear;
x = linspace(0,3);
y = x.^2.*sin(x);
plot(x,y);
line([2,2],[0,2^2*sin(2)]);
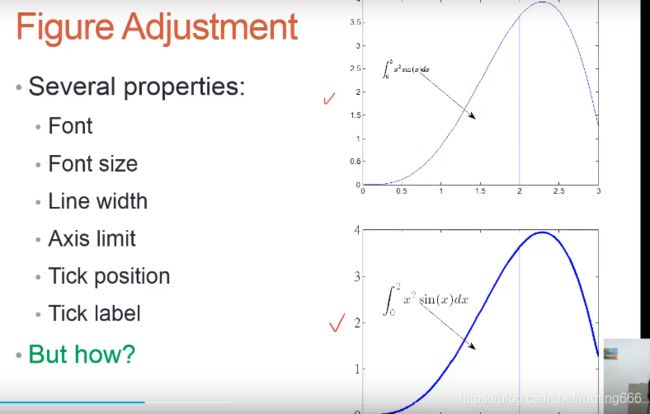
str = '$$ \int_{0}^{2} x^2\sin(x) dx $$';
text(0.25,2.5,str,'Interpreter','latex');
annotation('arrow','X',[0.32,0.5],'Y',[0.6,0.4]);
str = '$$ \int_{0}^{2} x^2\sin(x) dx $$';
text(0.25,2.5,str,'Interpreter','latex');
——>积分公式的显示
annotation('arrow','X',[0.32,0.5],'Y',[0.6,0.4]); ——>箭头。
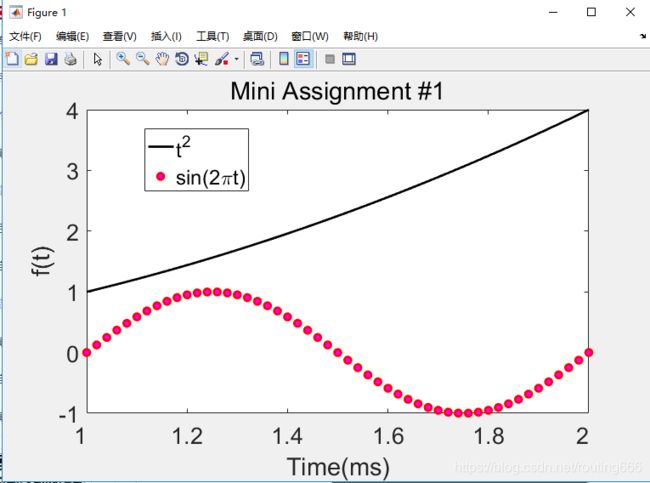
【练习】
clc ;
clear;
x = 1:0.02:2;
y1 = x.^2;
y2 = sin(2*pi.*x);
plot(x,y1,'-k',x,y2,'or');
ylabel('f(t)');
xlabel('Time(ms)');
title('Mini Assignment #1');
legend('{t}^2','sin(2\pi{t})');
更改图像的性质:
如:
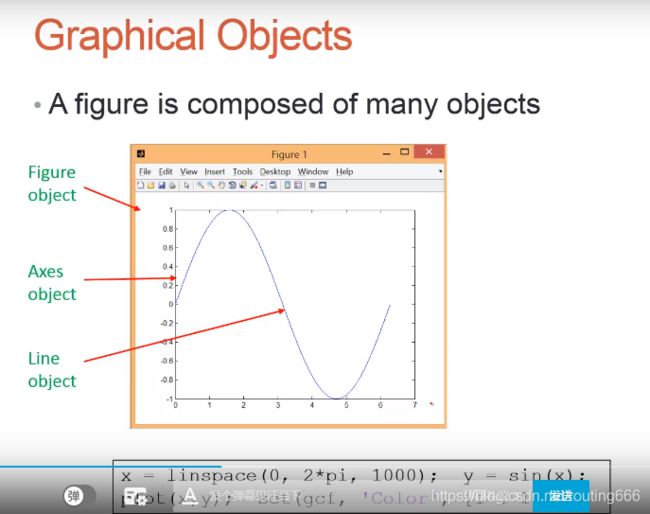
x = linspace(0,2*pi,1000);
y = sin(x);
plot(x,y);
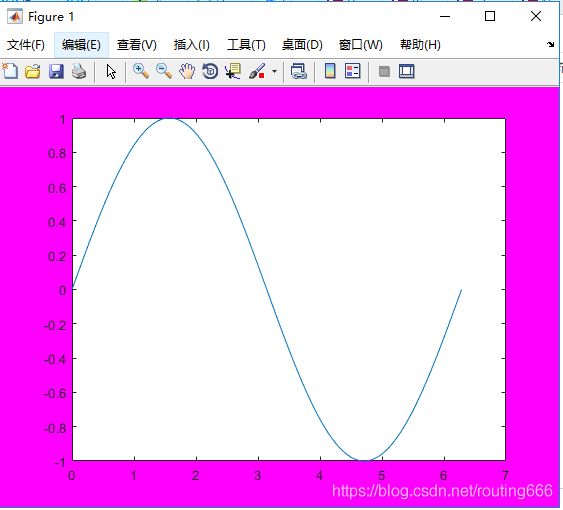
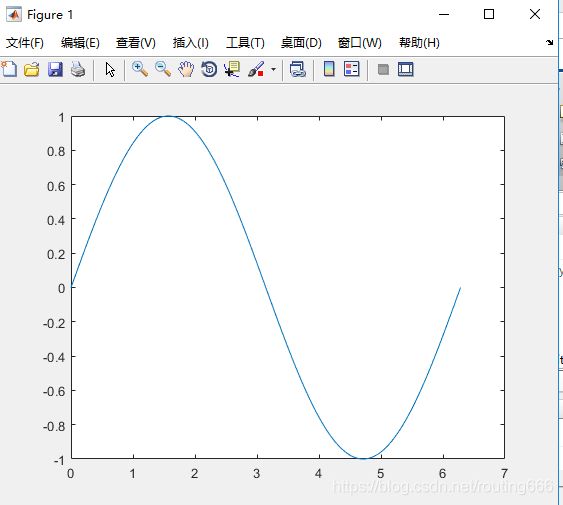
set(gcf,'Color',[1 1 1]);
若更改最后一行代码为:set(gcf,'Color',[1 0 1]);则 图变为:
更改特性:
get()用法:
x = linspace(0,2*pi,1000);
y = sin(x);
plot(x,y);
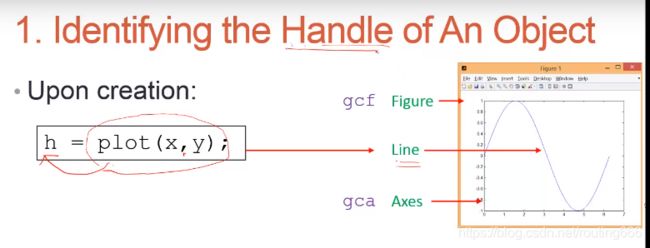
h = plot(x,y);
get(h);
得到:
    AlignVertexCenters: 'off'
            Annotation: [1x1 matlab.graphics.eventdata.Annotation]
          BeingDeleted: 'off'
            BusyAction: 'queue'
         ButtonDownFcn: ''
              Children: [0x0 GraphicsPlaceholder]
              Clipping: 'on'
                 Color: [0 0.4470 0.7410]
             CreateFcn: ''
             DeleteFcn: ''
           DisplayName: ''
      HandleVisibility: 'on'
               HitTest: 'on'
         Interruptible: 'on'
              LineJoin: 'round'
             LineStyle: '-'
             LineWidth: 0.5000
                Marker: 'none'
       MarkerEdgeColor: 'auto'
       MarkerFaceColor: 'none'
            MarkerSize: 6
                Parent: [1x1 Axes]
         PickableParts: 'visible'
              Selected: 'off'
    SelectionHighlight: 'on'
                   Tag: ''
                  Type: 'line'
         UIContextMenu: [0x0 GraphicsPlaceholder]
              UserData: []
               Visible: 'on'
                 XData: [1x1000 double]
             XDataMode: 'manual'
           XDataSource: ''
                 YData: [1x1000 double]
           YDataSource: ''
                 ZData: [1x0 double]
           ZDataSource: ''
将最护一行代码改为:get(gcf), 则会得到:
                      Tag: ''
                  ToolBar: 'auto'
                     Type: 'figure'
            UIContextMenu: [0x0 GraphicsPlaceholder]
                    Units: 'pixels'
                 UserData: []
                  Visible: 'on'
      WindowButtonDownFcn: ''
    WindowButtonMotionFcn: ''
        WindowButtonUpFcn: ''
        WindowKeyPressFcn: ''
      WindowKeyReleaseFcn: ''
     WindowScrollWheelFcn: ''
              WindowStyle: 'normal'
get(gca):
                       ALim: [0 1]
                   ALimMode: 'auto'
     ActivePositionProperty: 'outerposition'
          AmbientLightColor: [1 1 1]
               BeingDeleted: 'off'
                        Box: 'on'
                   BoxStyle: 'back'
                 BusyAction: 'queue'
              ButtonDownFcn: ''
                       CLim: [0 1]
                   CLimMode: 'auto'
             CameraPosition: [3.5000 0 17.3205]
         CameraPositionMode: 'auto'
               CameraTarget: [3.5000 0 0]
           CameraTargetMode: 'auto'
             CameraUpVector: [0 1 0]
         CameraUpVectorMode: 'auto'
            CameraViewAngle: 6.6086
        CameraViewAngleMode: 'auto'
                   Children: [1x1 Line]
                   Clipping: 'on'
              ClippingStyle: '3dbox'
                      Color: [1 1 1]
                 ColorOrder: [7x3 double]
            ColorOrderIndex: 2
                  CreateFcn: ''
               CurrentPoint: [2x3 double]
            DataAspectRatio: [3.5000 1 1]
        DataAspectRatioMode: 'auto'
                  DeleteFcn: ''
                  FontAngle: 'normal'
                   FontName: 'Helvetica'
                   FontSize: 10
              FontSmoothing: 'on'
                  FontUnits: 'points'
                 FontWeight: 'normal'
                  GridAlpha: 0.1500
              GridAlphaMode: 'auto'
                  GridColor: [0.1500 0.1500 0.1500]
              GridColorMode: 'auto'
              GridLineStyle: '-'
           HandleVisibility: 'on'
                    HitTest: 'on'
              Interruptible: 'on'
    LabelFontSizeMultiplier: 1.1000
                      Layer: 'bottom'
             LineStyleOrder: '-'
        LineStyleOrderIndex: 1
                  LineWidth: 0.5000
             MinorGridAlpha: 0.2500
         MinorGridAlphaMode: 'auto'
             MinorGridColor: [0.1000 0.1000 0.1000]
         MinorGridColorMode: 'auto'
         MinorGridLineStyle: ':'
                   NextPlot: 'replace'
              OuterPosition: [0 0 1 1]
                     Parent: [1x1 Figure]
              PickableParts: 'visible'
         PlotBoxAspectRatio: [1 0.7903 0.7903]
     PlotBoxAspectRatioMode: 'auto'
                   Position: [0.1300 0.1100 0.7750 0.8150]
                 Projection: 'orthographic'
                   Selected: 'off'
         SelectionHighlight: 'on'
                 SortMethod: 'childorder'
                        Tag: ''
                    TickDir: 'in'
                TickDirMode: 'auto'
       TickLabelInterpreter: 'tex'
                 TickLength: [0.0100 0.0250]
                 TightInset: [0.0506 0.0532 0.0071 0.0202]
                      Title: [1x1 Text]
    TitleFontSizeMultiplier: 1.1000
            TitleFontWeight: 'normal'
                       Type: 'axes'
              UIContextMenu: [0x0 GraphicsPlaceholder]
                      Units: 'normalized'
                   UserData: []
                       View: [0 90]
                    Visible: 'on'
                      XAxis: [1x1 NumericRuler]
              XAxisLocation: 'bottom'
                     XColor: [0.1500 0.1500 0.1500]
                 XColorMode: 'auto'
                       XDir: 'normal'
                      XGrid: 'off'
                     XLabel: [1x1 Text]
                       XLim: [0 7]
                   XLimMode: 'auto'
                 XMinorGrid: 'off'
                 XMinorTick: 'off'
                     XScale: 'linear'
                      XTick: [0 1 2 3 4 5 6 7]
                 XTickLabel: {8x1 cell}
             XTickLabelMode: 'auto'
         XTickLabelRotation: 0
                  XTickMode: 'auto'
                      YAxis: [1x1 NumericRuler]
              YAxisLocation: 'left'
                     YColor: [0.1500 0.1500 0.1500]
                 YColorMode: 'auto'
                       YDir: 'normal'
                      YGrid: 'off'
                     YLabel: [1x1 Text]
                       YLim: [-1 1]
                   YLimMode: 'auto'
                 YMinorGrid: 'off'
                 YMinorTick: 'off'
                     YScale: 'linear'
                      YTick: [-1 -0.8000 -0.6000 -0.4000 -0.2000 0 0.2000 0.4000 0.6000 0.8000 1]
                 YTickLabel: {11x1 cell}
             YTickLabelMode: 'auto'
         YTickLabelRotation: 0
                  YTickMode: 'auto'
                      ZAxis: [1x1 NumericRuler]
                     ZColor: [0.1500 0.1500 0.1500]
                 ZColorMode: 'auto'
                       ZDir: 'normal'
                      ZGrid: 'off'
                     ZLabel: [1x1 Text]
                       ZLim: [-1 1]
                   ZLimMode: 'auto'
                 ZMinorGrid: 'off'
                 ZMinorTick: 'off'
                     ZScale: 'linear'
                      ZTick: [-1 0 1]
                 ZTickLabel: ''
             ZTickLabelMode: 'auto'
         ZTickLabelRotation: 0
                  ZTickMode: 'auto'
用set()设置axis格式:
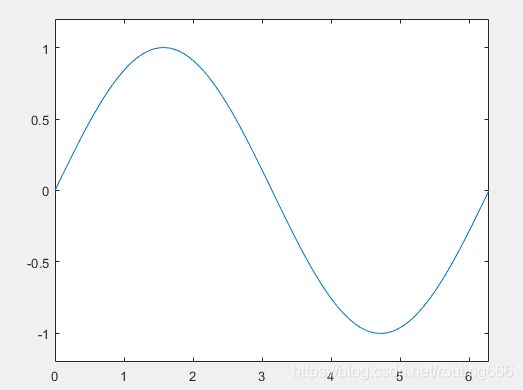
set(gca, 'XLim', [0,2*pi]);
set(gca, 'YLim',[-1.2, 1.2]);
(这里也可以用xlim()和ylim()函数。)
set(gca, 'FontSize',25);
set(gca, 'FontSize',15);
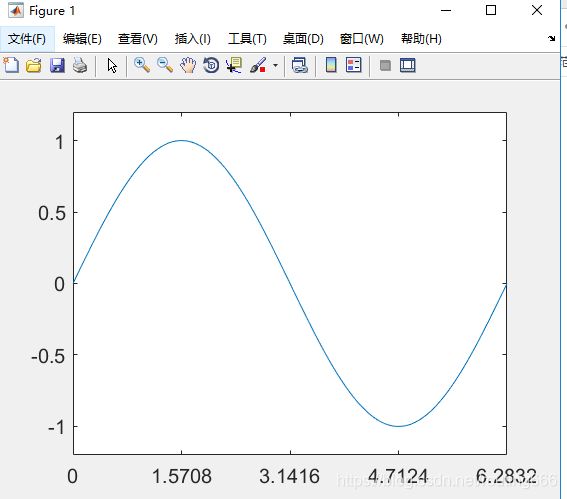
set(gca, 'XTick', 0:pi/2:2*pi);
set(gca, 'XLim', [0,2*pi]);
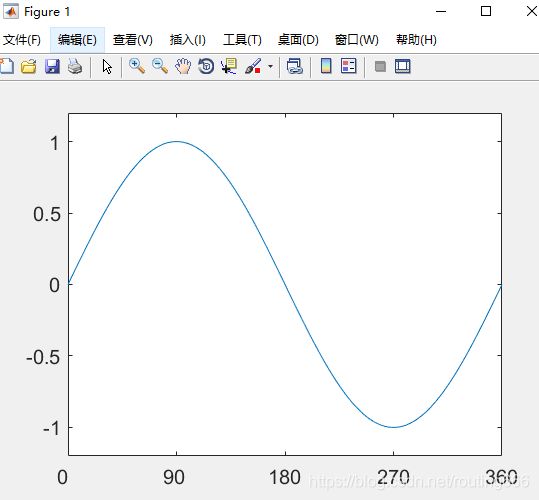
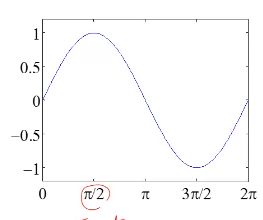
set(gca, 'YLim',[-1.2, 1.2]);set(gca,'XTickLabel',0:90:360);(这一部不知道为什么我电脑上显示的结果与给出的案例并不相同) 我的结果没出来:
于是我使用了另外的方法:set(gca,'XTickLabel',{'0','\pi/2','\pi','3\pi/2','2\pi'});
Line的特性:
set(h,'LineStyle','-.','LineWidth',7.0,'Color','g');总结用到的指令:
clc ;
clear;
x = linspace(0,2*pi,1000);
y = sin(x);
plot(x,y);
h = plot(x,y);
get(h);
set(gca,'XLim',[0,2*pi]);
set(gca,'YLim',[-1.2,1.2]);
set(gca, 'FontSize',15);
set(gca, 'XTick', 0:pi/2:2*pi);
set(gca,'XTickLabel',0:90:360);
set(gca,'XTickLabel',{'0','\pi/2','\pi','3\pi/2','2\pi'});
set(h,'LineStyle','-.','LineWidth',7.0,'Color','g');
marker:(点的特性)
clc;
clear;
x = rand(20,1);
set(gca, 'Fontsize',18);
plot(x,'-md','LineWidth',2,'MarkerEdgeColor','k',...
    'MarkerFaceColor','g','MarkerSize',10);
xlim([1,20]);
clc ;
clear;
x = 1:0.02:2;
y1 = x.^2;
y2 = sin(2*pi.*x);
h = plot(x,y1,'-k',x,y2,'or');
ylabel('f(t)');
xlabel('Time(ms)');
title('Mini Assignment #1');
legend('{t}^2','sin(2\pi{t})');
set(gca,'XLim',(1:2));
set(gca,'FontSize',20);
set(h,'LineWidth',2);
set(h,'MarkerFaceColor','m');
set(gca,'XTickLabel',1:0.2:2);同时画多个图(不被覆盖):
plot() 画图前用figure调用新图像:
x = -10:0.1:10;
y1 = x.^2 - 8;
y2 = exp(x);
figure, plot(x,y1);
figure, plot(x,y2);
【注意:此时的gca和gcf是最后一张图的。不能指向前面的图】
在调用figure时可以指定位置:
figure指令的更多用法:https://blog.csdn.net/qq_30387863/article/details/80301996
在一个plot画多个figure:
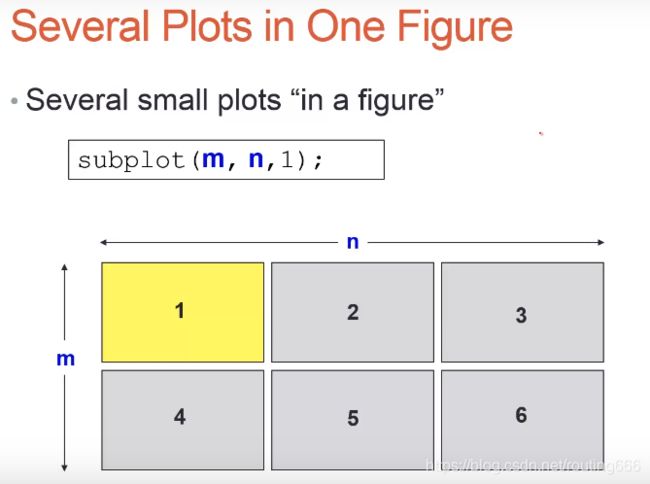
【只能对最后subplot()的图像进行操作】
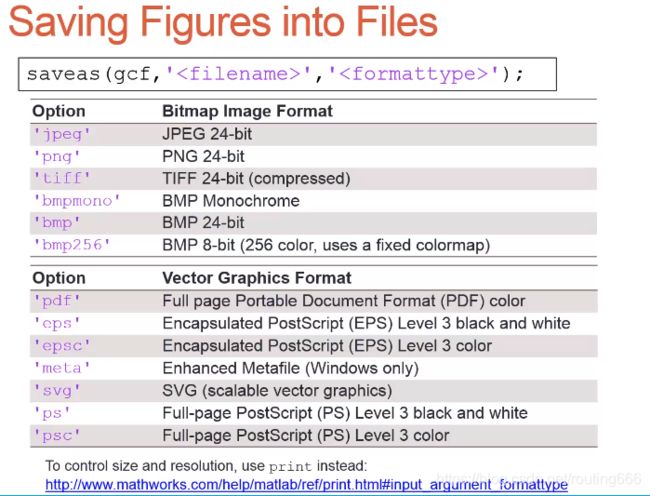
将画出的图像保存:
可存为两种形式的文件:
Bitmap Image Format
Vector Graphics Format (向量的形式,无论放大多少倍都不会模糊掉)
【如果要高解析度:参考print的使用。】
