Matplotlib画图包与实例
文章目录
- Bar Plot
- Scatter Matrix Plot
- 3D Scatter Plot
- Decision Boundary Plot
- Scatter Plot
-
- (I) K-NN classfication accuracy versus sensitivity to K
- (II) K-NN classfication accuracy versus sensitivity to train-test proportion
Bar Plot
- X轴label
- Bar颜色选择和数据标记
- Title
- 去框线
import matplotlib.pyplot as plt
plt.figure()
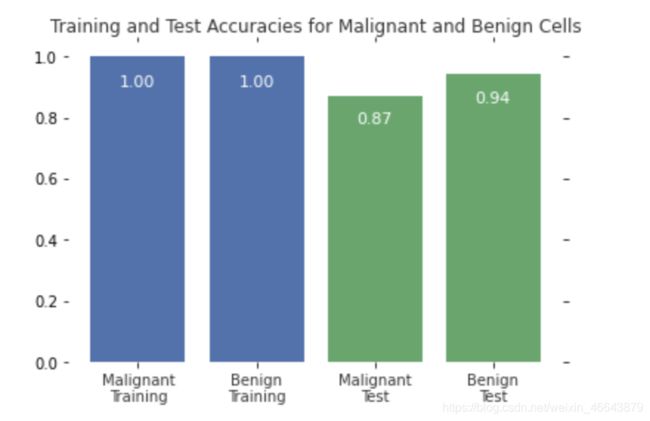
bars=plt.bar(np.arange(4),scores,color=['#4c72b0','#4c72b0','#55a868','#55a868'])

#label score onto the bar
for bar in bars:
    height=bar.get_height()
    plt.gca().text(bar.get_x()+ bar.get_width()/2,height*.90,'{0:.{1}f}'.format(height, 2),ha='center', color='w', fontsize=11)

 #remove all the ticks (both axes), and tick labels on the Y axis
plt.tick_params(top='off', bottom='off', left='off', right='off', labelleft='off', labelbottom='on')

 #remove the frame of the chart
for spine in plt.gca().spines.values():
       spine.set_visible(False)

plt.xticks([0,1,2,3], ['Malignant\nTraining', 'Benign\nTraining', 'Malignant\nTest', 'Benign\nTest'], alpha=0.8);
plt.title('Training and Test Accuracies for Malignant and Benign Cells', alpha=0.8)
plt.figure()
plt.bar()
plt.gca().text()
plt.gca().spines.values()
spine.set_visible()
plt.xticks()
plt.title()
bar.get_height()
bar.get_x()
bar.get_width()
Scatter Matrix Plot
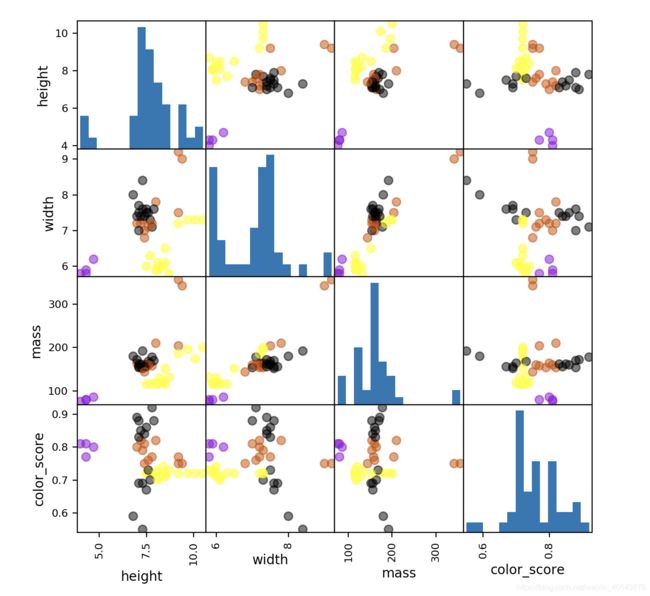
Data consists of 4 features + one label
# plotting a scatter matrix
from matplotlib import cm #color map

X = fruits[['height', 'width', 'mass', 'color_score']]
y = fruits['fruit_label']
X_train, X_test, y_train, y_test = train_test_split(X, y, random_state=0)

cmap = cm.get_cmap('gnuplot')
scatter = pd.scatter_matrix(X_train, c= y_train, marker = 'o', s=40, hist_kwds={
     'bins':15}, figsize=(7,7), cmap=cmap)
cm.get_cmap()
pd.scatter_matrix()
3D Scatter Plot
# plotting a 3D scatter plot
from mpl_toolkits.mplot3d import Axes3D

fig = plt.figure()
ax = fig.add_subplot(111, projection = '3d')
ax.scatter(X_train['width'], X_train['height'], X_train['color_score'], c = y_train, marker = 'o', s=100)
ax.set_xlabel('width')
ax.set_ylabel('height')
ax.set_zlabel('color_score')
plt.show()
fig=plt.figure()
ax=fig.add_subplot()
ax.scatter()
ax.set_xlabel()
ax.set_ylabel()
ax.set_zlabel()
plt.show()
Decision Boundary Plot
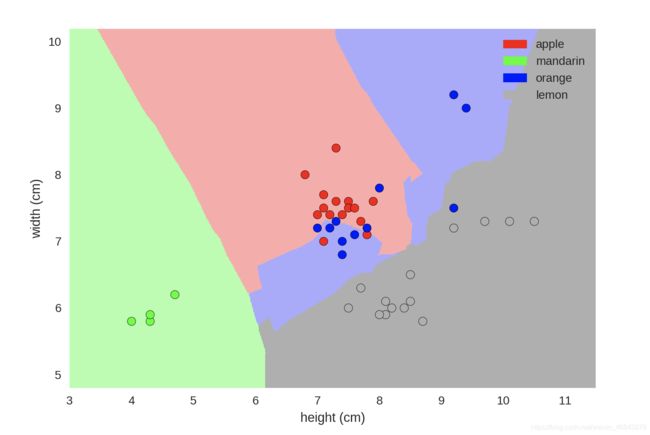
from adspy_shared_utilities import plot_fruit_knn

plot_fruit_knn(X_train, y_train, 5, 'uniform')   # we choose 5 nearest neighbors
Scatter Plot
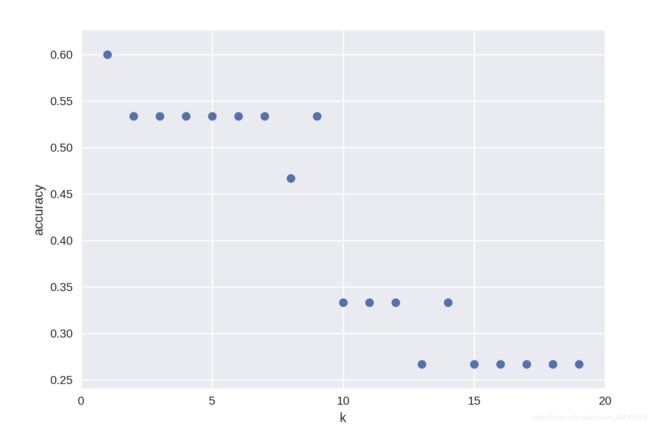
(I) K-NN classfication accuracy versus sensitivity to K
import matplotlib.pyplot as plt
k_range = range(1,20)
scores = []

for k in k_range:
    knn = KNeighborsClassifier(n_neighbors = k)
    knn.fit(X_train, y_train)
    scores.append(knn.score(X_test, y_test))

plt.figure()
plt.xlabel('k')
plt.ylabel('accuracy')
plt.scatter(k_range, scores)
plt.xticks([0,5,10,15,20]);
plt.figure()
plt.scatter()
plt.xlabel()
plt.ylabel()
plt.xticks()
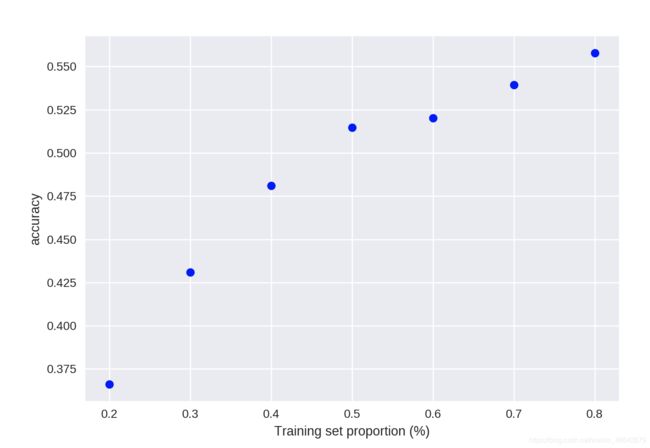
(II) K-NN classfication accuracy versus sensitivity to train-test proportion
import matplotlib.pyplot as plt
t = [0.8, 0.7, 0.6, 0.5, 0.4, 0.3, 0.2]

knn = KNeighborsClassifier(n_neighbors = 5)

plt.figure()

for s in t:

    scores = []
    for i in range(1,1000):
        X_train, X_test, y_train, y_test = train_test_split(X, y, test_size = 1-s)
        knn.fit(X_train, y_train)
        scores.append(knn.score(X_test, y_test))
    plt.plot(s, np.mean(scores), 'bo')

plt.xlabel('Training set proportion (%)')
plt.ylabel('accuracy');
plt.figure()
plt.plot()
plt.xlabel()
plt.ylabel()
