吴恩达机器学习作业(1):线性回归
目录
1)导入相关库和数据
2)代价函数
3)批量梯度下降
4)绘制线性模型
前阵子在网易云课堂学习了吴恩达老师的机器学习课程,今天结合网上资料,用Python实现了线性回归作业,共勉。建议大家使用Jupyter notebook来编写程序。
1)导入相关库和数据
导入相关库:numpy, pandas, matplotlib
import numpy as np
import pandas as pd
import matplotlib.pyplot as plt
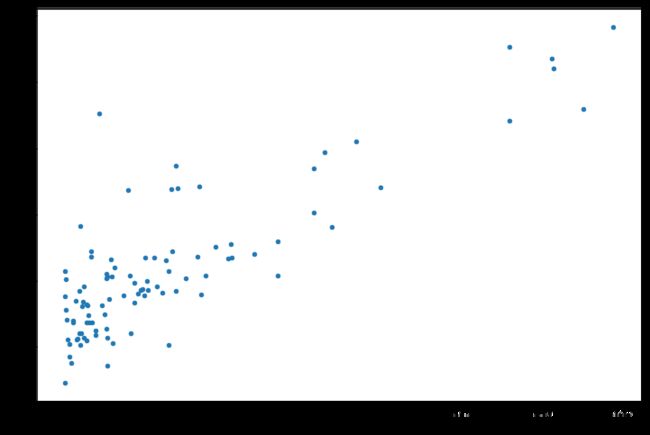
拿到数据之后,建议大家先看看数据长什么样子,这样有助于我们进行之后的分析:
path = 'ex1data1.txt'
#指定了列名,header=None
data = pd.read_csv(path, header=None, names=['Population', 'Profit'])
data.head()

data.describe()

data.plot(kind='scatter', x='Population', y='Profit', figsize=(12,8))
plt.show()
2)代价函数
现在我们使用梯度下降来实现线性回归,以最小化成本函数。
首先,我们将创建一个以参数![]() 为特征的代价函数:
为特征的代价函数:
其中:
def computeCost(X, y, theta):
    inner = np.power(((X * theta.T) - y), 2)
    return np.sum(inner) / (2 * len(X))
我们需要在训练集中添加一列,以便我们可以使用向量化解决方案来计算大家函数:
#在第0列插入1,列名为“Ones”
data.insert(0, 'Ones', 1)

# set X (training data) and y (target variable)
#cols = 3
cols = data.shape[1]
X = data.iloc[:,0:cols-1] #X选取所有行,去掉最后一列,第一个分号前为行。
y = data.iloc[:,cols-1:cols]#y选取所有行,最后一列
代价函数应该是numpy矩阵,所以我们需要转换X和y,然后才能使用它们。我们还需要初始化参数theta。
X = np.matrix(X.values)
y = np.matrix(y.values)
#我们这里是单变量线性回归,故只需要两个参数
theta = np.matrix(np.array([0,0]))
现在我们计算代价函数(theta初始值为0)
computeCost(X, y, theta)32.0727338774556763)批量梯度下降
我们前面只是计算了初试theta为0时代价函数的值,我们现在要使用梯度下降算法来求我们的参数![]() 。
。
def gradientDescent(X, y, theta, alpha, iters):
    temp = np.matrix(np.zeros(theta.shape))    #theta.shape=(1,2)
    parameters = int(theta.ravel().shape[1])    #ravel()降维,parameters=2
    cost = np.zeros(iters)                      #iter维零向量

    for i in range(iters):                        #迭代iters次
        error = (X * theta.T) - y

        for j in range(parameters):                #2个参数
            term = np.multiply(error, X[:,j])
            temp[0,j] = theta[0,j] - ((alpha / len(X)) * np.sum(term))

        theta = temp
        cost[i] = computeCost(X, y, theta)    #保存每次迭代后的cost值

    return theta, cost

alpha = 0.01
iters = 1000
现在我们运行梯度下降算法来求我们的参数theta并求出拟合后的代价函数值。
g, cost = gradientDescent(X, y, theta, alpha, iters)

computeCost(X, y, g)4.51595550307891184)绘制线性模型
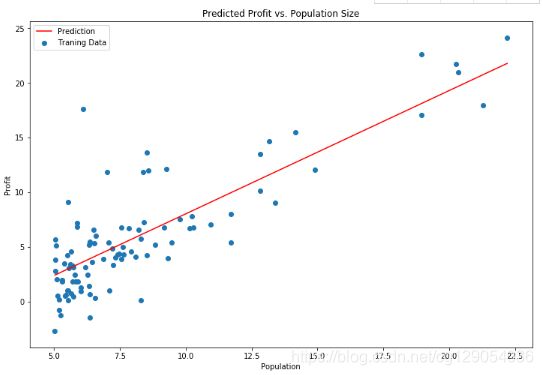
现在我们来绘制线性模型以及数据,直观地看出它的拟合。
x = np.linspace(data.Population.min(), data.Population.max(), 100)
f = g[0, 0] + (g[0, 1] * x)

fig, ax = plt.subplots(figsize=(12,8))
ax.plot(x, f, 'r', label='Prediction')
ax.scatter(data.Population, data.Profit, label='Traning Data')
ax.legend(loc=2)
ax.set_xlabel('Population')
ax.set_ylabel('Profit')
ax.set_title('Predicted Profit vs. Population Size')
plt.show()
由于梯度方程式函数也在每个训练迭代中输出一个代价的向量,所以我们也可以绘制。 请注意,代价总是降低 - 这是凸优化问题的一个例子。
fig, ax = plt.subplots(figsize=(12,8))
ax.plot(np.arange(iters), cost, 'r')
ax.set_xlabel('Iterations')
ax.set_ylabel('Cost')
ax.set_title('Error vs. Training Epoch')
plt.show()


