翻译 http://www.sthda.com/english/wiki/one-sample-t-test-in-r](http://www.sthda.com/english/wiki/one-sample-t-test-in-r)
什么是 one-sample t-test?
one-sample t-test 就是比较标准均值μ(理论值或者假设值)和样本均值。
通常理论均值来自:
一个过去的实验。比如,比较小鼠体重的均值是否等于200mg, 200mg是一个过去实验确定的值。
或者来自实验,这个实验有对照组和处理组。If you express your data as “percent of control”, you can test whether the average value of treatment condition differs significantly from 100.
注意: one-sample t-test只能用于数据服从正态分布的情况。可以使用 Shapiro-Wilk test检测数据是否服从正正态分布。
在统计学中,我们可以这样定义零假设(H0):
假设1: H0:m=μ
假设2:H0:m≤μ
假设3:H0:m≥μ
相对应的备择假设(Ha)分别是:
Ha:m≠μ (different)
Ha:m>μ (greater)
Ha:m<μ (less)
注意: 假设1被称为 two-tailed tests,假设2和假设3称为 one-tailed tests
one-sample t-test 计算公式:
m 是样本均值mean
n是样本大小
s是样本标准差,n-1自由度
μ是理论值
We can compute the p-value corresponding to the absolute value of the t-test statistics (|t|) for the degrees of freedom (df): df=n−1.
如何理解这个结果?
如果p-value小于等于显著水平0.05,这个时候,我们拒绝零假设H0,接受备择假设Ha。也就是说,我们可以认为样本均值与理论均值明显不同。
计算one-sample t-test的R函数
t.test(x, mu = 0, alternative = "two.sided")
- x: 一个数值型向量,包含你的数据
- mu: 理论均值。默认是0,可以自行设置。
- alternative: 备择假设。允许的值包括:"two.sided"(默认)、"greater" or "less"。
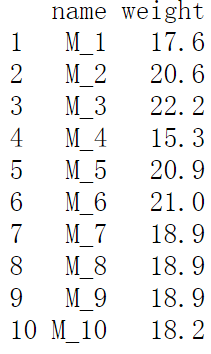
现在我们举一个例子。我们创建一个example data ,包含10个小鼠的重量。现在我们想知道这10只小鼠的平均重量是否等于25g?
set.seed(1234)
my_data <- data.frame(
  name = paste0(rep("M_", 10), 1:10),
  weight = round(rnorm(10, 20, 2), 1)
)
#  一个小小的疑问:设置的seed数一样,得到的随机数能一样吗?
查看一下创建的数据
head(my_data, 10)
Statistical summaries of weight
summary(my_data$weight)
Min:最小值
1st Qu: 第一分位数。25%的值小于第一分位数
Median: 中值,中位数。
3rd Qu:第三分位数。75%的值大于第三分位数。
Max: 最大值
install.packages("ggpubr")
library(ggpubr)
ggboxplot(my_data$weight,
          ylab = "Weight (g)", xlab = FALSE,
          ggtheme = theme_minimal())
在做one-sample t-test时先看满足要求不。
1 样本量大吗? 不,n<30
2 因为样本量不够大(<30,中心极限定理),我们需要检查一下数据是否符合正态分布。
怎么检查正态性呢?
简单来说,我们可以用Shapiro-Wilk normality test,观察normality plot.
Shapiro-Wilk test:
零假设:数据服从正态分布
备择假设:数据不服从正态分布
shapiro.test(my_data$weight) # => p-value = 0.6993
从结果来看,p-value大于显著水平0.05,表明我们的数据分布和正态分布无明显区别。也就是说,可以认为我们的数据具有正态性。
除了Shapiro-Wilk normality test,我们也可以用Q-Q plots (quantile-quantile plots)检查数据的正态性。Q-Q plot描绘了给定样本和正态分布的correlation.
library("ggpubr")
ggqqplot(my_data$weight, ylab = "Men's weight",
         ggtheme = theme_minimal())
从normality plot,我们可以看出,我们的数据可能来自正态分布。
注意: 如果你的数据是非正态分布的,推荐你使用
non parametric one-sample Wilcoxon rank test.
现在我们想知道这10只小鼠的平均重量是否等于25g(two-tailed test)?
# One-sample t-test
res <- t.test(my_data$weight, mu = 25)
#  Printing the results
res
上图的结果表明:
t为t检验统计量,t = -9.0783
df是自由度,df=9
p-value是t-test的显著水平(p-value = 7.953e-06)
conf.int is the confidence interval of the mean at 95% (conf.int = [17.8172, 20.6828]);
sample estimates是样本均值(mean=19.25)
注意:
如果你想检验这10只小鼠的平均重量是小于25g(one-tailed test)
t.test(my_data$weight, mu = 25,
              alternative = "less")
#  是不是应该是greater???
如果你想检验这10只小鼠的平均重量是大于25g(one-tailed test)
t.test(my_data$weight, mu = 25,
              alternative = "greater")
#  是不是应该是less???
t-test的p-value值是7.953e-06,小于显著水平0.05。我们可以认为小鼠的平均体重不等于25g, p-value = 7.953e-06
t.test()的返回值是一个list,包含下面的组分:
statistic: t检验统计量的值
parameter: t检验的自由度
p.value: t test 的 p-value 值
conf.int: a confidence interval for the mean appropriate to the specified alternative hypothesis.
estimate: the means of the two groups being compared (in the case of independent t test) or difference in means (in the case of paired t test).
如果是 independent t test,该值为比较的两个组的均值;如果是paired t test,该值为difference in means
# printing the p-value
res$p.value
# printing the mean
res$estimate
# printing the confidence interval
res$conf.int


