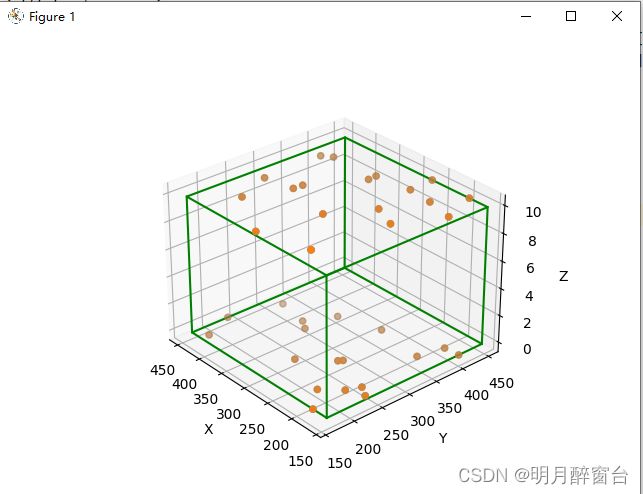
1.绘制散点图(读取csv)
import csv
import matplotlib.pyplot as plt
file1 = './file/stone_points.csv'
with open(file1) as f:
reader = csv.reader(f)
header_row = next(reader)
fig = plt.figure(1)
ax = fig.add_subplot(111, projection='3d')
data1=[]
for ret in reader:
x=float(ret[0])
y=float(ret[1])
z=float(ret[2])
data1.append([x,y,z])
print(x," ",y," ",z)
ax.scatter(x,y,z,('r', 'o', -50, -25))
ax.set_xlabel('X Label')
ax.set_ylabel('Y Label')
ax.set_zlabel('Z Label')
plt.title(file1)
plt.show()

2.绘制散点图+立体框
import matplotlib.pyplot as plt
file1=".\\file\\stone_points.txt"
file2=".\\file\\rois.txt"
stone_p=open(file1,"r",encoding='utf-8').readlines()
print(stone_p)
x,y,z=[],[],[]
for str in stone_p:
point=str.split("\t")
x.append(int(point[0]))
y.append(int(point[1]))
z.append(int(point[2]))
bevel=open(file2,"r",encoding='utf-8').readline()
ret=bevel.split("\t")
x_min,y_min,z_min,l,w,h=int(ret[0]),int(ret[1]),int(ret[2]),int(ret[3]),int(ret[4]),int(ret[5])
p0=[x_min,y_min,z_min]
p1=[x_min+l,y_min,z_min]
p2=[x_min+l,y_min+w,z_min]
p3=[x_min,y_min+w,z_min]
p4=[x_min,y_min,z_min+h]
p5=[x_min+l,y_min,z_min+h]
p6=[x_min+l,y_min+w,z_min+h]
p7=[x_min,y_min+w,z_min+h]
ax1=plt.axes(projection="3d")
ax1.scatter(x,y,z,cmap="Blues")
ax1.scatter(x,y,z)
ax1.plot3D([p0[0],p1[0],p2[0],p3[0],p0[0]],[p0[1],p1[1],p2[1],p3[1],p0[1]],[p0[2],p1[2],p2[2],p3[2],p0[2]],color="green")
ax1.plot([p4[0],p5[0],p6[0],p7[0],p4[0]],[p4[1],p5[1],p6[1],p7[1],p0[1]],[p4[2],p5[2],p6[2],p7[2],p4[2]],color="green")
ax1.plot([p0[0],p4[0]],[p0[1],p4[1]],[p0[2],p4[2]],color="green")
ax1.plot([p1[0],p5[0]],[p1[1],p5[1]],[p1[2],p5[2]],color="green")
ax1.plot([p2[0],p6[0]],[p2[1],p6[1]],[p2[2],p6[2]],color="green")
ax1.plot([p3[0],p7[0]],[p3[1],p7[1]],[p3[2],p7[2]],color="green")
ax1.set_xlabel("X")
ax1.set_ylabel("Y")
ax1.set_zlabel("Z")
ax1.invert_yaxis()
plt.show()


