Matlab绘图
- plot
- 事实上,往往上手的时候,就会个plot 就很牛叉了
- 样式的内容我们放在 plot3 里面了 就在下面一点点
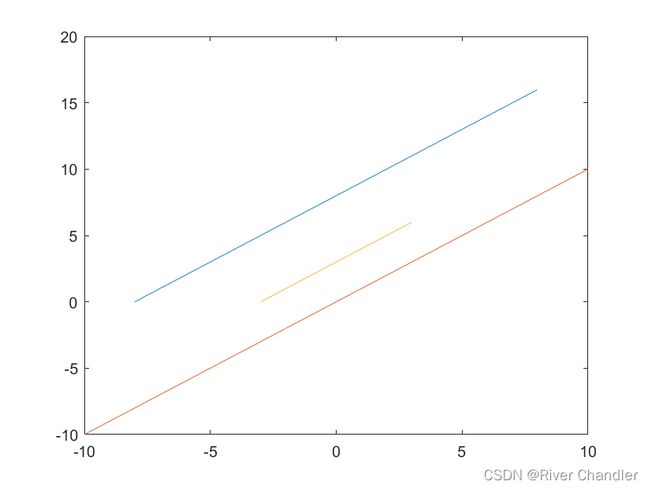
x1 = -8:1:8;
y1 = 0:1:16;
x2 = -10:2:10;
y2 = -10:2:10;
x3 = -3:0.5:3;
y3 = 0:0.5:6;
plot(x1,y1,x2,y2,x3,y3)
- subplot
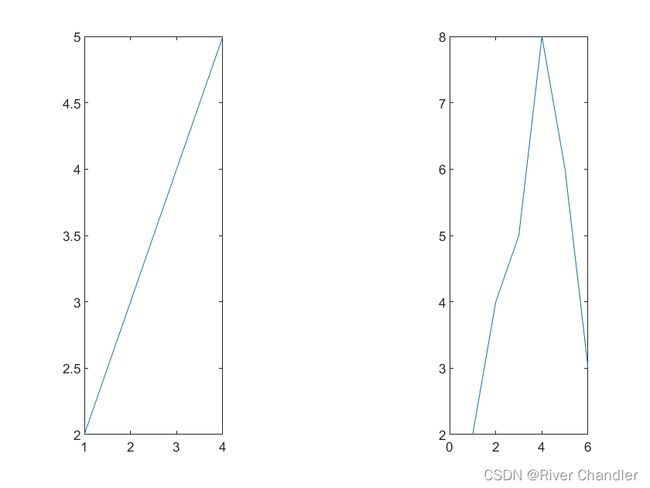
subplot(1,3,1)
plot([1,2,3,4],[2,3,4,5])
subplot(1,3,3)
plot([1,2,3,4,5,6],[2,4,5,8,6,3])- 极坐标系
theta = 0:pi/50:2*pi;
r = sin(2*theta);
h = polar(theta,r)
- plot3 函数
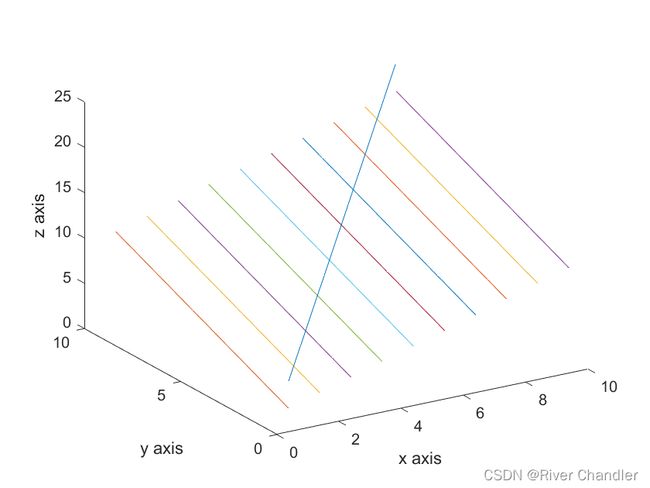
效果图
代码
x = 1:10;
y = 1:10;
z1 = x+y+2;
plot3(x,y,z1);
hold on;
[x2,y2] = meshgrid(x,y);
z2 = x2+y2-1
plot3(x2,y2,z2)
xlabel("x axis")
ylabel("y axis")
zlabel("z axis")
提示点
- plot3 三维绘图
- hold on
- matlab里面plot会先清空原图
- 需要 hold on 来使得我们可以在一张画上重复绘图
- meshgrid
- 使得可以生成一个网格
- xlabel,ylabel,zlabel
- 参数绘图
- 样式参数
| '-' | 实线 | o | 小圆圈 | r | 红色 |
| ‘:’ | 虚线 | * | 小星星 | b | 蓝色 |
| '-.' | 点划线 | s | 小方块 | k | 黑色 |
| ‘--’ | 双划线 | p | 五角星 | g | 绿色 |
| ^ | 向上的三角形 | ||||
| d | 棱形 | X | 叉号 | v | 向下的三角形 |
| < | 朝左的三角形 | + | 加号 | > | 朝右的三角形 |
| H | 六角形 |
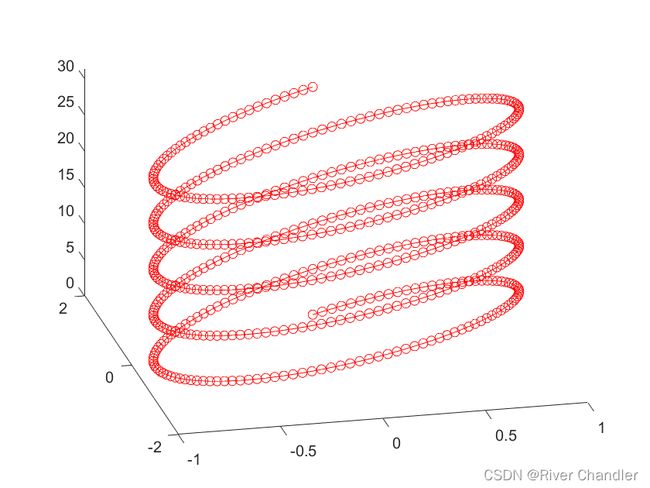
- 代码
t = 0:pi/60:10*pi;
x = sin(t);
y = cos(t)+sin(t);
plot3(x,y,t,'o-r')
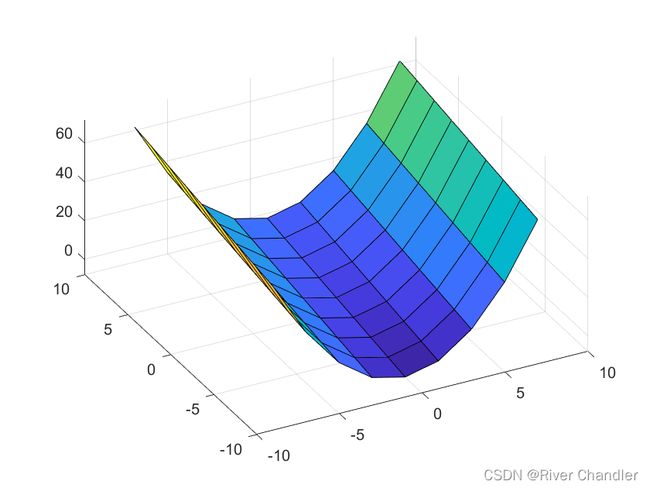
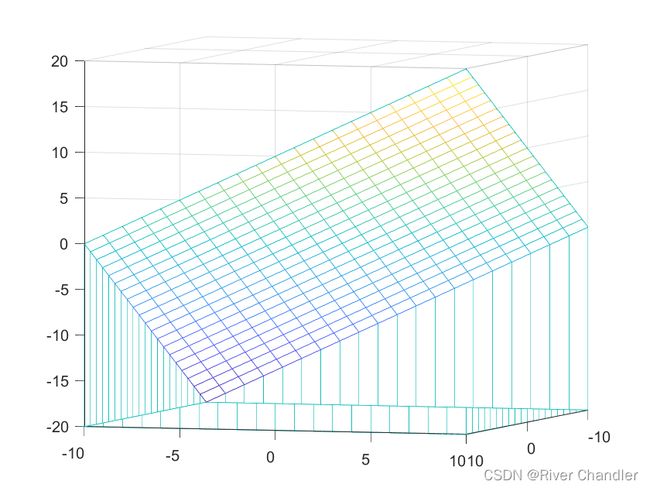
- meshz 指令
- 效果图
- 代码
x = -10:10;
y = -10:10;
[x1,y1] = meshgrid(x,y);
z1 = (x1 + y1);
meshz(x1,y1,z1)- tips
- vector. 如果涉及到一些复杂的操作(乘法以上)
- .* 点乘
- .^ 点乘幂
- .\ 左除(分母放在左边)
- ./ 右除
- 例如
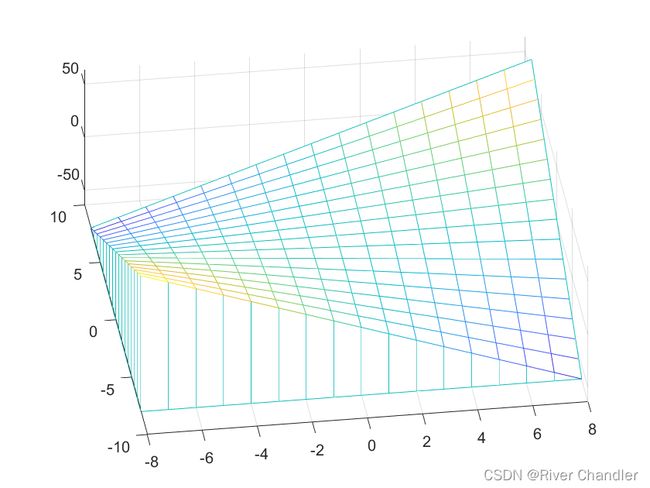
- 代码
- vector. 如果涉及到一些复杂的操作(乘法以上)
x1 = -8:8;
y1 = -8:8;
[X,Y] = meshgrid(x1,y1);
Z = (X.*Y);
meshz(X,Y,Z)
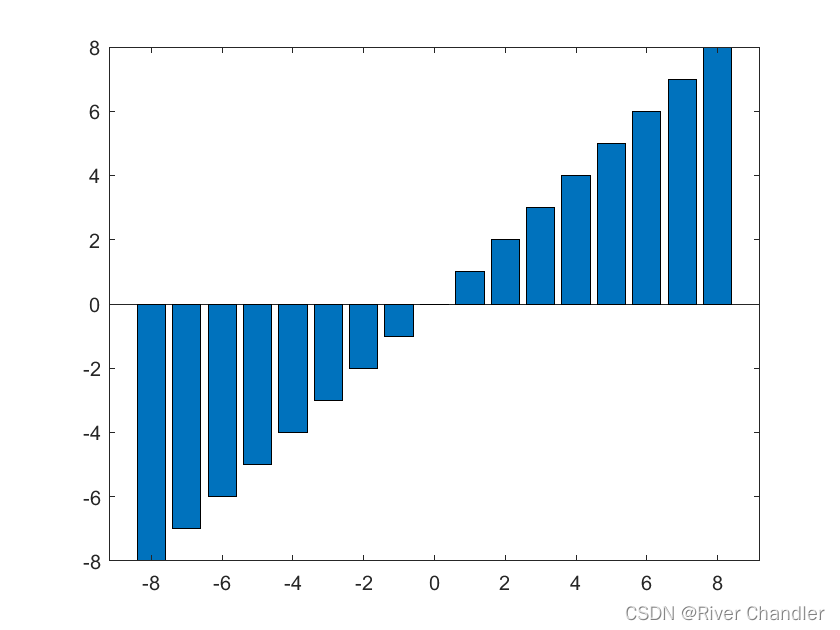
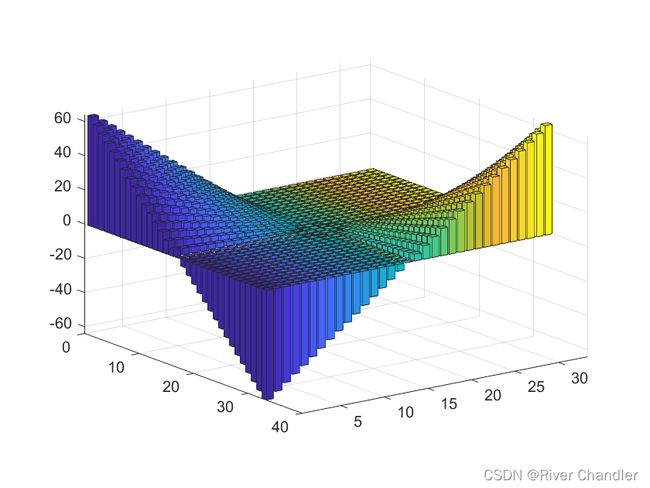
- bar 和 bar3
x1 = -8:8;
y1 = -8:8;
bar(x1,y1)
x = -8:.5:8;
y = -8:.5:8;
[x1 y1] = meshgrid(x,y);
z1 = x1.* y1
bar3(z1)
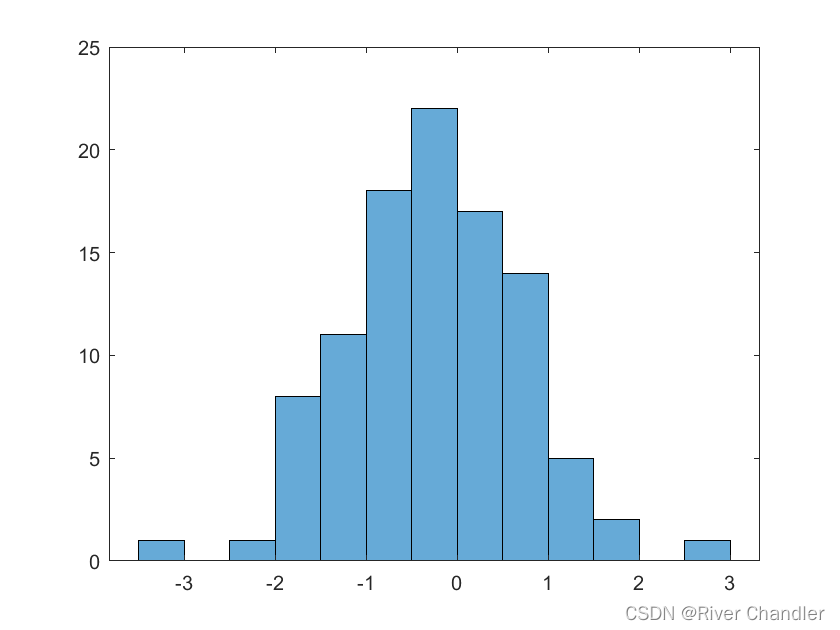
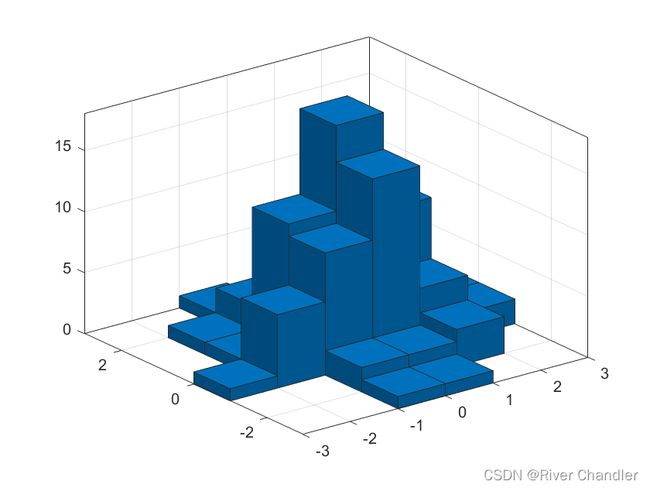
- histogram 和 histogram2
- randn 产生正态分布的随机数或矩阵的函数
x = randn(100,1);
y = randn(100,1);
histogram(x)
%histogram2(x,y)
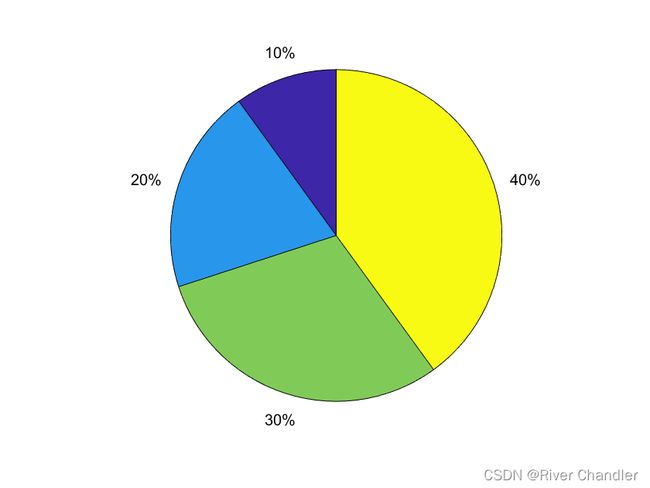
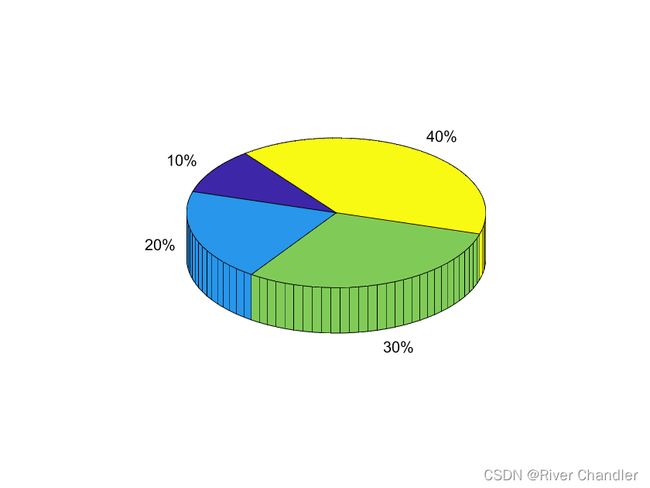
- pie 和 pie3
- 饼图表示的是每个元素占总和的比例
x = [15,30,45,60];
pie(x)
pie3(x)
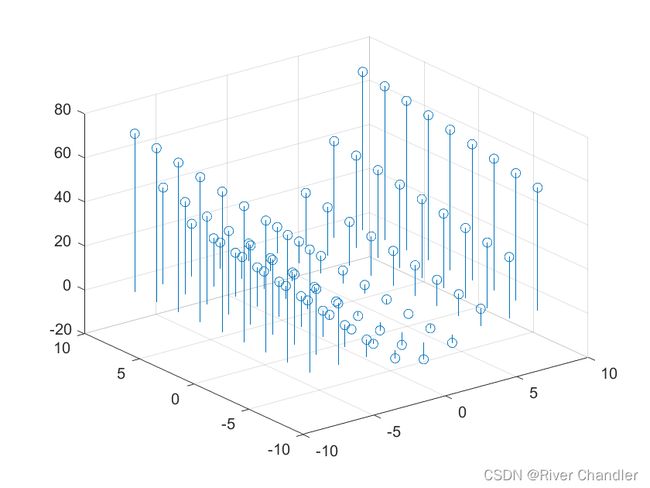
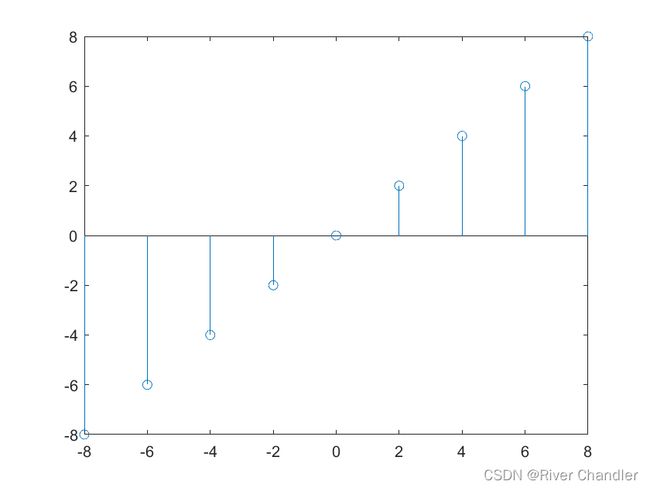
- stem 和 stem3
x = -8:2:8;
y = -8:2:8;
stem(x,y)
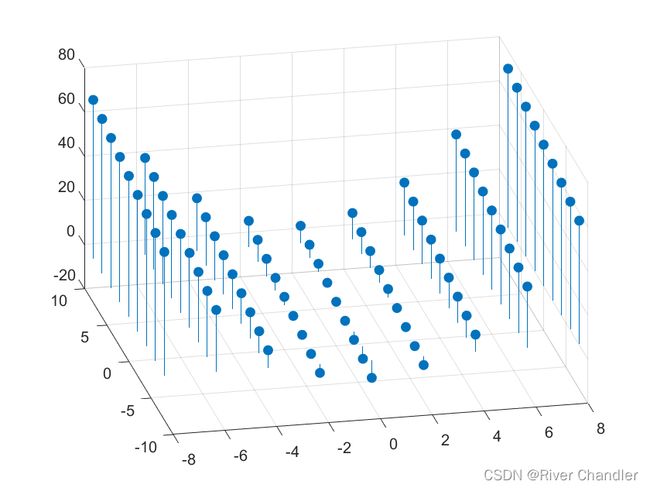
[x1 y1] = meshgrid(x,y);
z1 = x1.^2+y1;
%stem3(x1,y1,z1)- 参数 filled
stem3(x1,y1,z1,'filled')
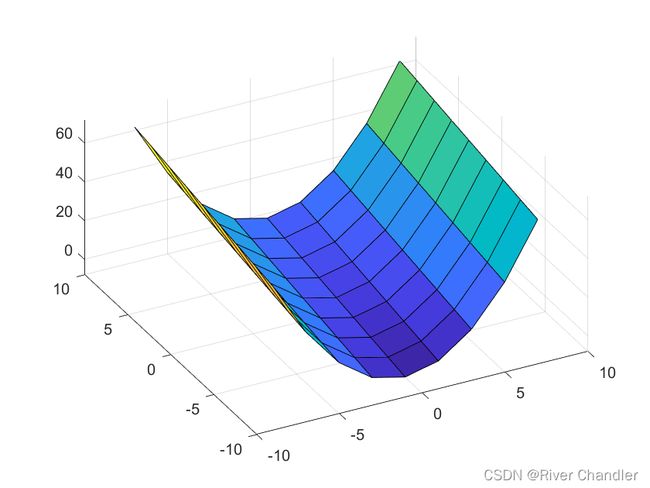
- surf
x = -8:2:8;
y = -8:2:8;
%stem(x,y)
[x1 y1] = meshgrid(x,y);
z1 = x1.^2+y1;
surf(x1,y1,z1)
