KLT降维与图像压缩(附MATLAB代码)
KLT降维与图像压缩
- KLT简述
- 步骤原理
- MATLAB代码
- 结果分析
KLT简述
KLT (Karhunen-Loeve Transform) 是变换编码 (Transform Coding) 的一种方法,它能够将数据转化为更利于压缩的一种形式,去除数据相关性造成的冗余。KLT一般也称为PCA (Principal Component Analysis) 或者EVD (Eigenvalue Decomposition), 在不同的课程和教材中它们可能有一些差别,但本文将要讲的图像压缩中的KLT指的就是计算图像协方差矩阵,保留较大的特征值和其对应的特征向量的方法。
步骤原理
-
首先将待处理的图像分割成n个 M × N M\times N M×N 的图像块,并将图像块中数据按照从左到右,从上到下的顺序重新排列成一个列向量,每一个列向量长度为 M × N M\times N M×N,共有 N T N_{T} NT个这样的列向量,第 i i i个列向量为 x n i \bm{x}_{ni} xni
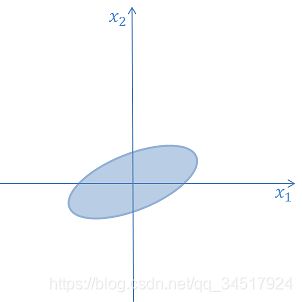
以二维向量为例,假设每一个向量可以表示为 [ x 1 , x 2 ] T \left [x_1,x_2 \right ]^T [x1,x2]T,那么可以将这些数据点表示在二维平面内,如下图所示,椭圆内为二维向量分布点。 -
数据中心化: x = x n i − x ˉ \bm{x}=\bm{x}_{ni}-\bar{\bm{x}} x=xni−xˉ ,其中 x ˉ \bar{\bm{x}} xˉ为所有列向量的均值。可以看作将数据集平移至原点。
-
计算协方差矩阵 C \bm{C} C
C = E [ x x T ] = E [ ( x n i − x ˉ ) ( x n i − x ˉ ) T ] \bm{C}=E\left [\bm{x}\bm{x}^{T} \right ]=E\left [(\bm{x}_{ni}-\bar{\bm{x}})(\bm{x}_{ni}-\bar{\bm{x}})^{T} \right ] C=E[xxT]=E[(xni−xˉ)(xni−xˉ)T]
C = 1 N T − 1 ∑ i = 1 N T ( x n i − x ˉ ) ( x n i − x ˉ ) T \bm{C}=\frac{1}{N_{T}-1}\sum_{i=1}^{N_{T}}(\bm{x}_{ni}-\bar{\bm{x}})(\bm{x}_{ni}-\bar{\bm{x}})^{T} C=NT−11∑i=1NT(xni−xˉ)(xni−xˉ)T
x ˉ = 1 N T ∑ i = 1 N T x n i \bar{\bm{x}}=\frac{1}{N_{T}}\sum_{i=1}^{N_{T}}\bm{x}_{ni} xˉ=NT1∑i=1NTxni
-
计算协方差矩阵的特征值和特征向量。特征值为 λ 1 \lambda _{1} λ1, λ 2 \lambda _{2} λ2,…, λ K \lambda _{K} λK,分别对应的特征向量为 p 1 \bm{p}_{1} p1, p 2 \bm{p}_{2} p2,…, p K \bm{p}_{K} pK,其中 K = M × N K=M\times N K=M×N。这样协方差矩阵可以表示为:
C = P D P T \bm{C}=\bm{PDP^{T}} C=PDPT
P = [ p 1 , p 2 , . . . , p K ] P=\left [ \bm{p}_{1},\bm{p}_{2},...,\bm{p}_{K} \right ] P=[p1,p2,...,pK]
D = d i a g ( λ 1 , λ 2 , . . . , λ K ) D=diag( \lambda _{1},\lambda _{2},...,\lambda _{K}) D=diag(λ1,λ2,...,λK)
-
向量的分解和合成:
x = ∑ i = 1 K c i p i \bm{x}=\sum_{i=1}^{K}c_{i}\bm{p}_{i} x=∑i=1Kcipi
c i = p i T x c_{i}=\bm{p}_{i}^{T}\bm{x} ci=piTx, i = 1 , 2 , . . . , K i=1,2,...,K i=1,2,...,K
-
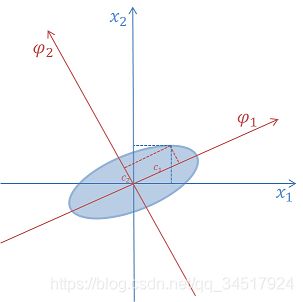
保留较大的特征值和其对应的特征矩阵,舍弃较小的特征值,近似地重构原向量,达到降维或者说压缩的目的。
x ^ = ∑ i = 1 r c i p i \hat{\bm{x}}=\sum_{i=1}^{r}c_{i}\bm{p}_{i} x^=∑i=1rcipi, r < K r<K r<K
如图中保留 c 1 c_{1} c1,舍弃 c 2 c_{2} c2,只需要一个参数就能表达原来两个参数的信息,并能实现较小的误差。
MATLAB代码
选用的原图为lena 512*512灰度图像,切分成的图像块大小为4*4,得到的向量长度应该为16,下面为图像进行KLT压缩的代码,输出分别保留1到16个特征值的MSE (Mean Square Error)的值。
%% load image and cast to double dtype
clear;
img=imread('lena512.bmp');
figure(1);
subplot(1,2,1);
imshow(img);
title('original image');
gray_values=double(img);
%% divide the image into several 4*4 block
num_batch=512/4;
blocks=mat2cell(gray_values,4*ones(1,num_batch),4*ones(1,num_batch));
% vector length is 16
x=zeros(16,num_batch^2);
% map the block into column vector
for ii=1:num_batch
    for jj=1:num_batch
        x(:,(ii-1)*num_batch+jj)=reshape(blocks{ii,jj}',[16,1]);
    end
end
%% mean and covariance
x_mean=mean(x,2);
num_vectors=size(x,2);
temp_C=zeros(16,16);
for ii=1:num_vectors
    temp_C=temp_C+(x(:,ii)-x_mean)*(x(:,ii)-x_mean)';
end
C=1/(num_vectors-1)*temp_C;
%% eigenvalues and eigen vectors
eigenvalues=eig(C)';
[P,D]=eig(C);
% 16 eigenvalues are  1.0e+04 *
% 0.0007  0.0009  0.0011  0.0011  0.0013  0.0019  0.0022  0.0036
% 0.0041  0.0052  0.0063  0.0161  0.0197  0.0421  0.1047  3.4533
% select the eigenvalues and the corresponding eigenvectors
% from larger to smaller
MSE=zeros(1,16);
for select_numbers=1:16
%     select_numbers=5;
    selected_p=zeros(16,select_numbers);
    for ii=1:select_numbers
        selected_p(:,ii)=P(:,17-ii);
    end
    %% calculate the principle components
    comp=zeros(select_numbers,num_vectors);
    for jj=1:num_vectors
        for ii=1:select_numbers
            comp(ii,jj)=selected_p(:,ii)'*x(:,jj);
        end
    end
    %% calculate the estimated vectors
    x_estimated=zeros(size(x));
    for jj=1:num_vectors
        for ii=1:select_numbers
            x_estimated(:,jj)=x_estimated(:,jj)+comp(ii,jj)*selected_p(:,ii);
        end
    end
    %% reconstruct the image with the estimated vectors
    new_block=zeros(4,4,num_vectors);
    for ii=1:num_vectors
        new_block(:,:,ii)=reshape(x_estimated(:,ii),[4,4])';
    end
    reconstruct_img=zeros(512,512);
    for start_row=1:4:512
        for start_column=1:4:512
            reconstruct_img(start_row:(start_row+3),start_column:(start_column+3))= ...
                new_block(:,:,floor(start_row/4)*num_batch+floor(start_column/4)+1);
        end
    end
    square_error=(reconstruct_img-gray_values).^2;
    MSE(select_numbers)=mean(square_error(:));
    %%
%     subplot(1,2,2);
%     imshow(reconstruct_img,[]);
%     title('reconstructed image');
end
figure(2);
plot(1:16,MSE);
xlabel('The number of retained coefficients');
ylabel('MSE between original and reconstructed image');
结果分析

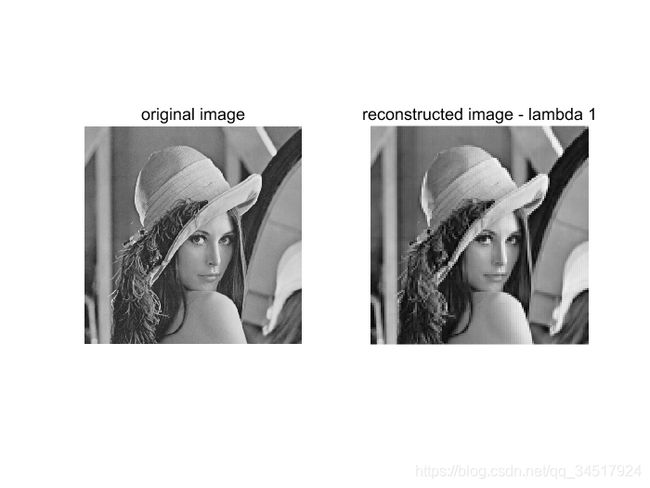
可以看出保留特征值数越多,重建图像误差越小,下面来展示下重建后图像的样子。
保留一个特征值:

可以看出图片失真较为明显。保留5个特征值时图像重建后与原图像的误差已经很难分辨出来:

KLT有着良好的压缩率和图像压缩质量,然而也有一定的局限性。首先KLT变换是基于图片的,特征值和特征向量是基于当前图片得到的,应用于其他图片效果不一定好。此外KLT需要计算协方差矩阵,计算复杂度较高。


